




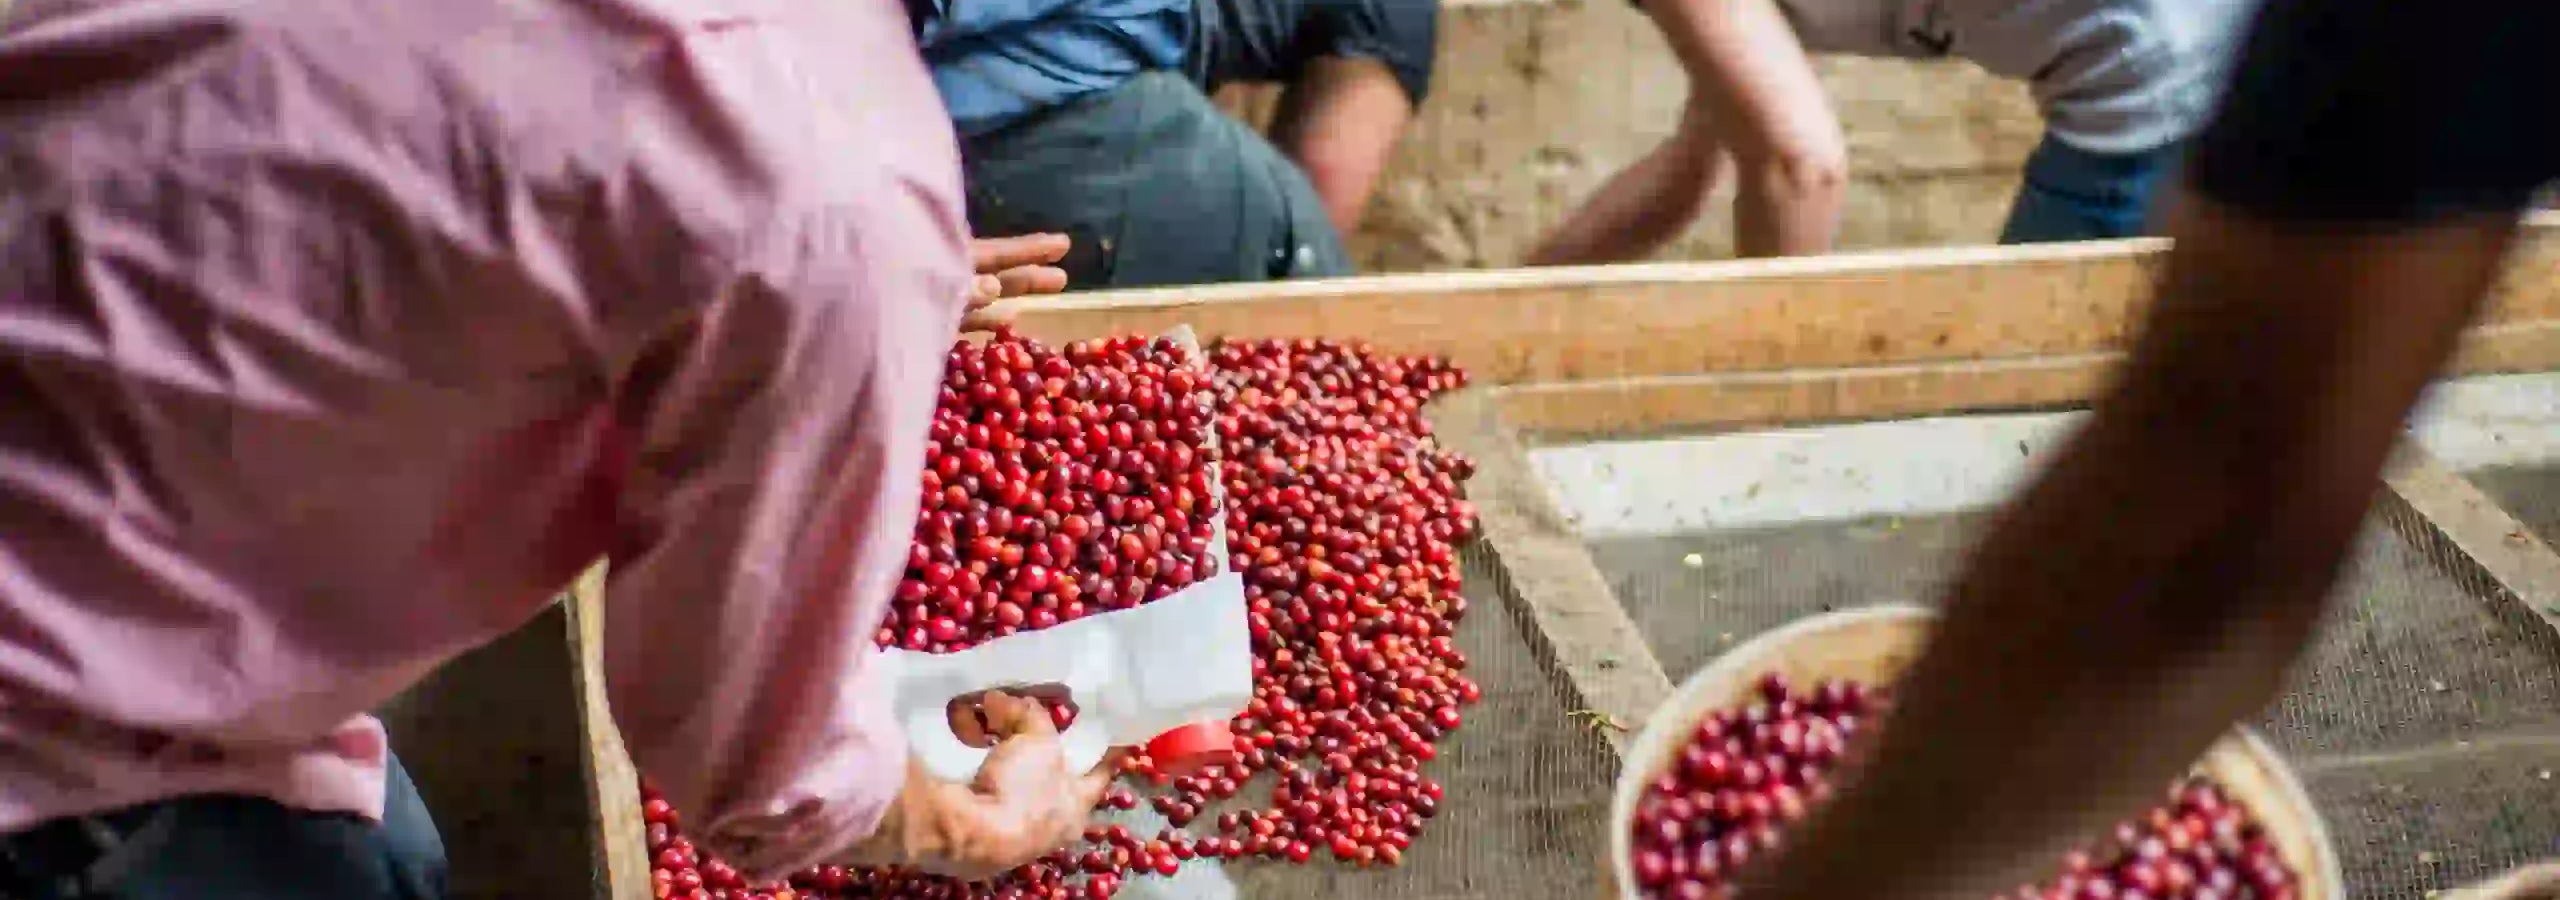
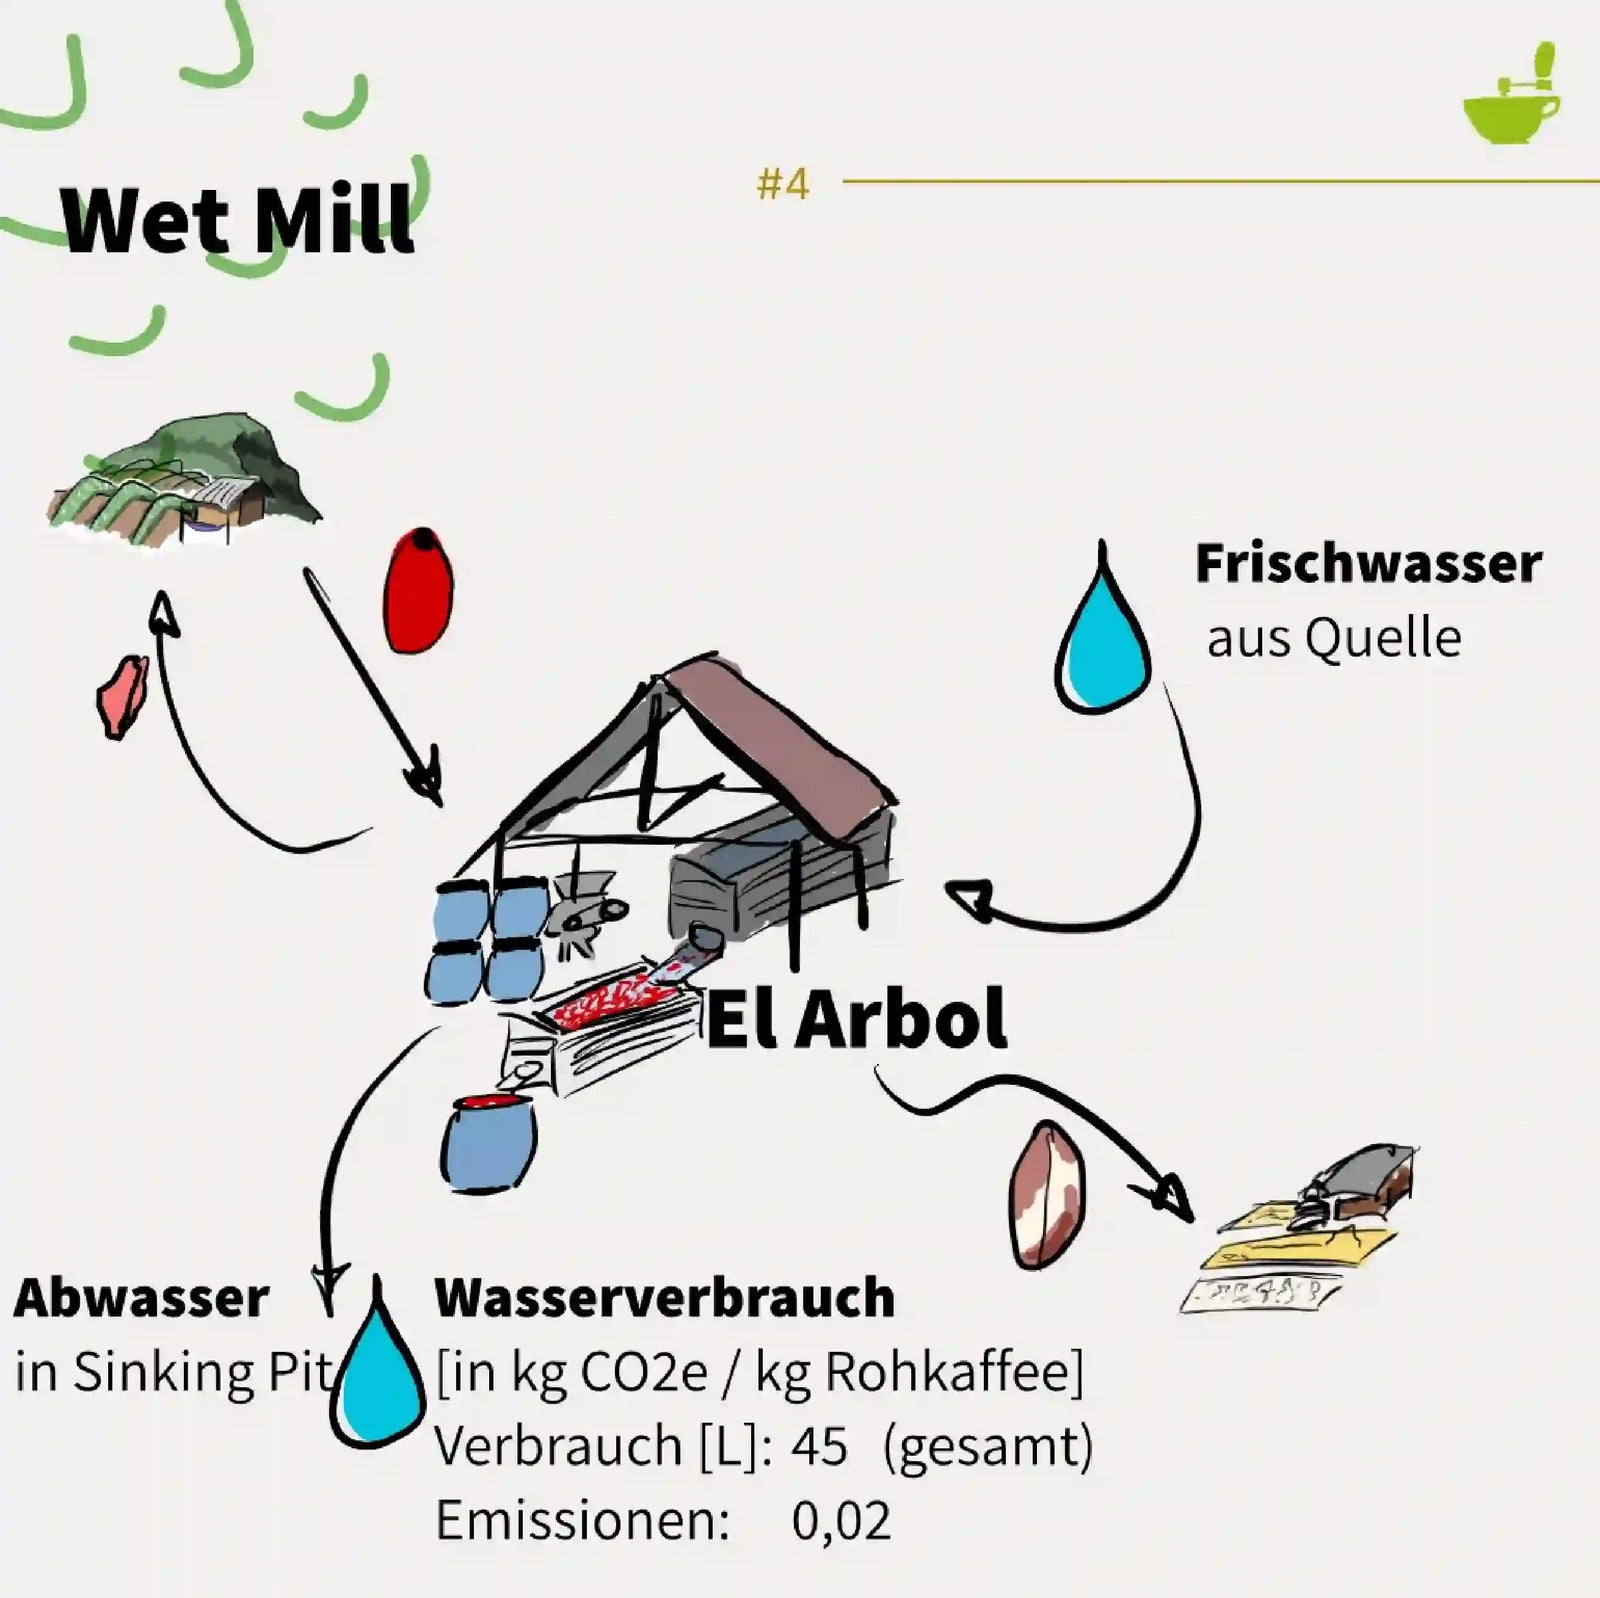
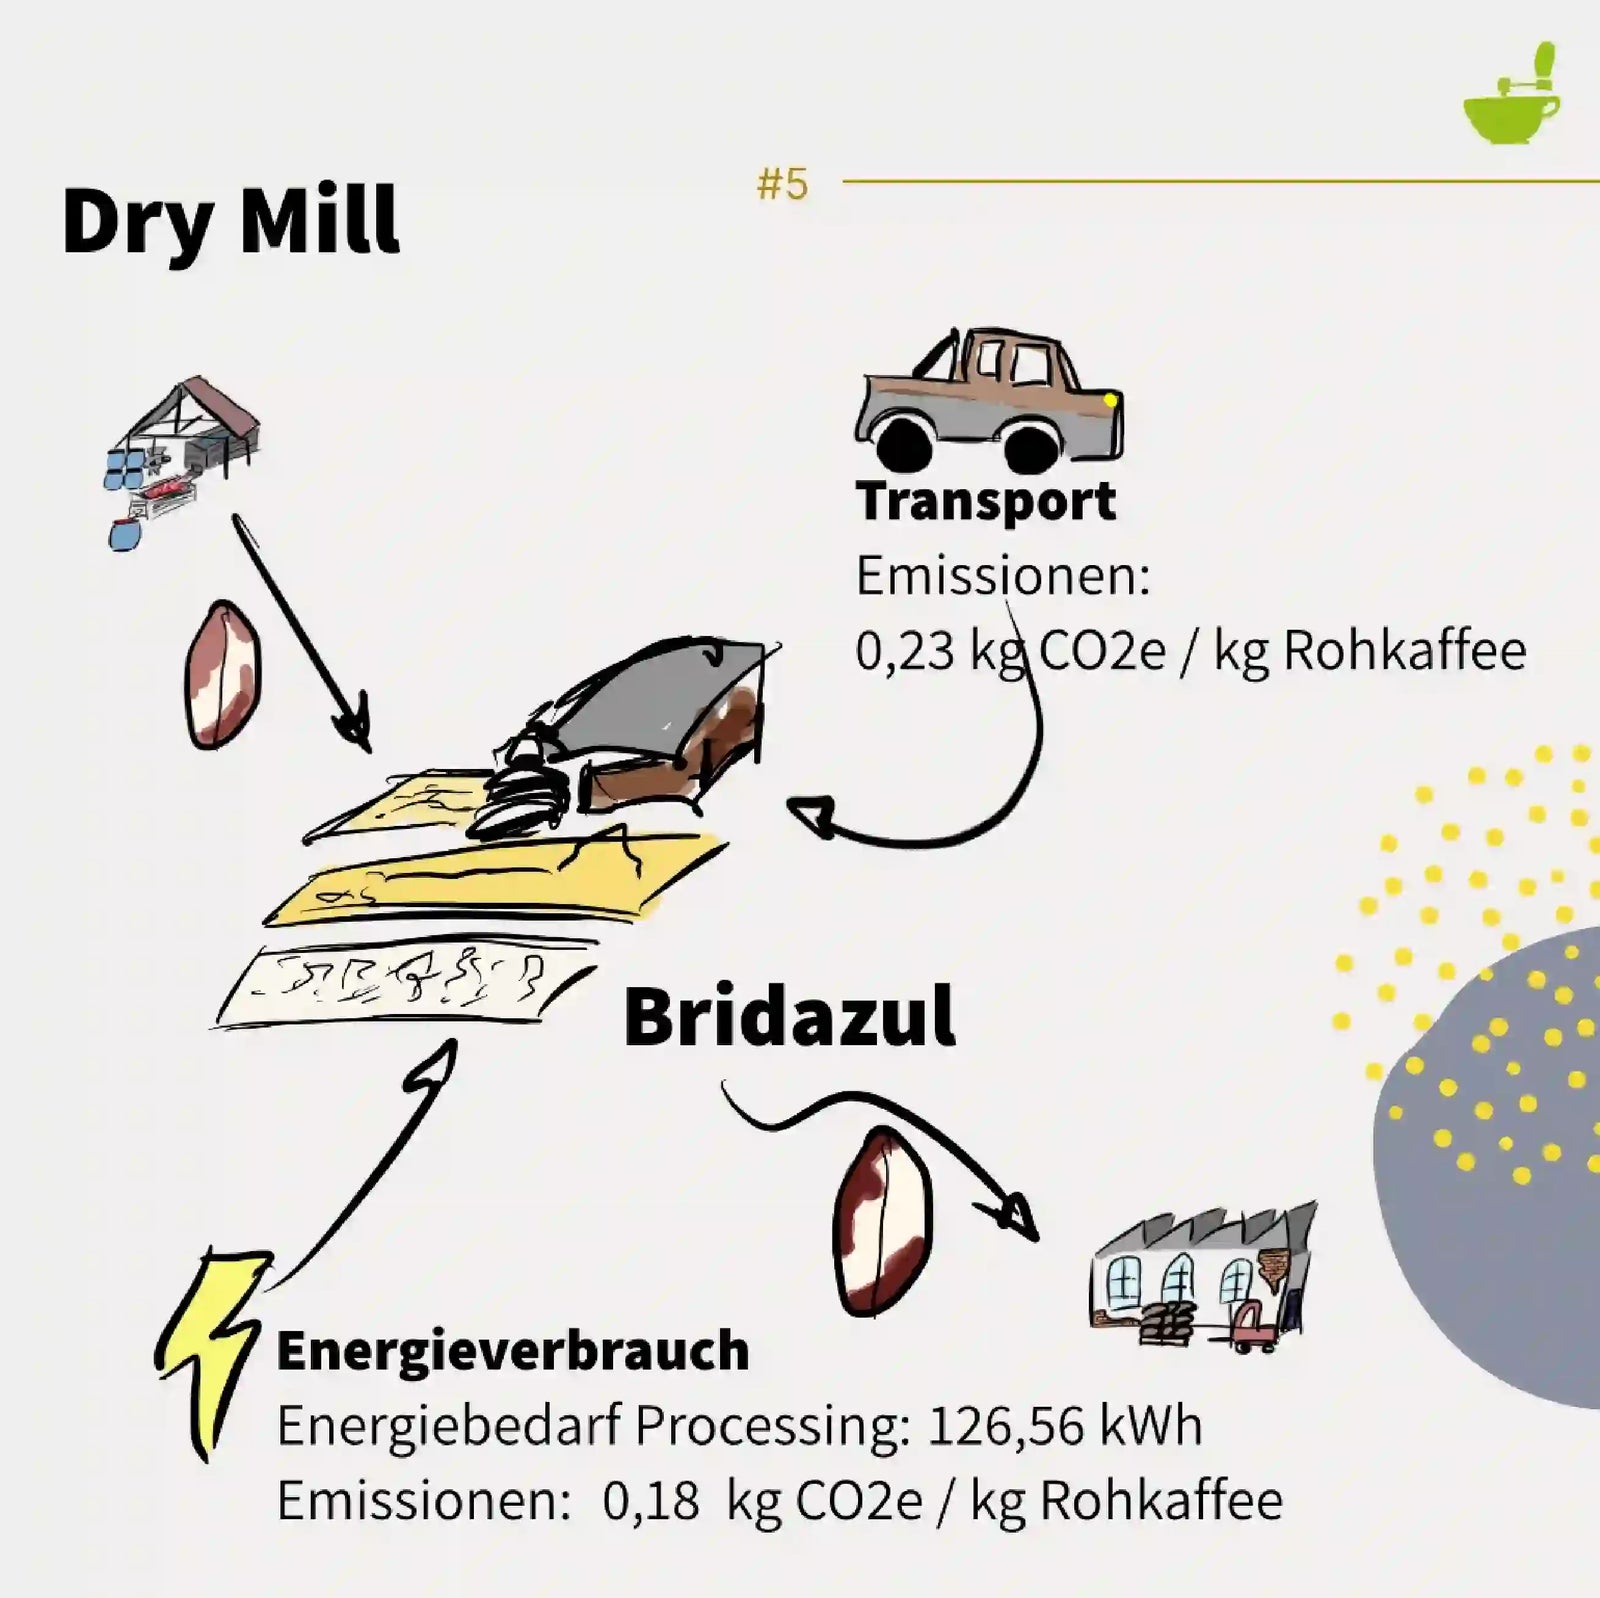
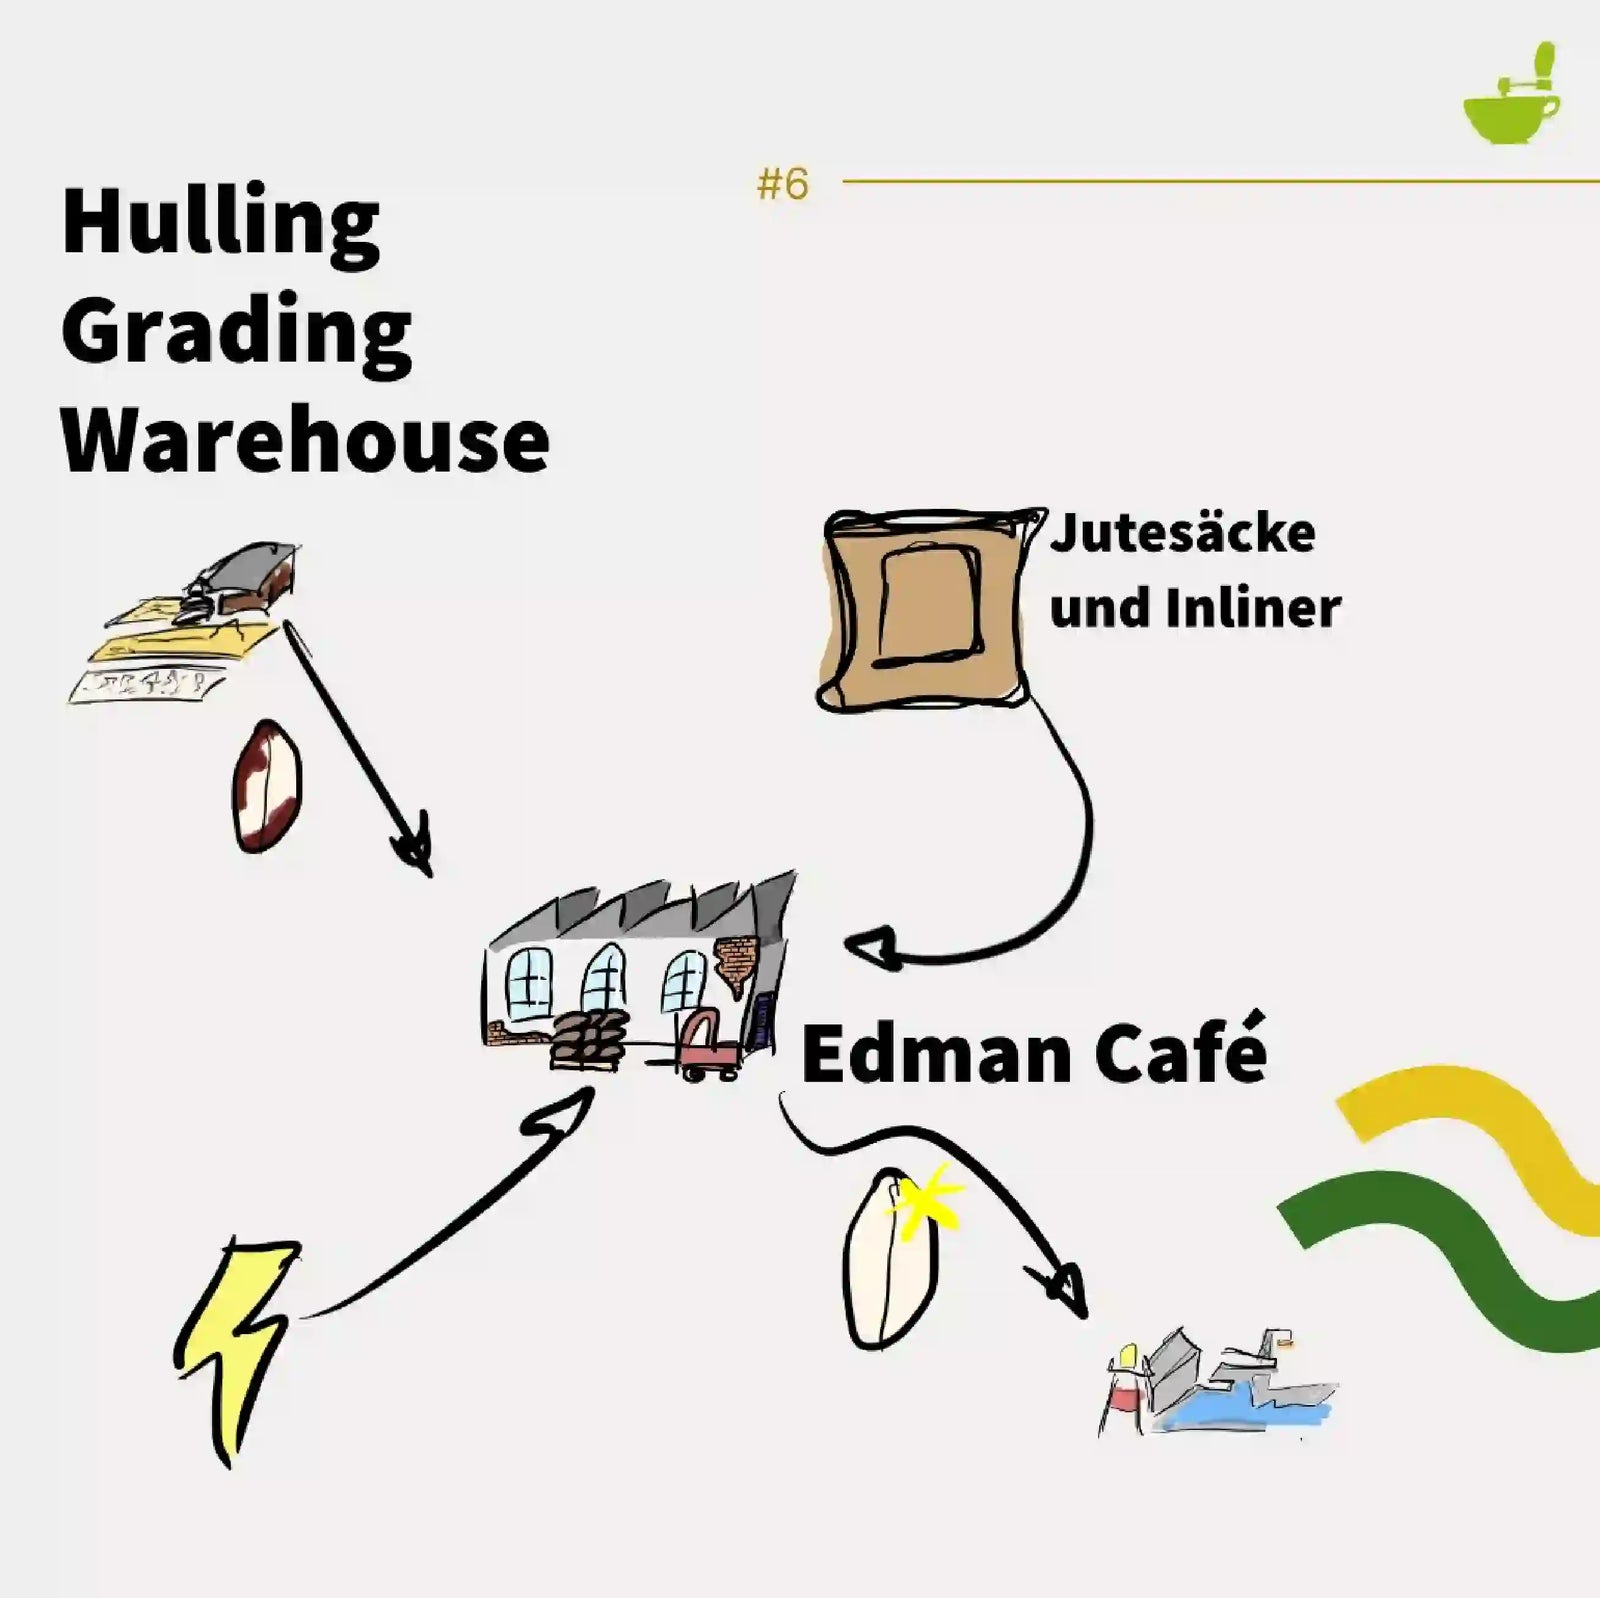
Emissions naturally arise in the coffee chain. We wanted to better understand where, how, and why they occur. We analyzed, calculated, and contextualized. Based on our own farm in Nicaragua, we established a calculation method that we can now apply to all our coffee supply chains.
From tree to cup
Now we know exactly how many emissions occur throughout the entire coffee chain
This knowledge now helps us, together with our partners, to develop specific solutions and implement them in projects.
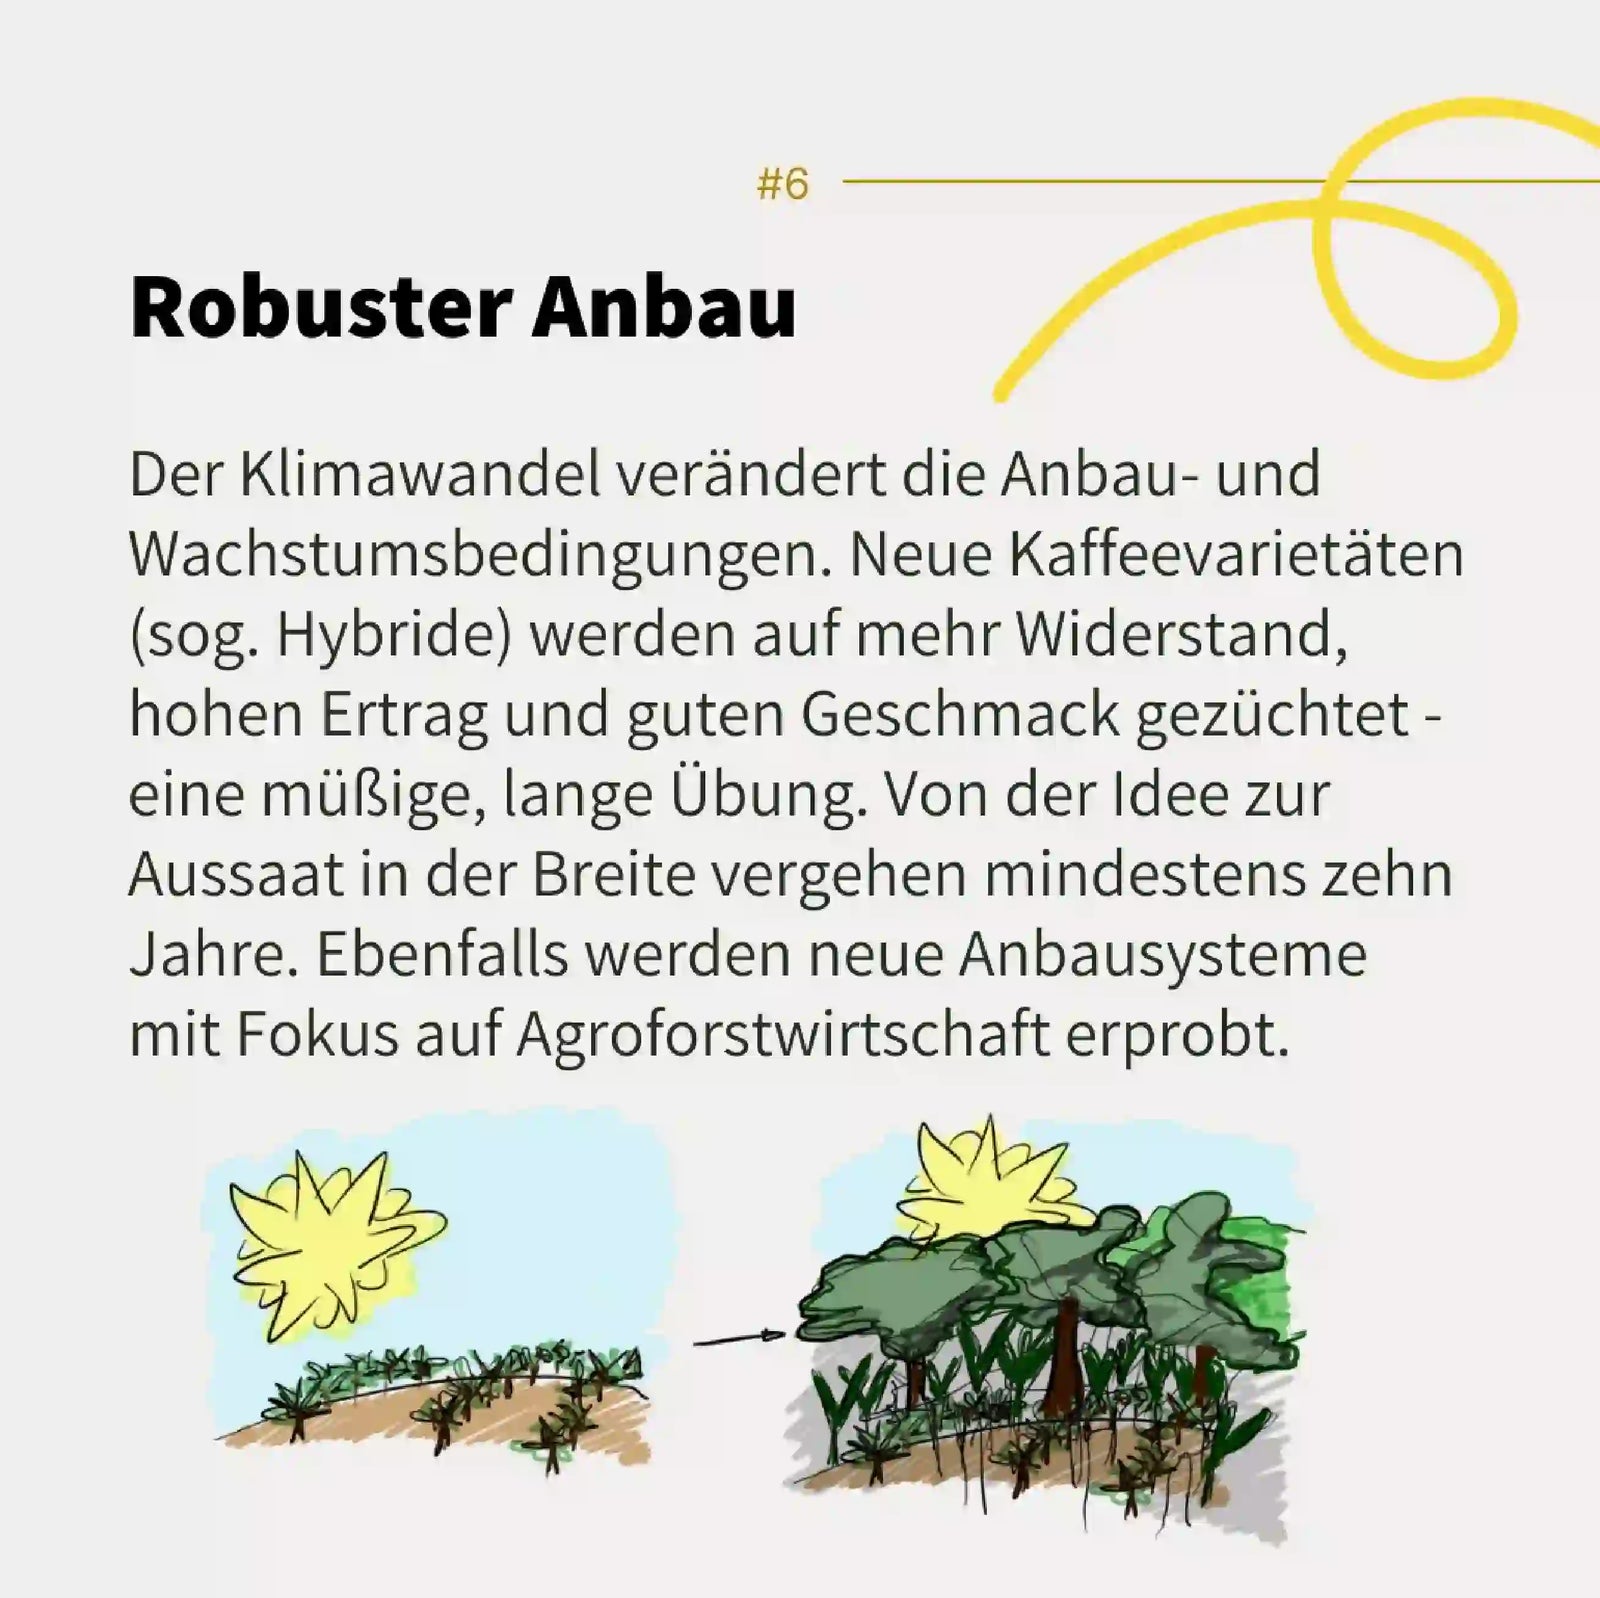
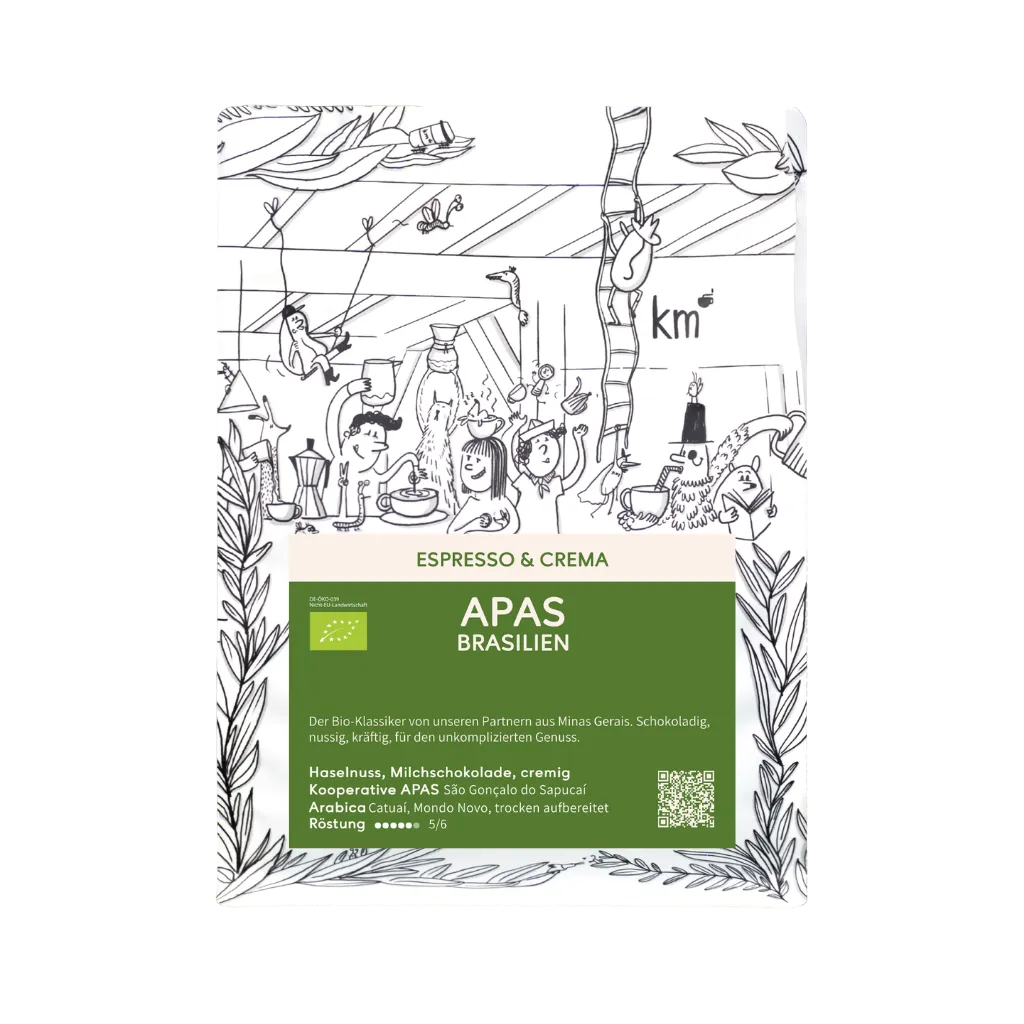
In Brazil, the Apas cooperative has switched to organic production. In Nicaragua, we will manufacture our own fertilizer. And in Mexico, we work with our partners to ensure that agroforestry has a positive impact on the household income of small-scale producers.
Regarding the posts: in January 2024, we published this series of graphics on social media. The posts have a strong CO₂ focus. This represents "only" the global warming potential (GWP-100). In a holistic view, land use change, water acidification, and especially social factors must not be overlooked.
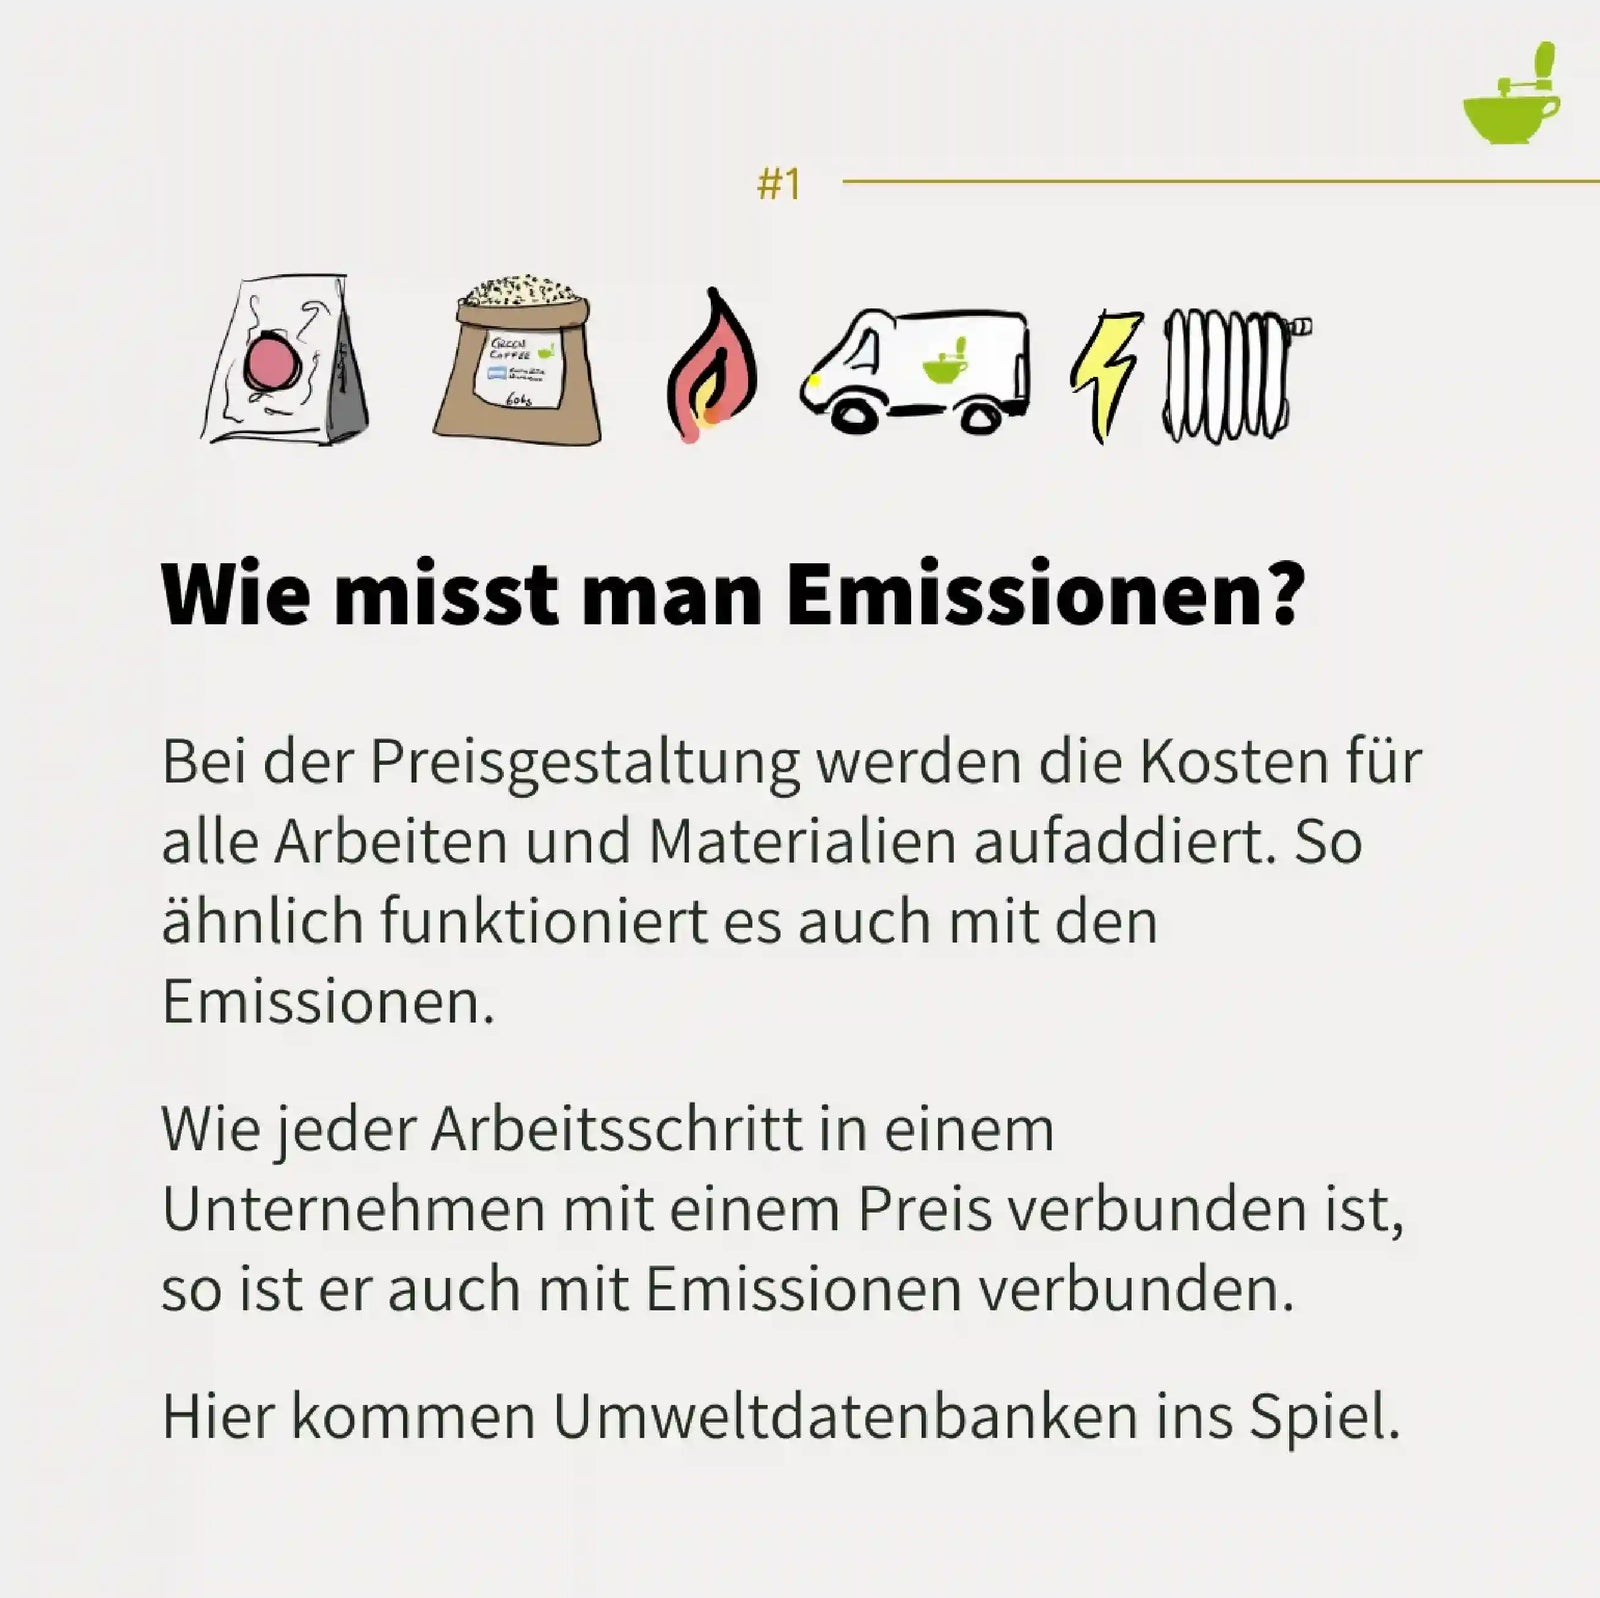
How do you measure emissions?
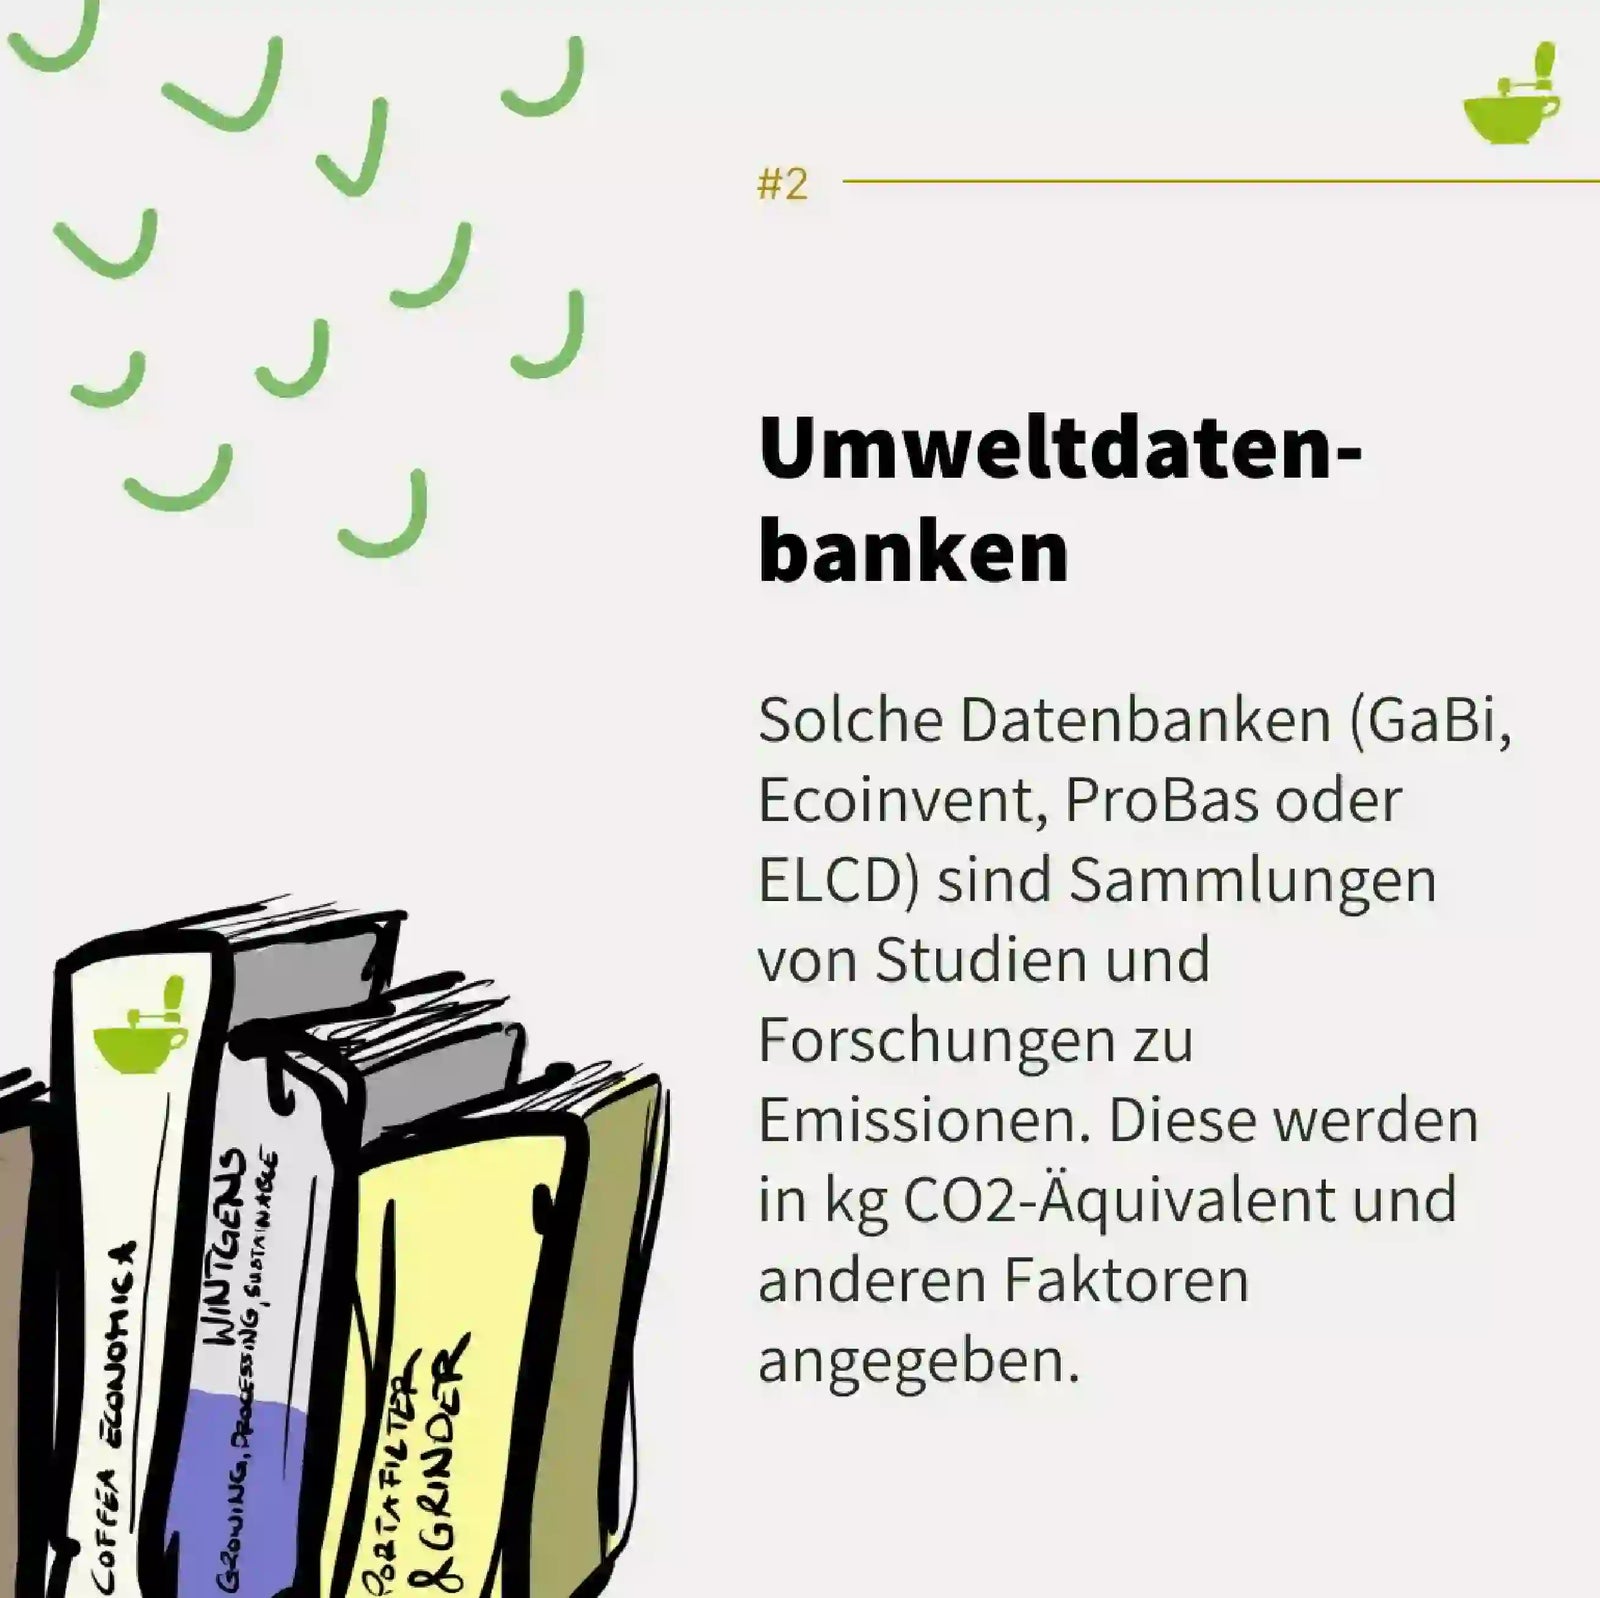
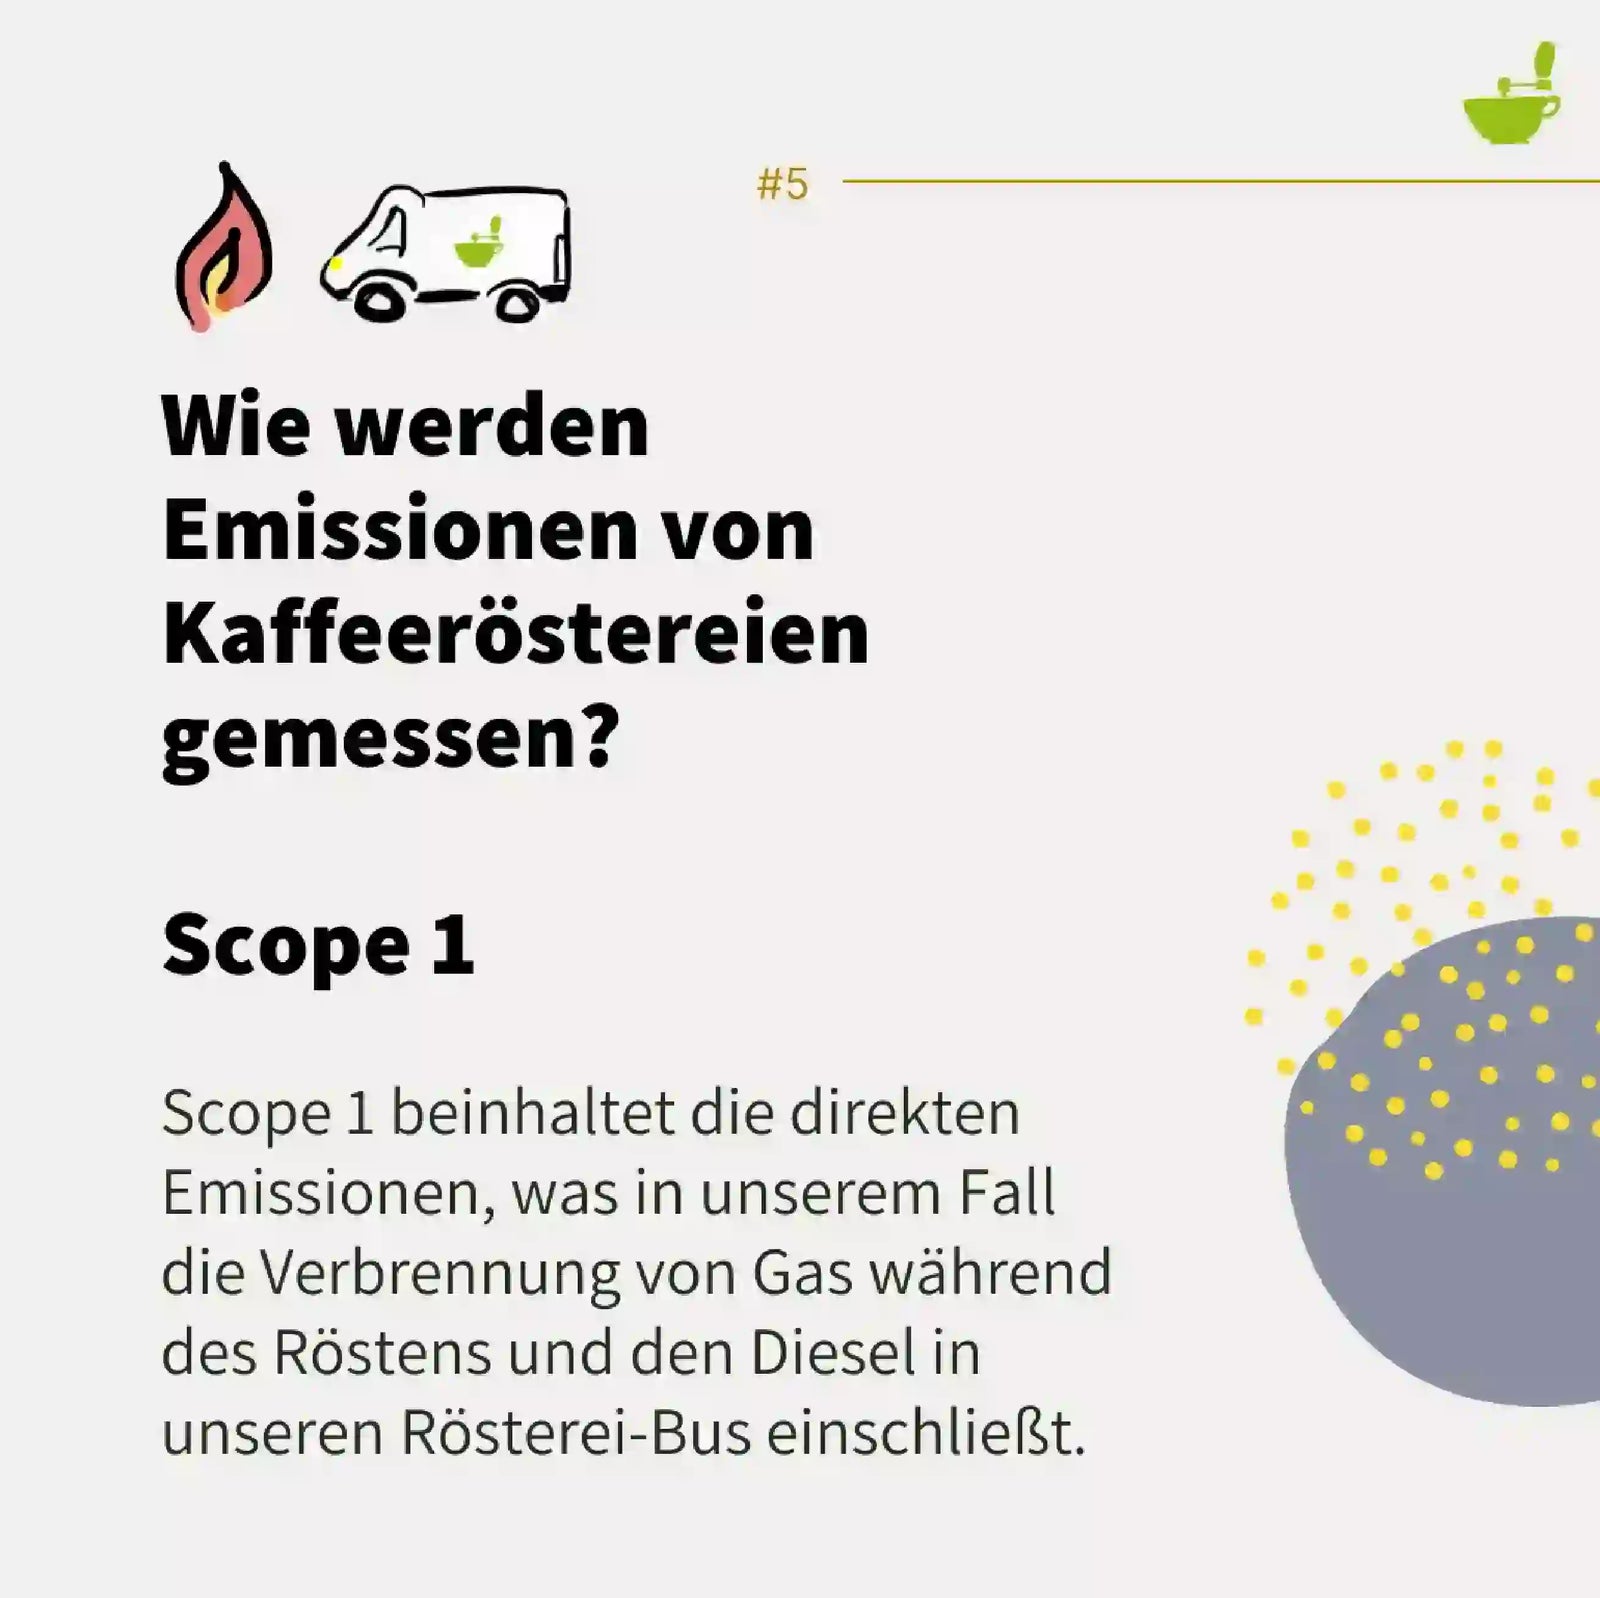
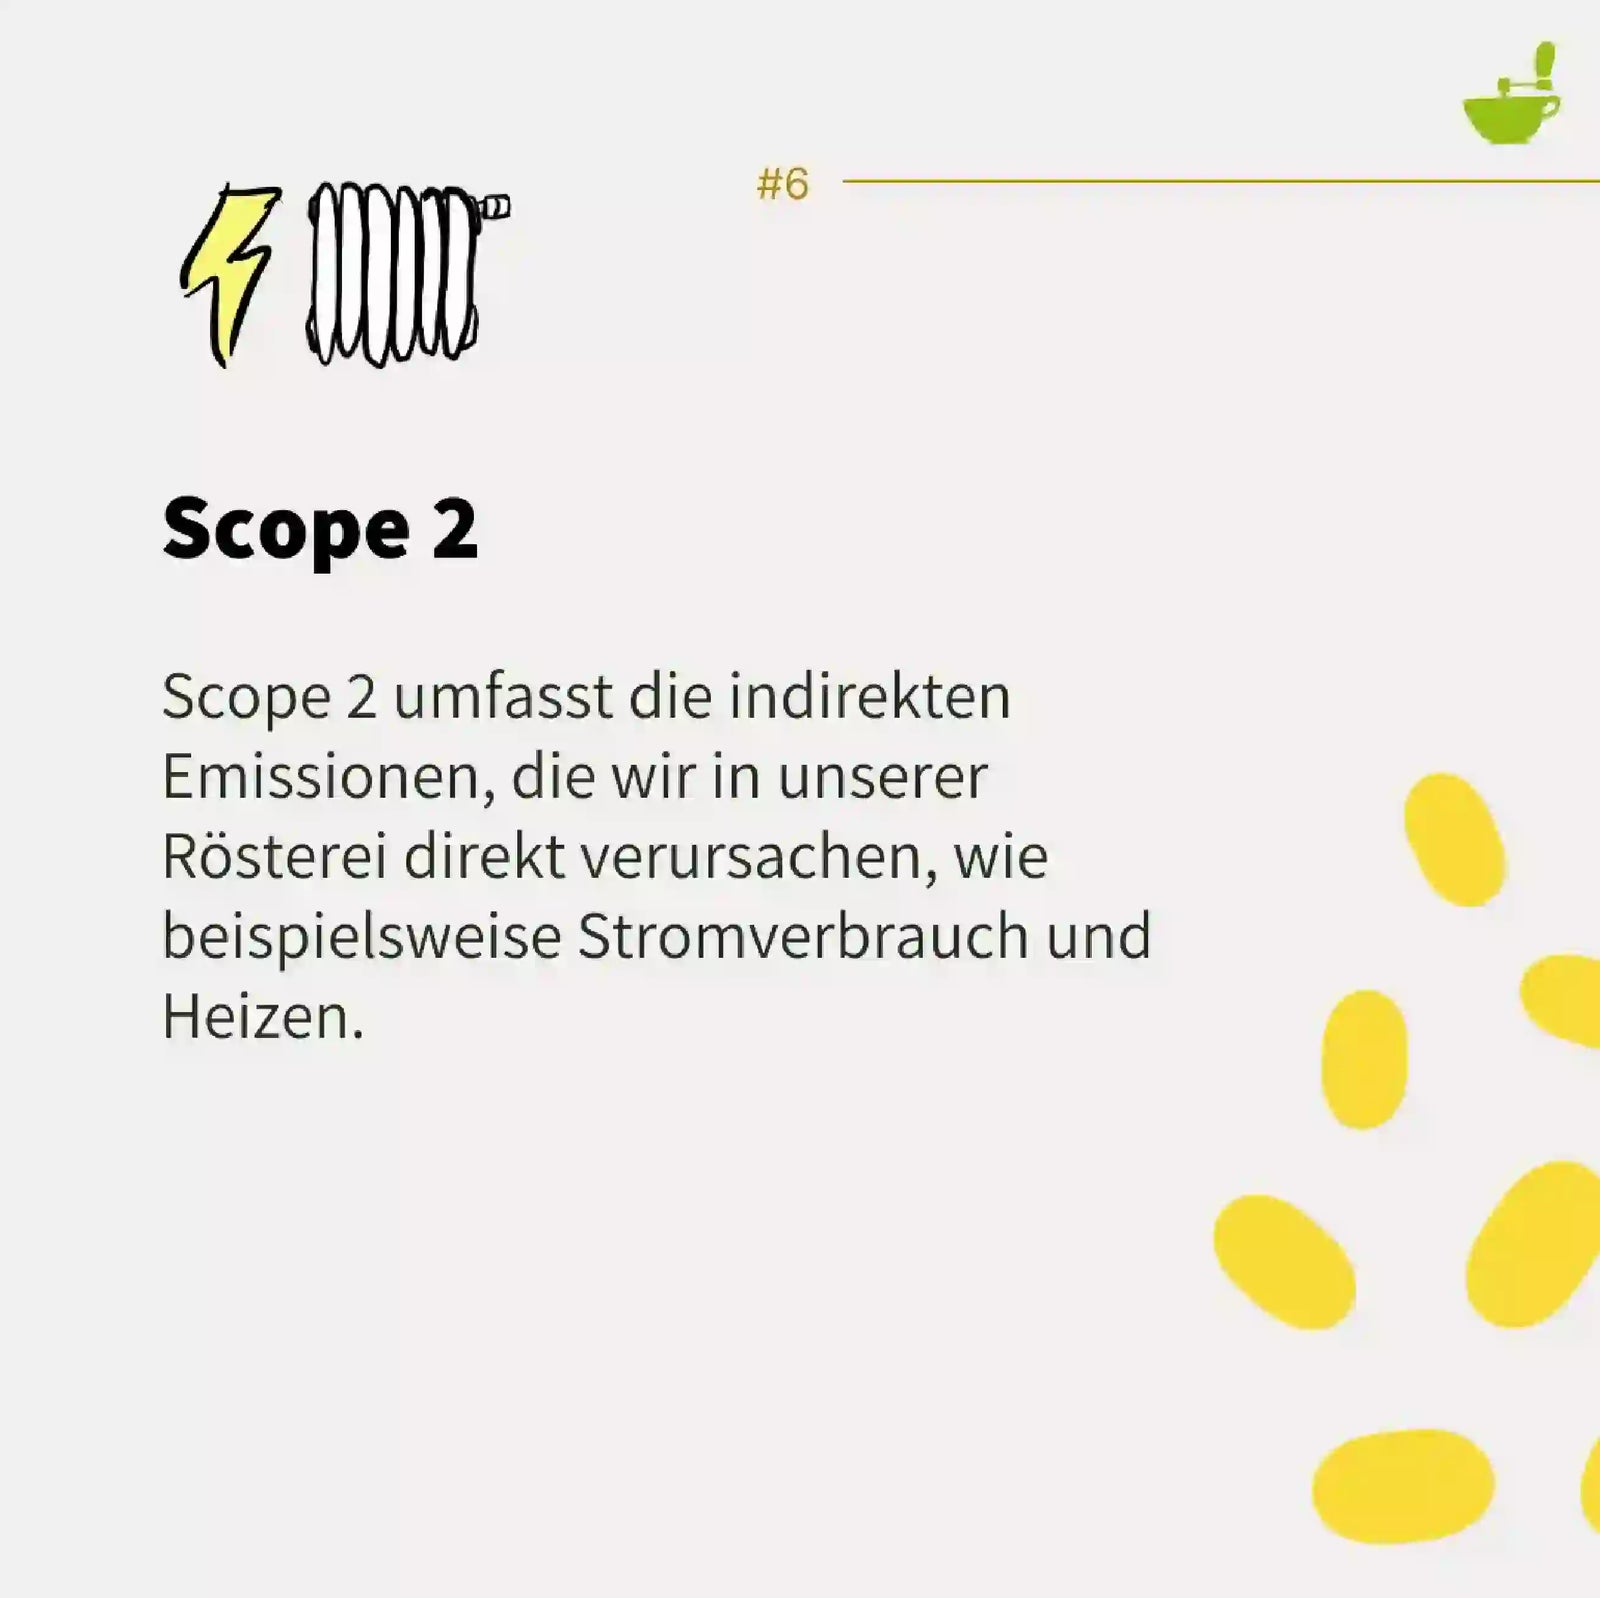
The Greenhouse Gas Protocol is the standard for measuring and accounting for greenhouse gas emissions, which we follow. The calculation is also called Life Cycle Assessment or LCA. As of January 2024, we calculated the CO₂ footprint of our Santa Rita coffee for harvest 21/22, the transport from Nicaragua to us in Basel, and the roastery emissions for 2022.
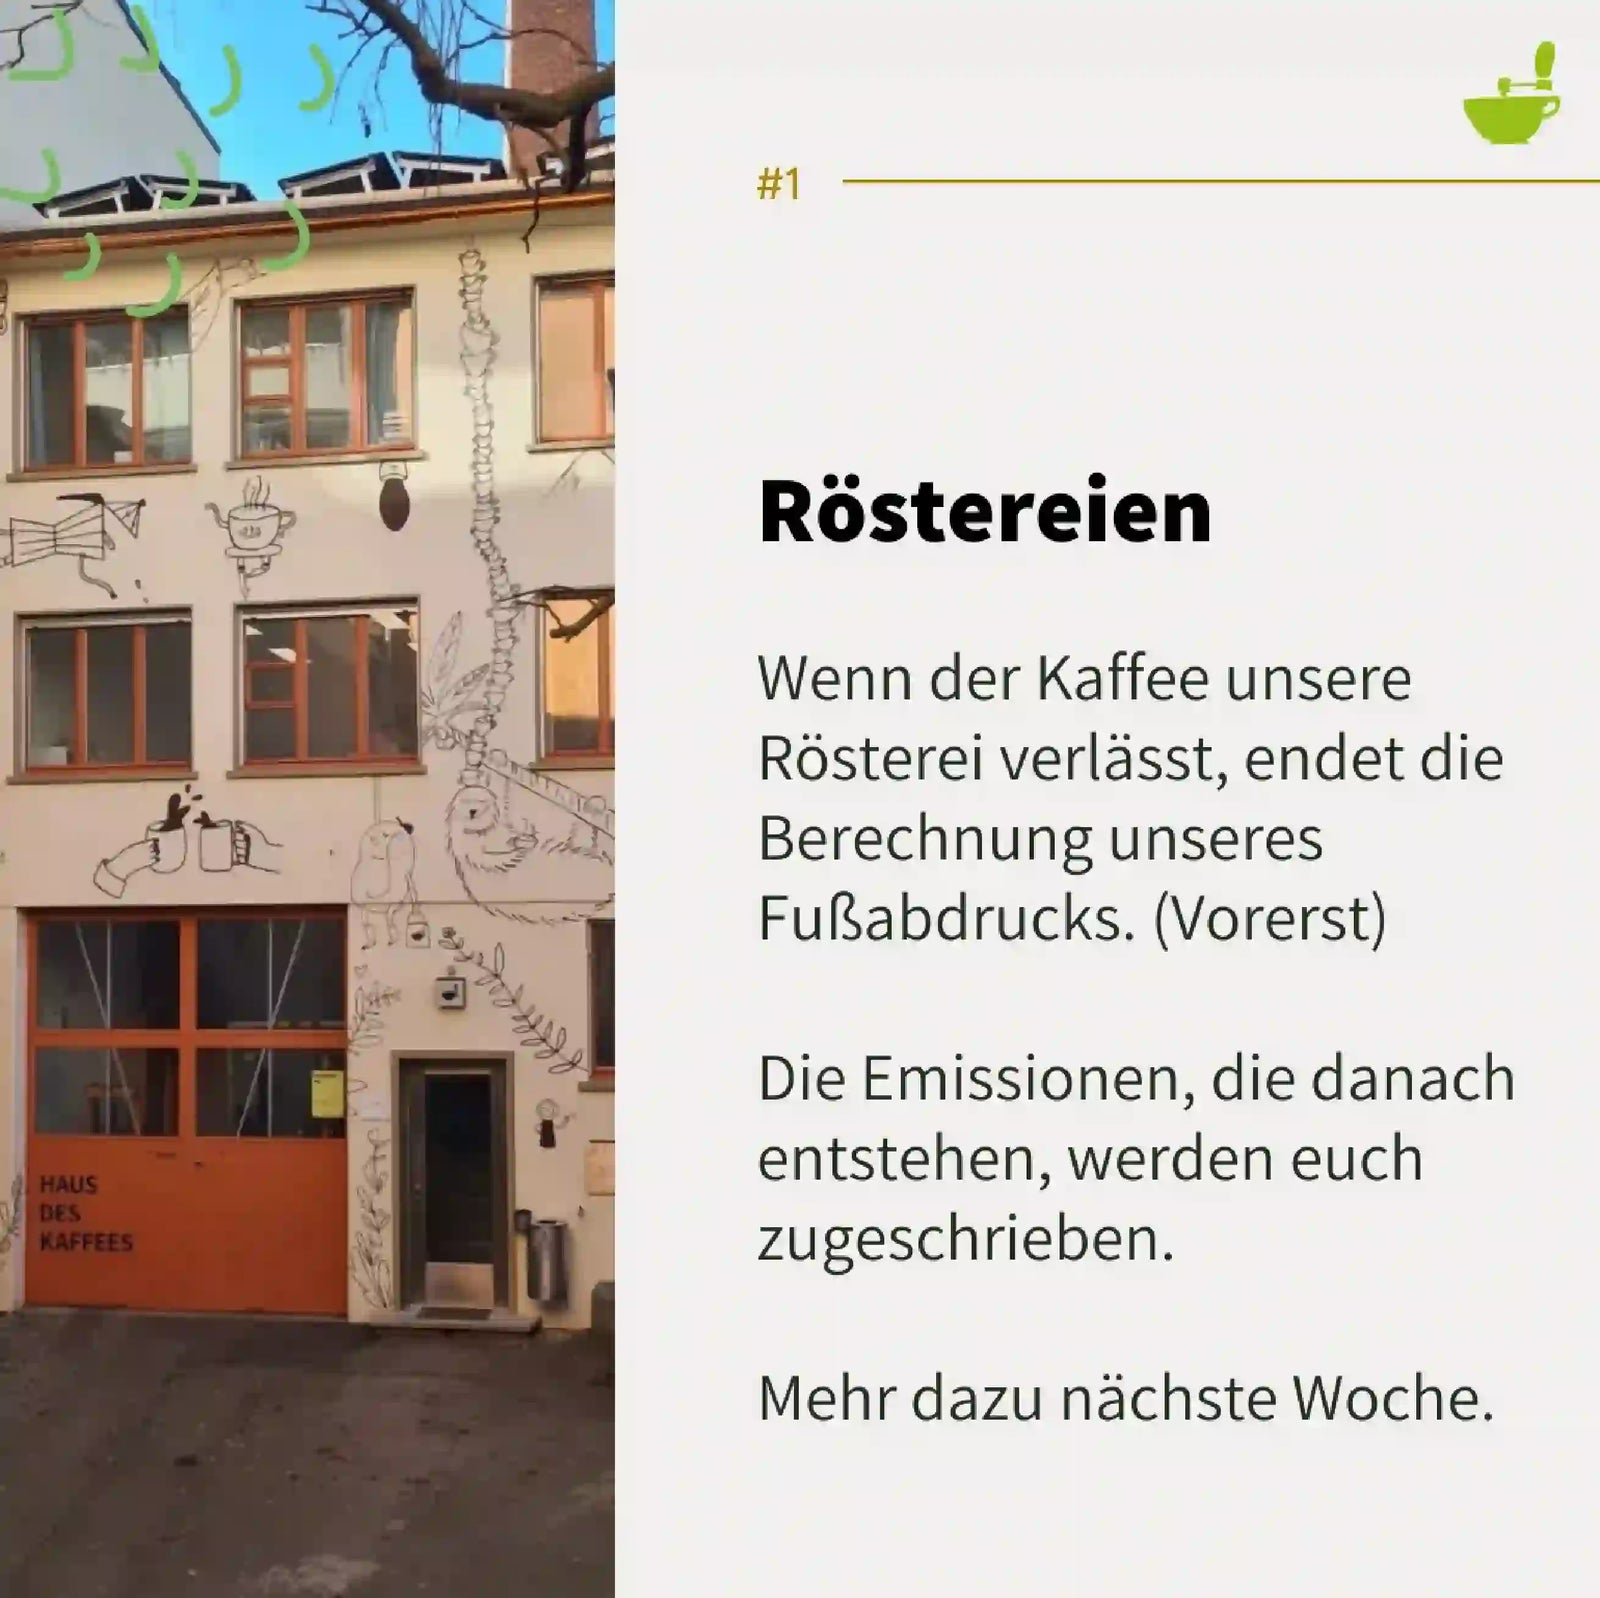
This is a cradle-to-gate analysis. This means we account for all emissions that occur until the coffee leaves our roastery.
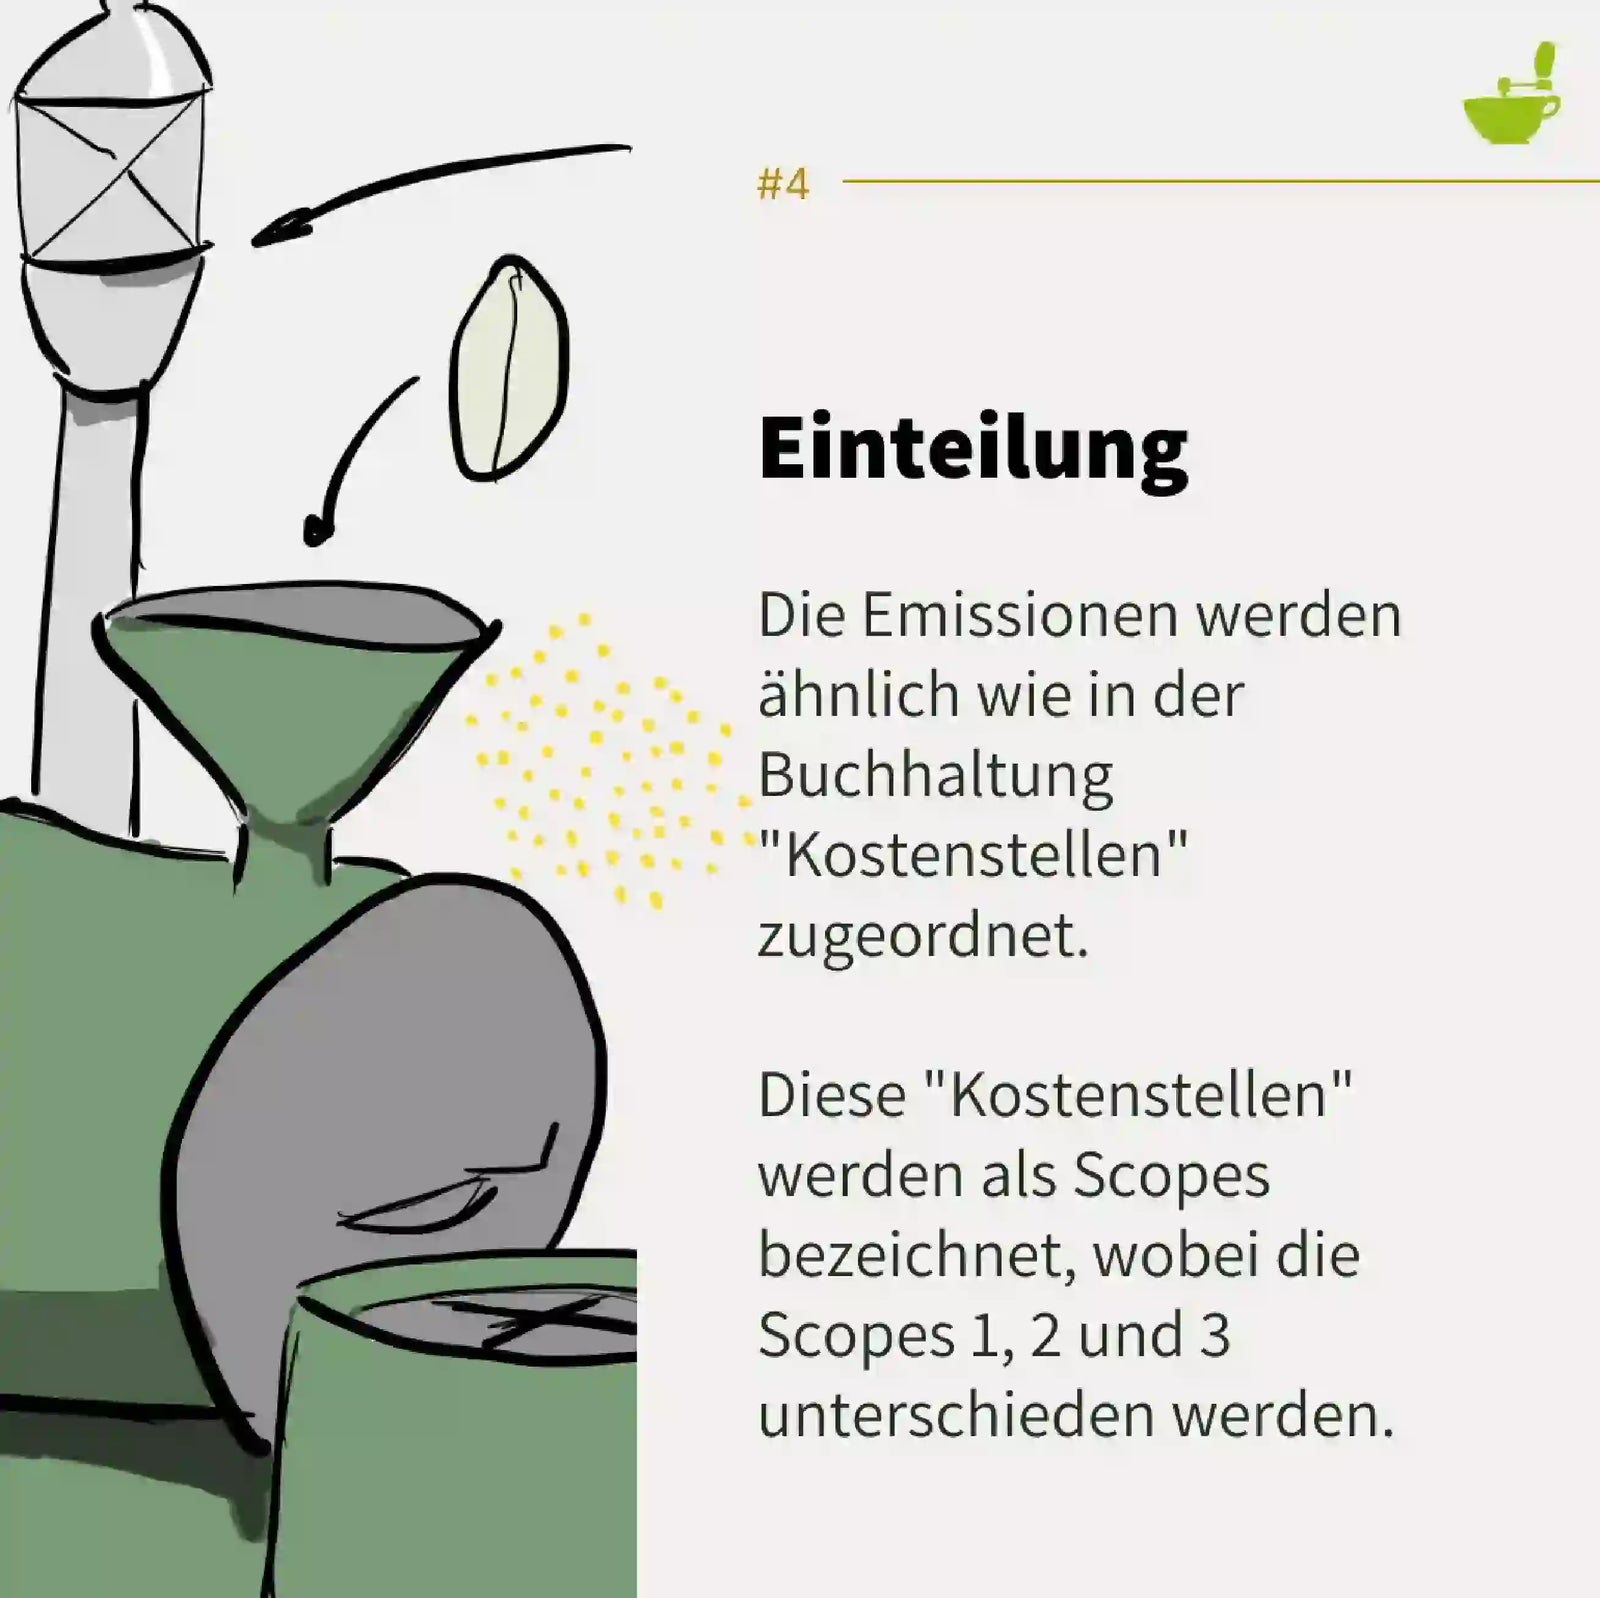
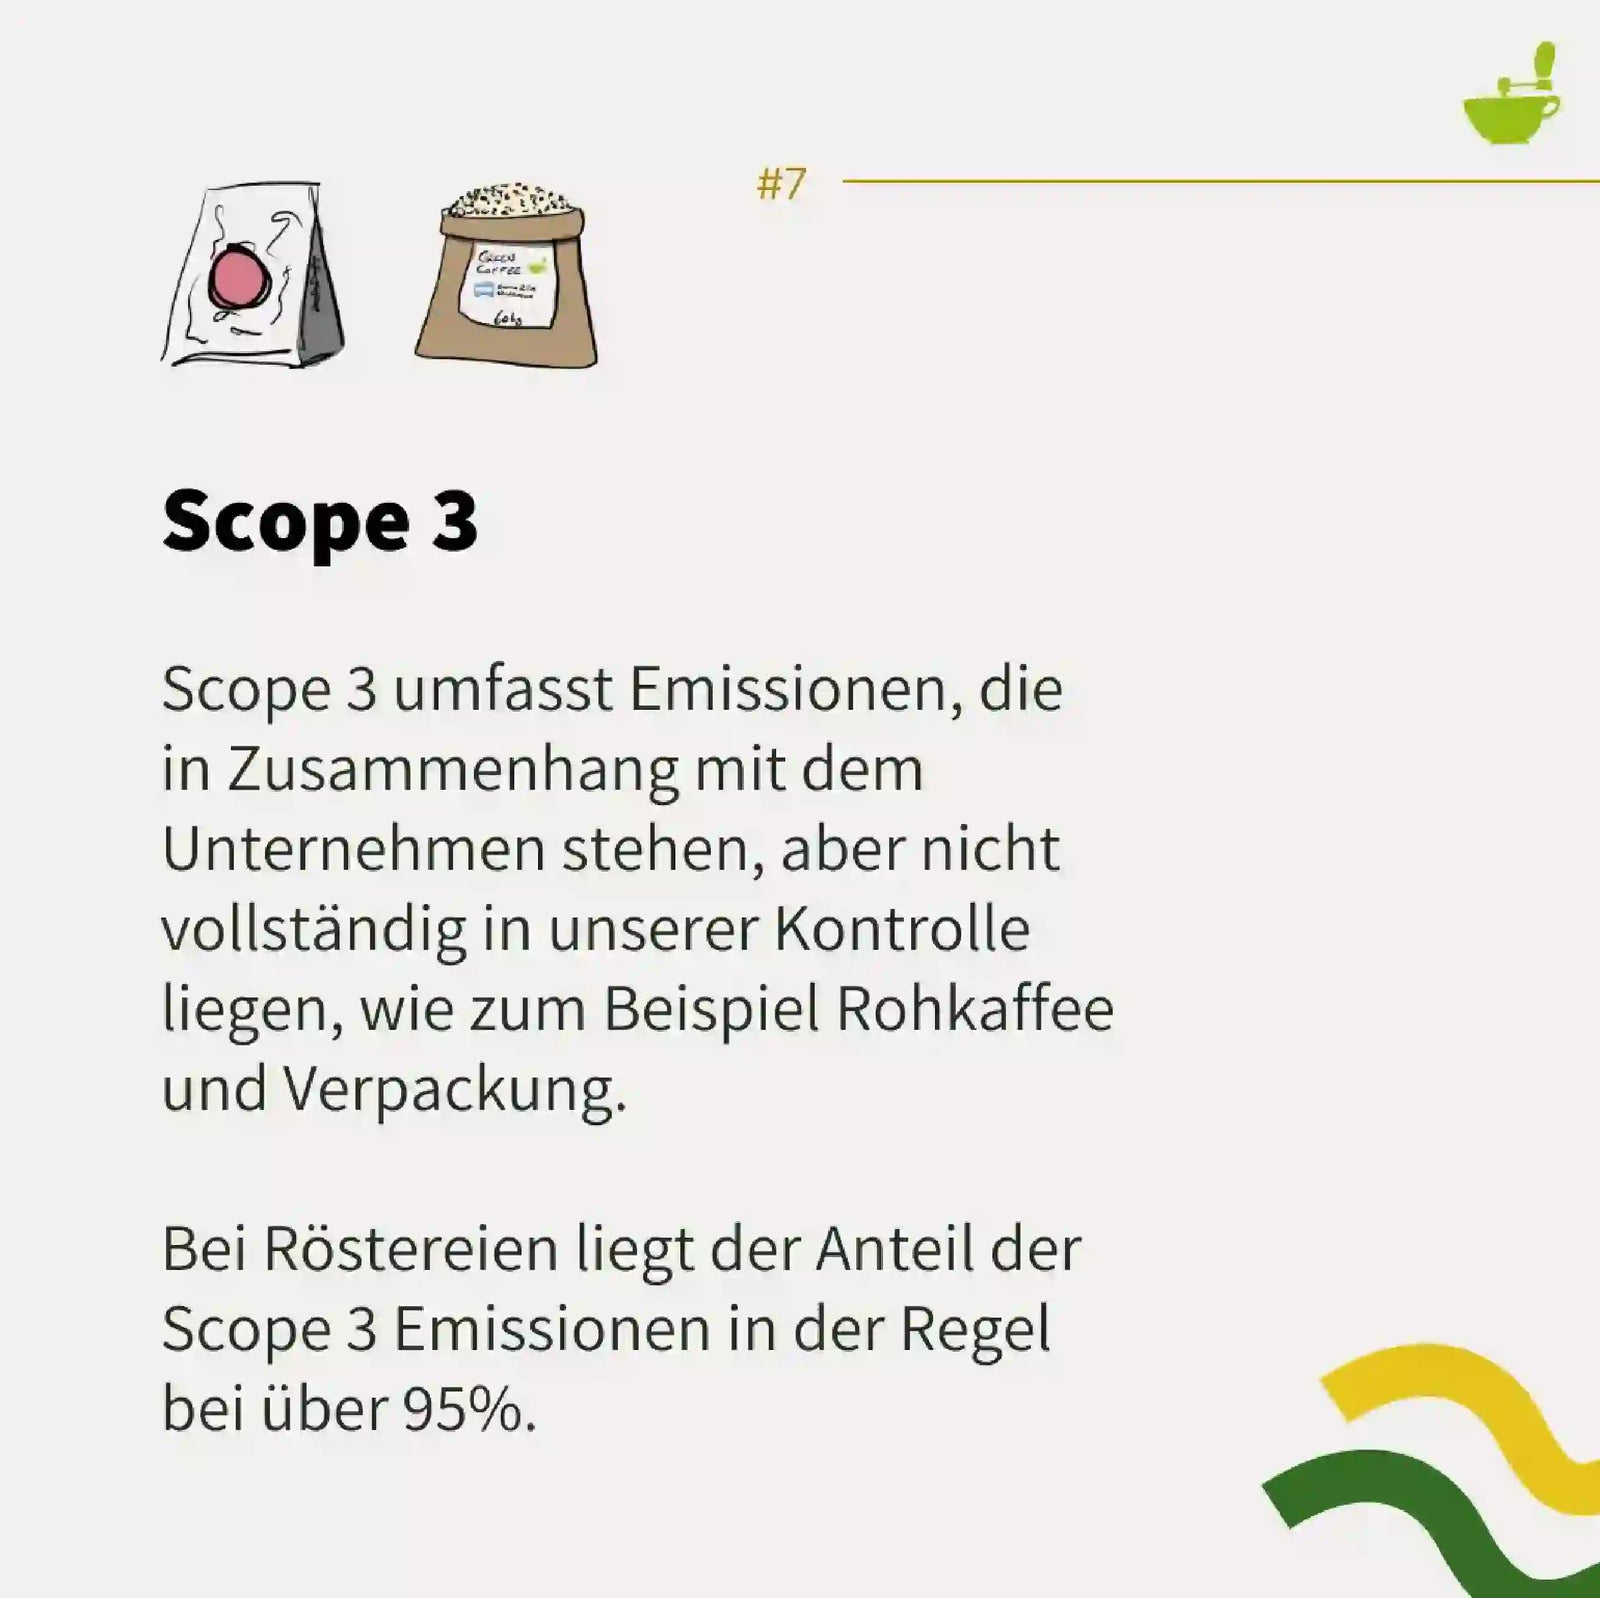
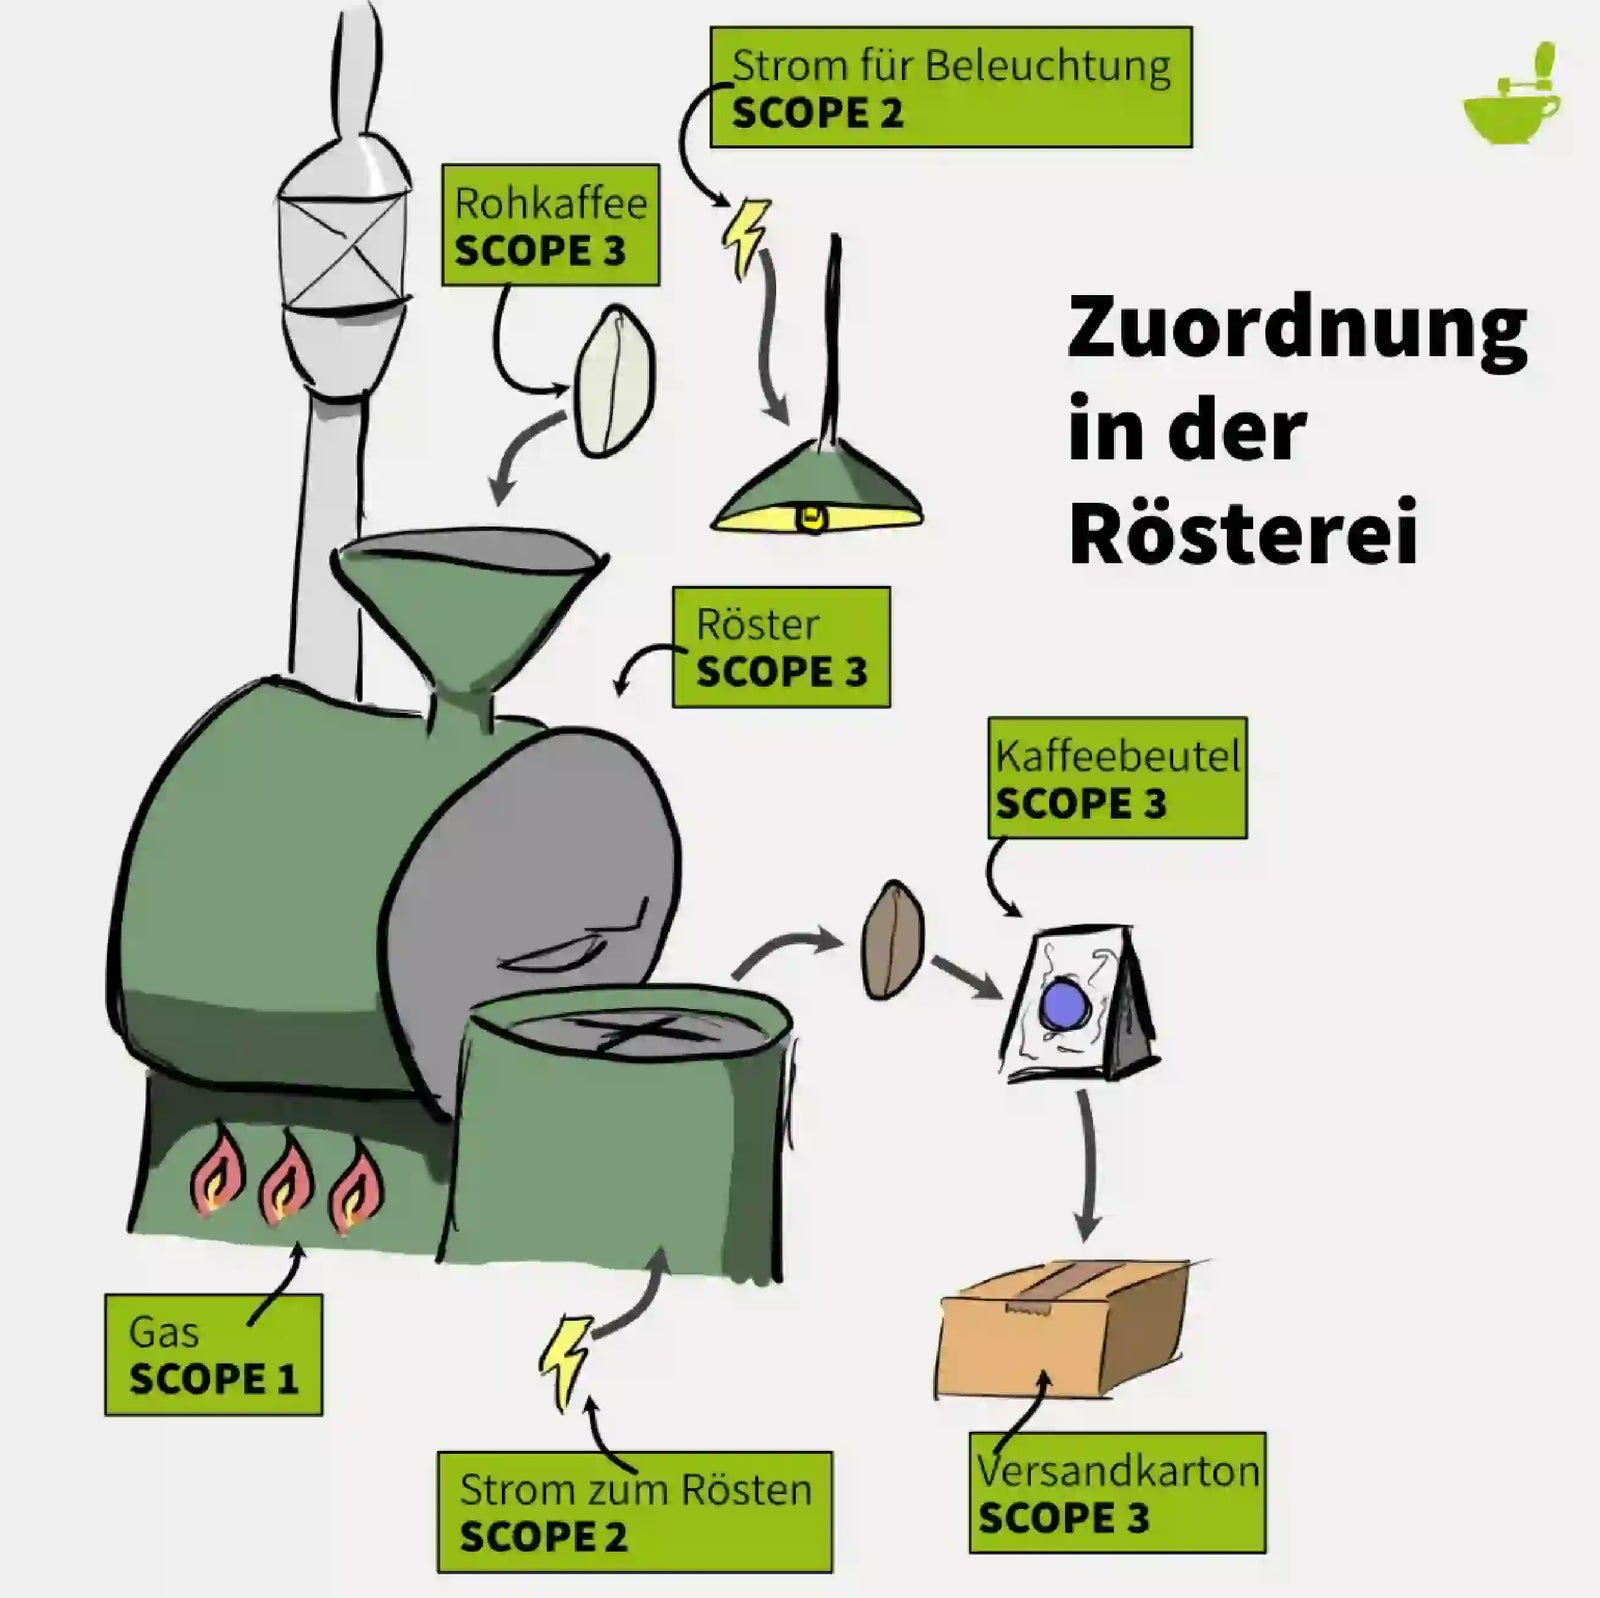
At roasteries, most emissions fall into Scope 3. Scope 3 also accounts for 95.8% at our facility. This calculation is based only on coffee from Santa Rita. Other coffees will certainly have a different CO₂ footprint. Our coffee selection has the greatest impact on our emissions. However, other factors play a role in selection. You can find more about this here.
Environmental impacts in coffee cultivation
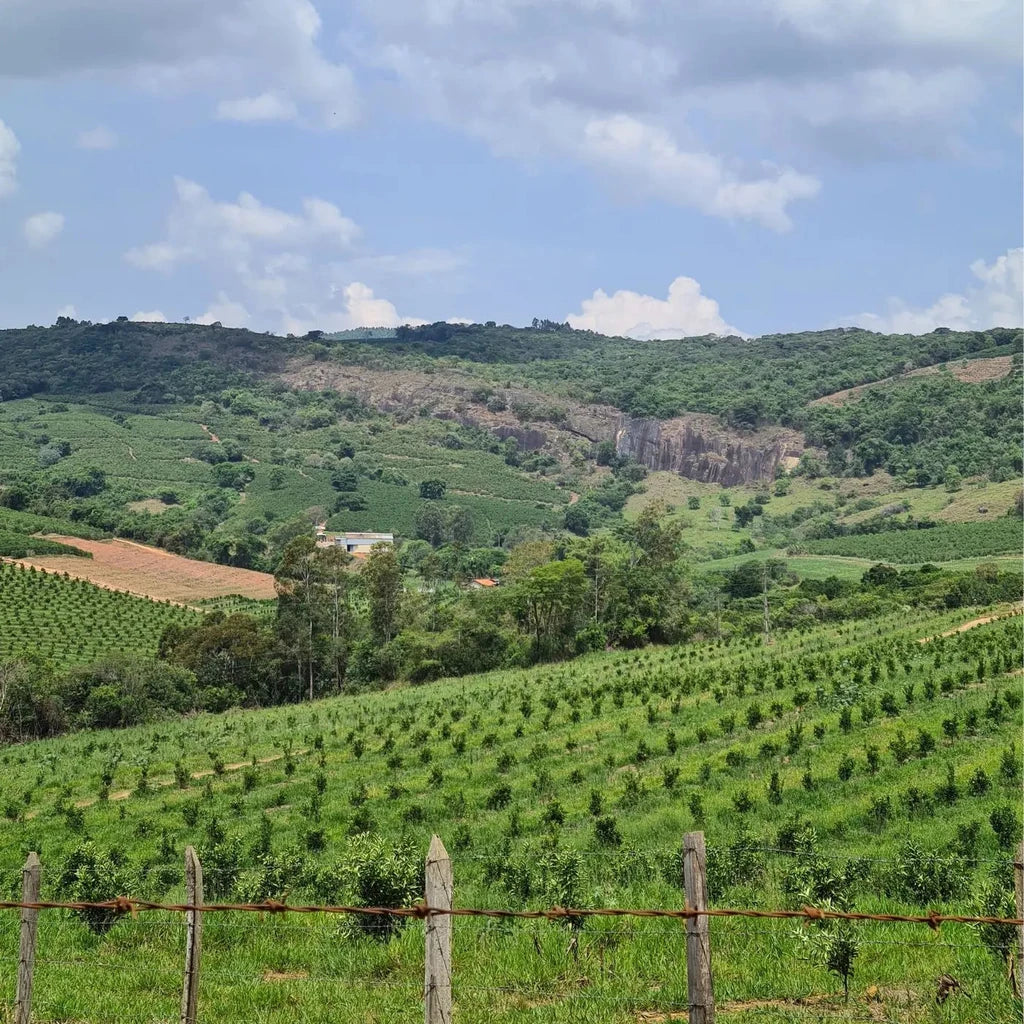
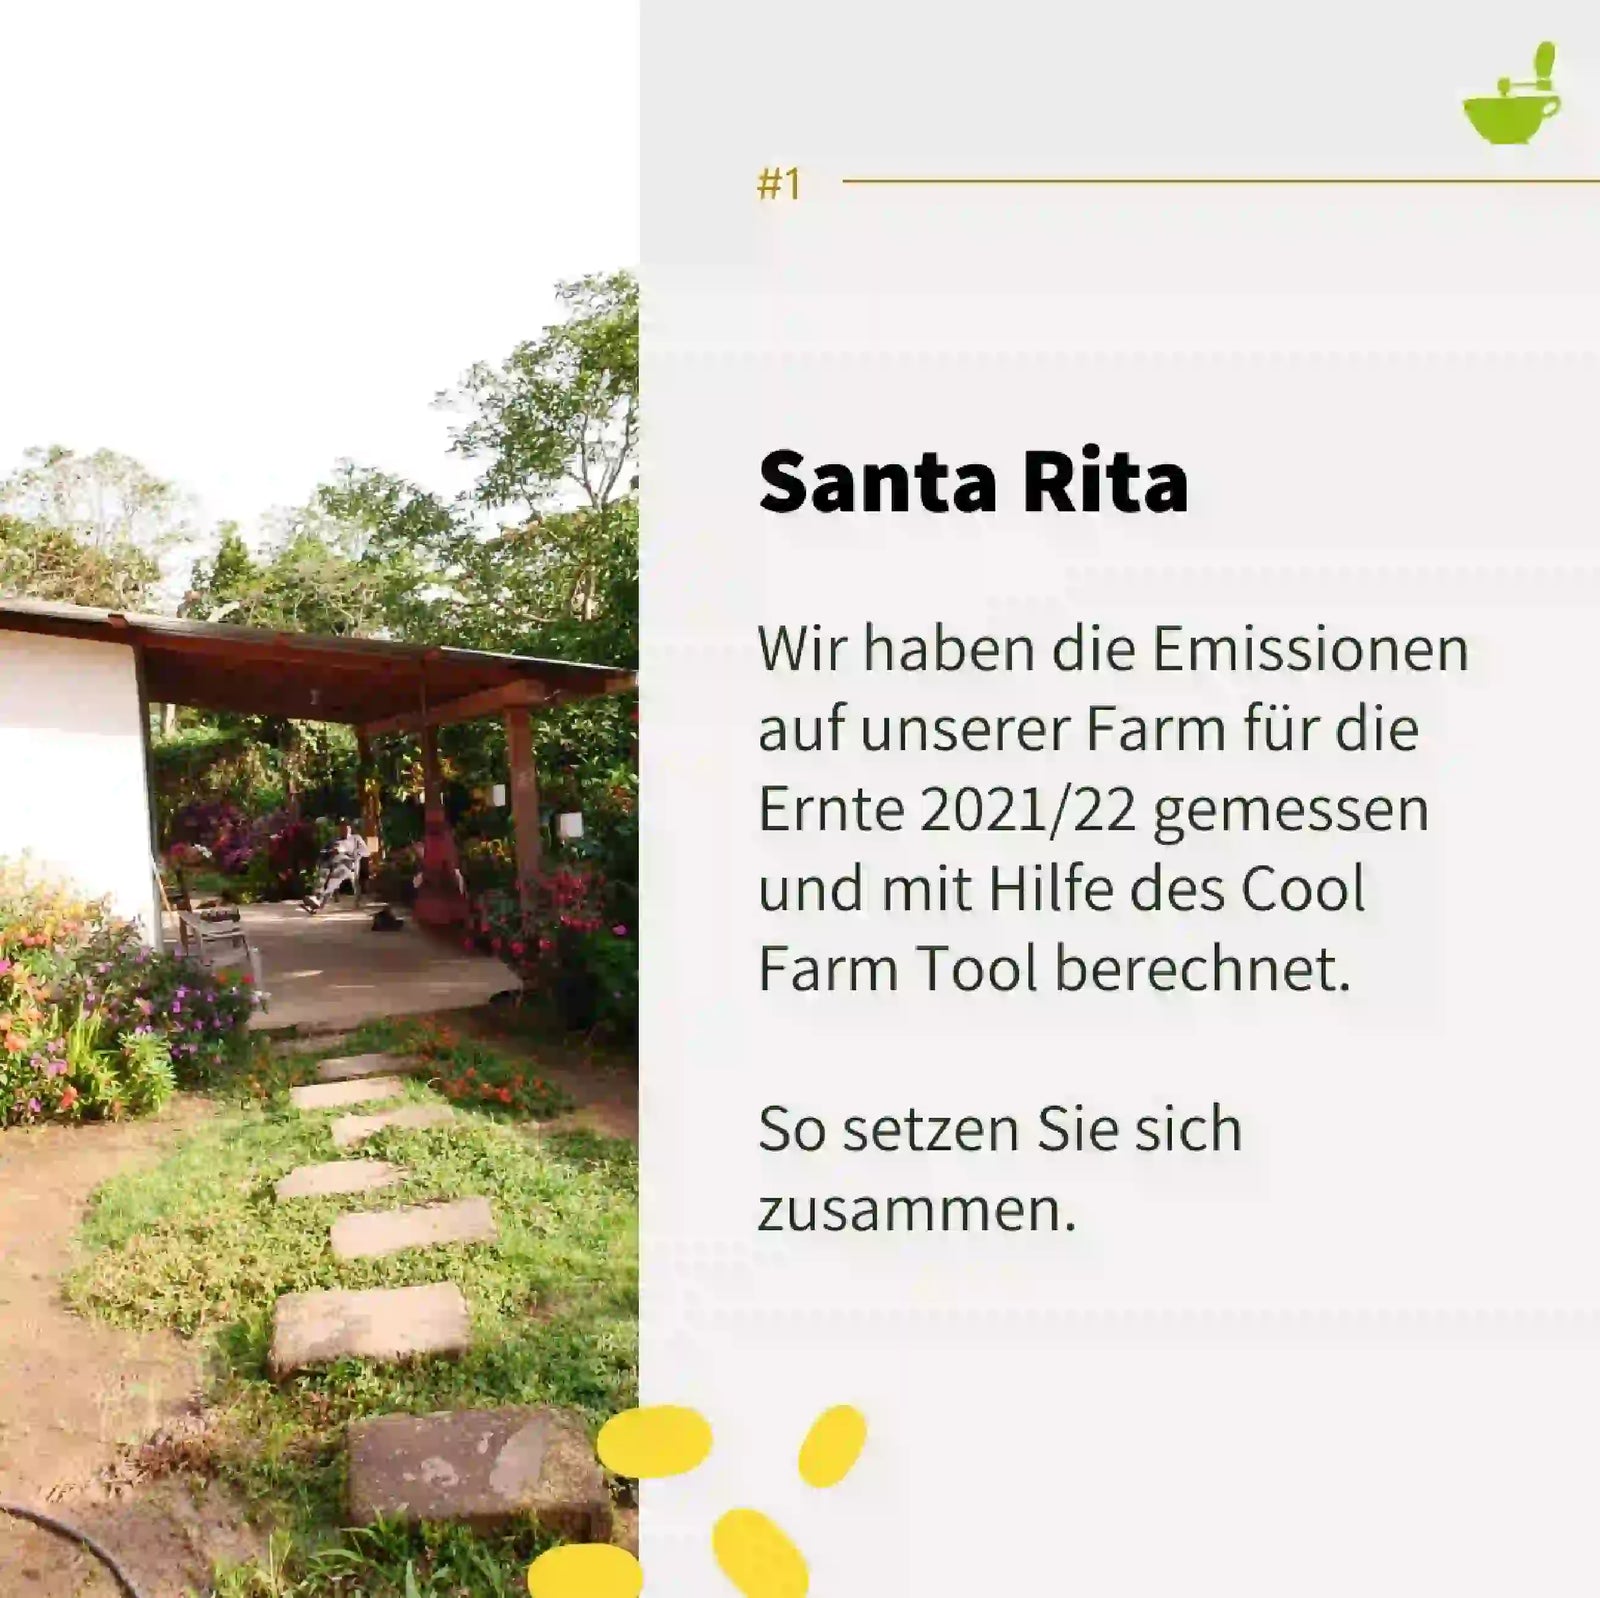
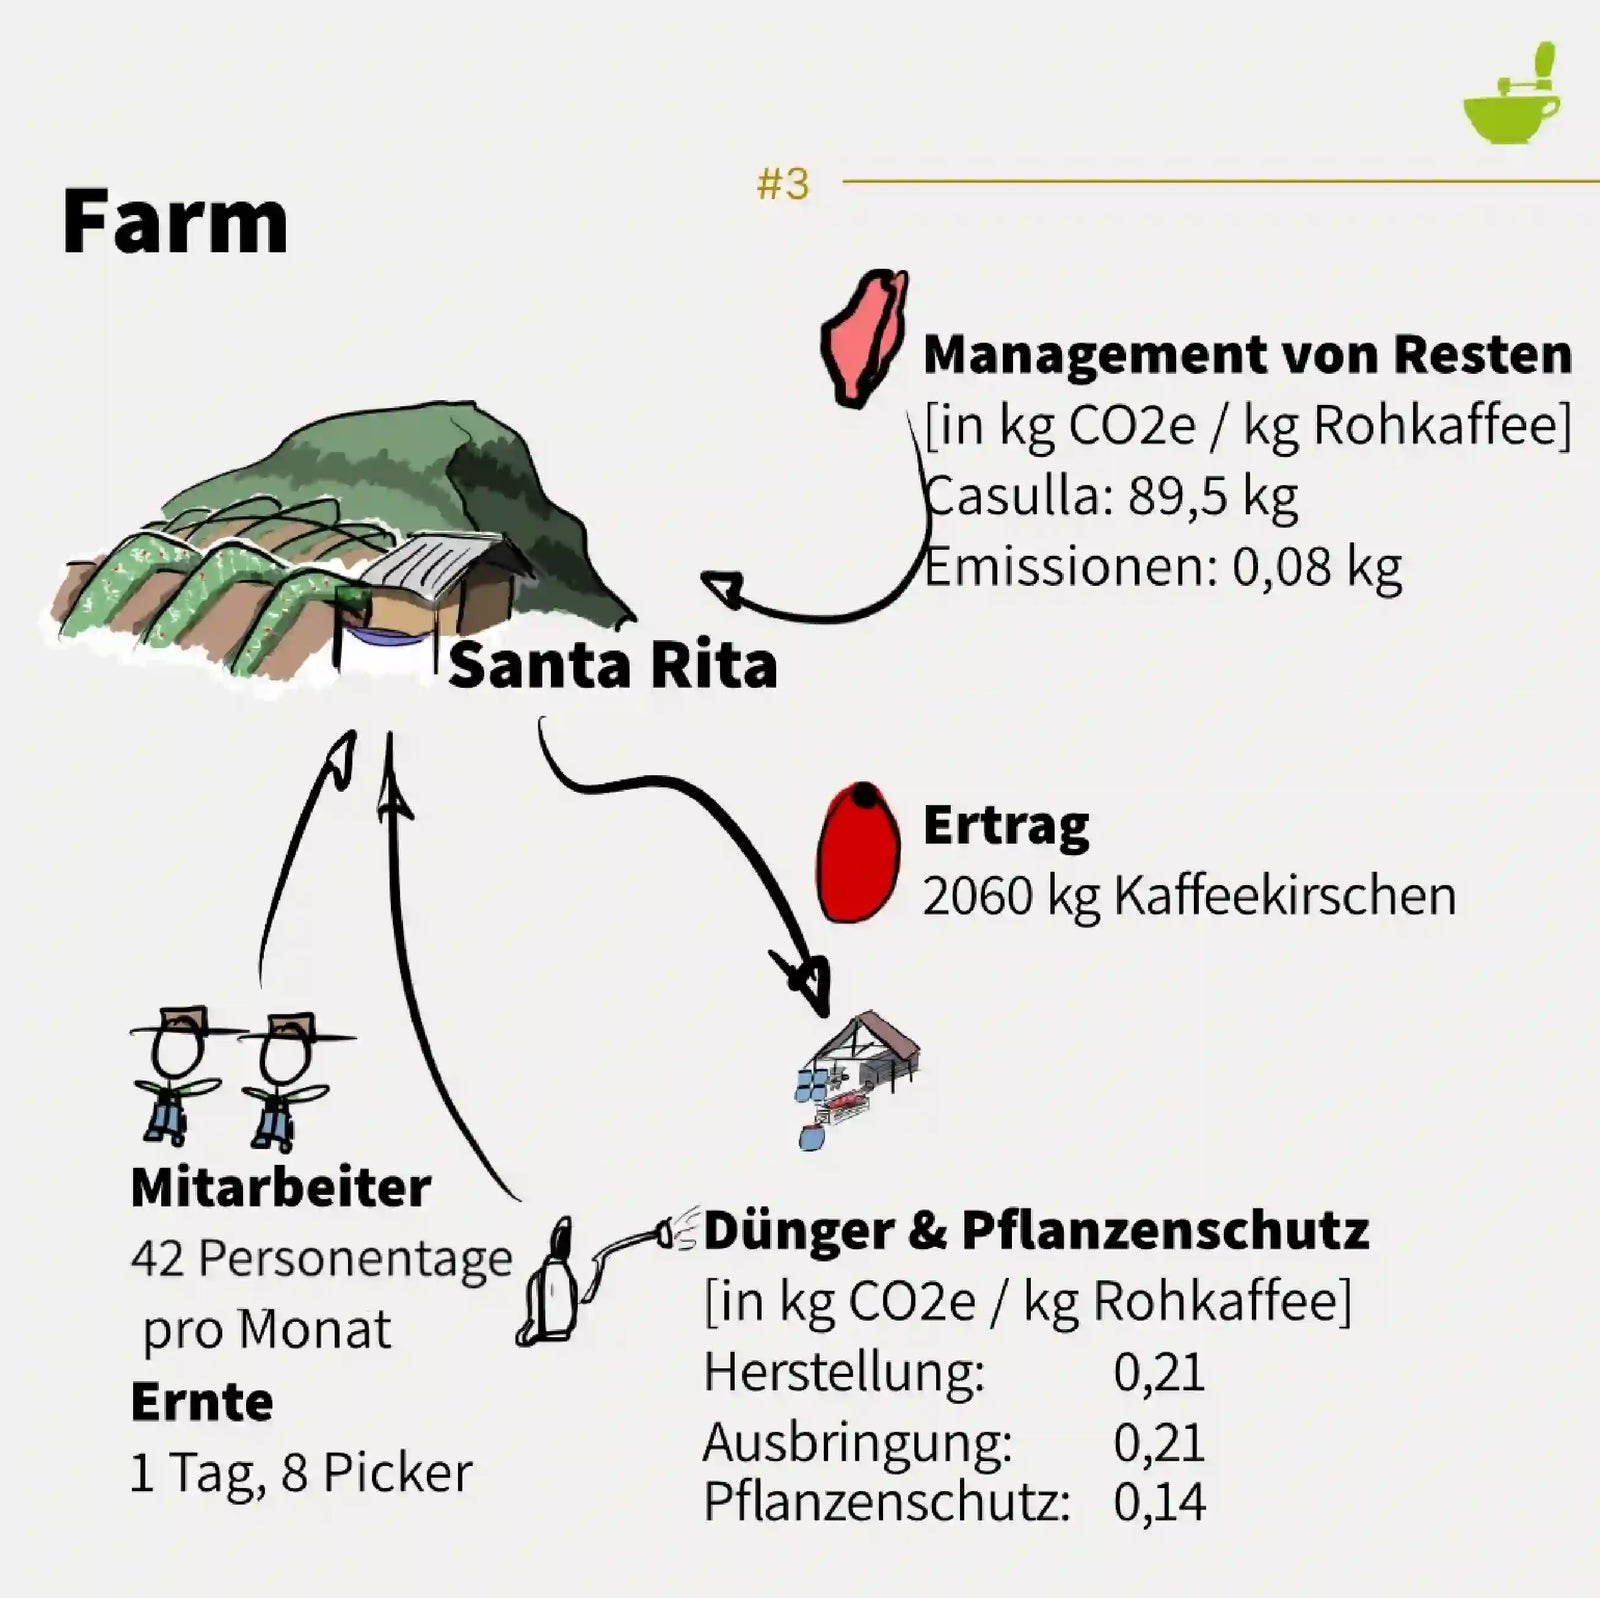
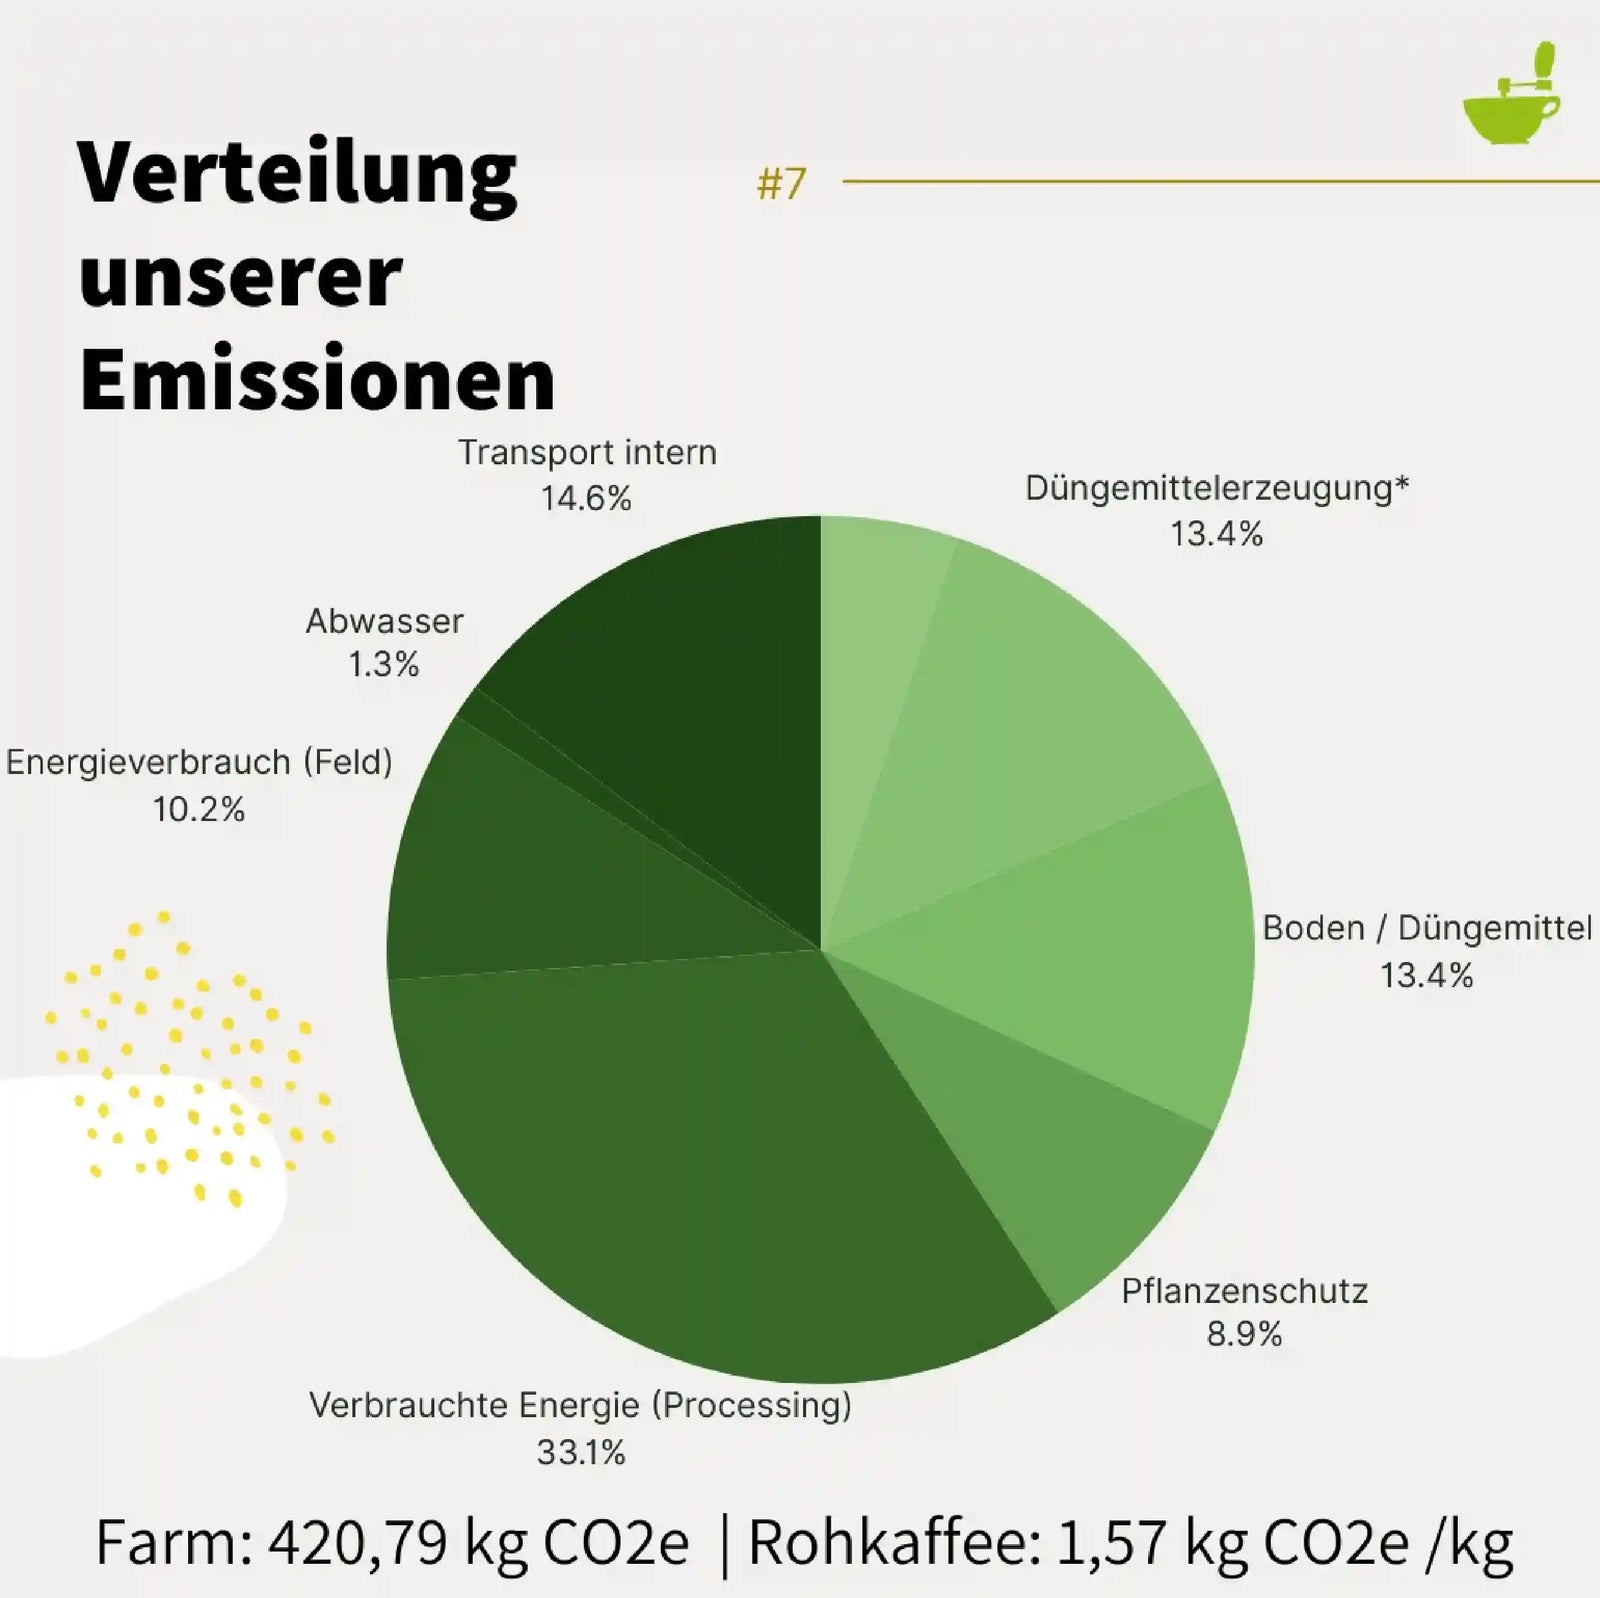
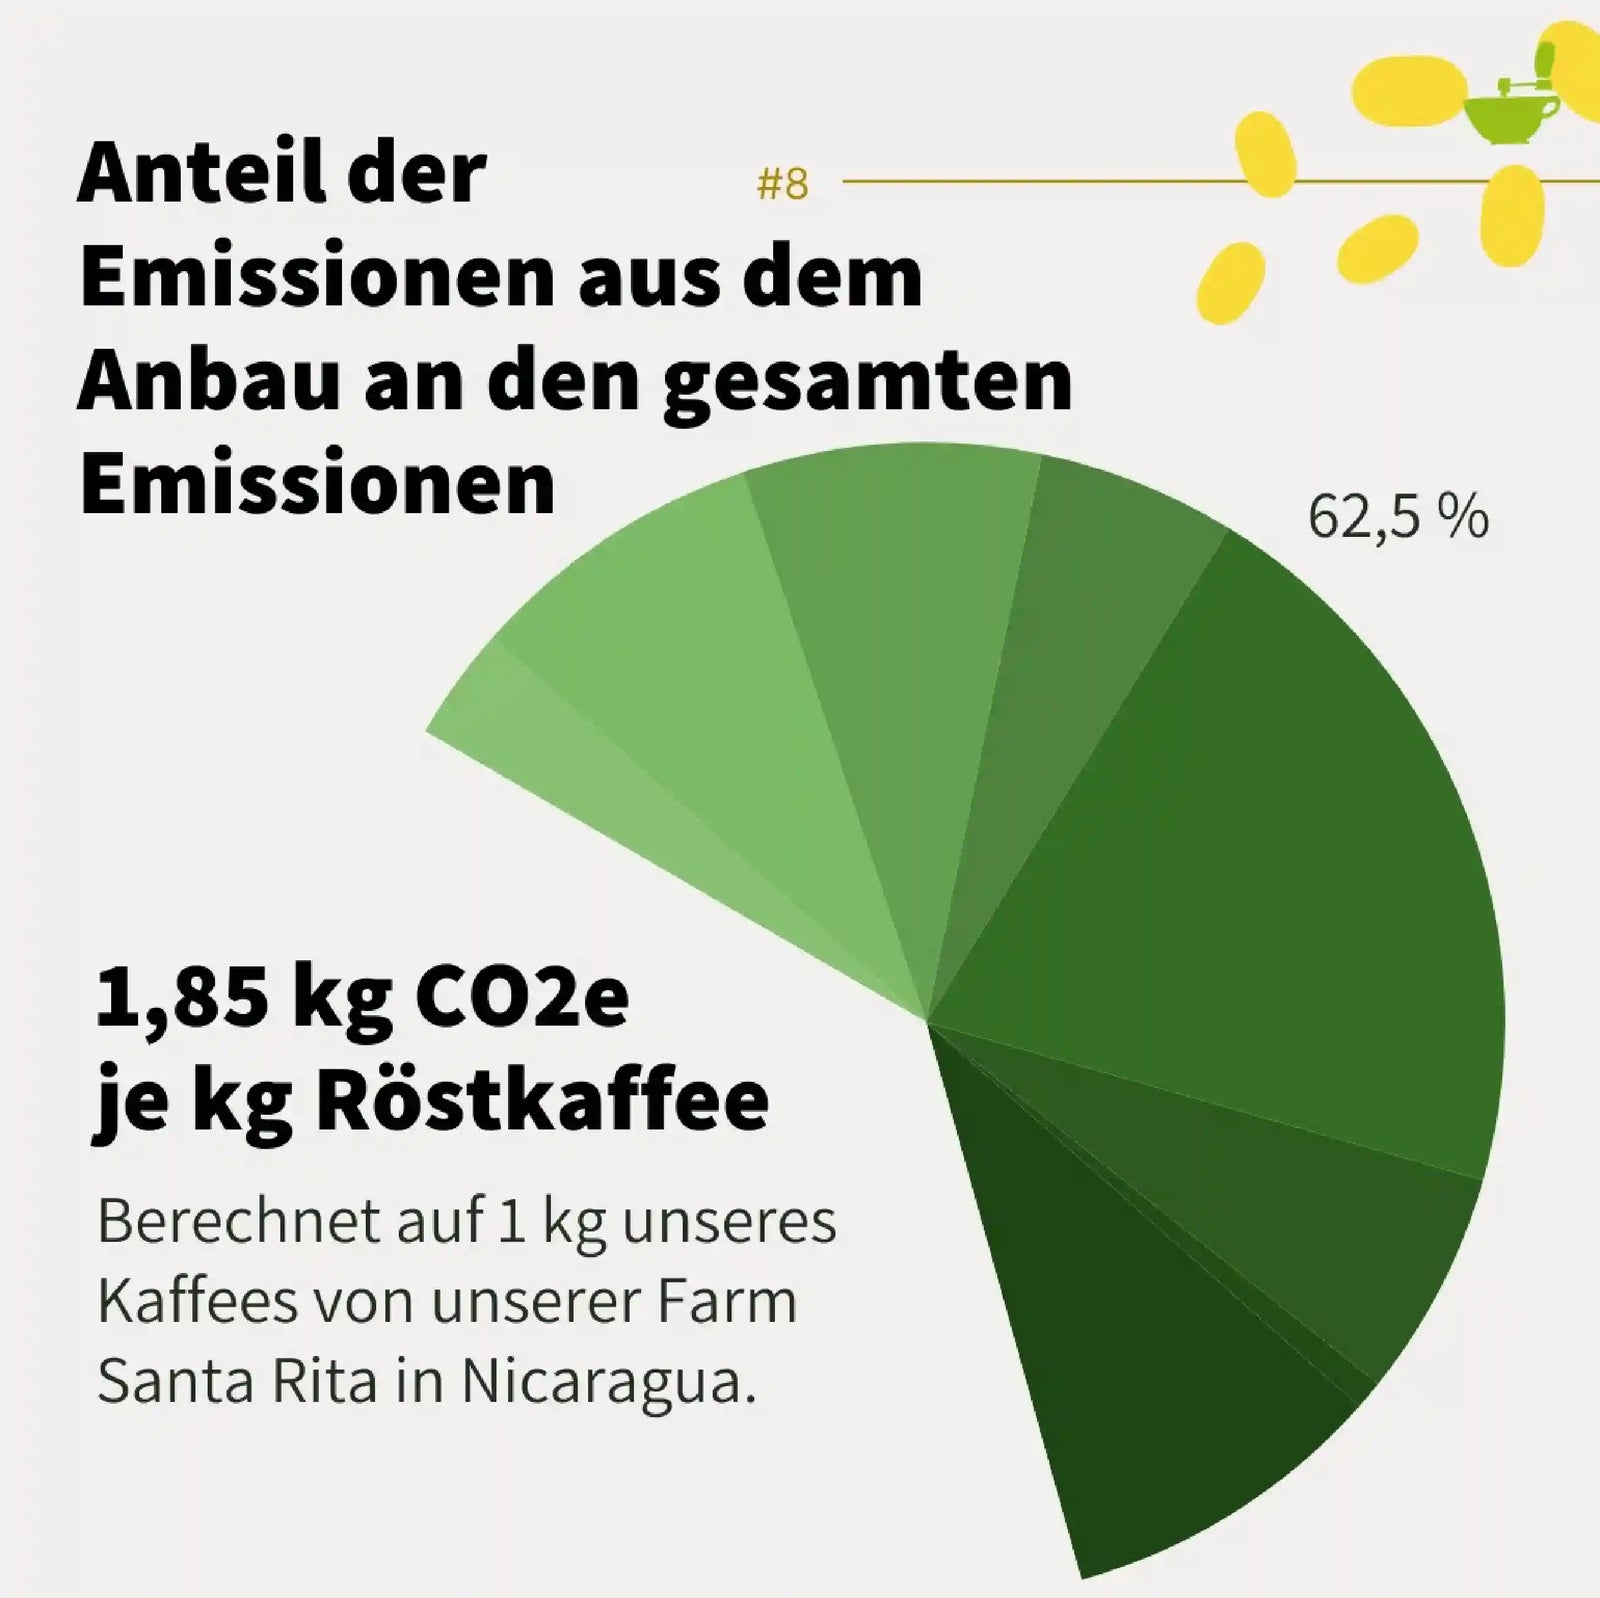
We calculated the CO₂ emissions at Santa Rita using the Cool Farm Tool. With 1.57 kg CO₂ equivalent per kg green coffee, the farm performs well. A comparison value from Carbon Cloud is 3.96 kg CO₂ equivalent per kg green coffee. Our calculation deliberately does not account for the farm's carbon sink. Since we cannot guarantee that the forest will remain there for the next 50-100 years, even if it does exist.
The share of transport in coffee emissions
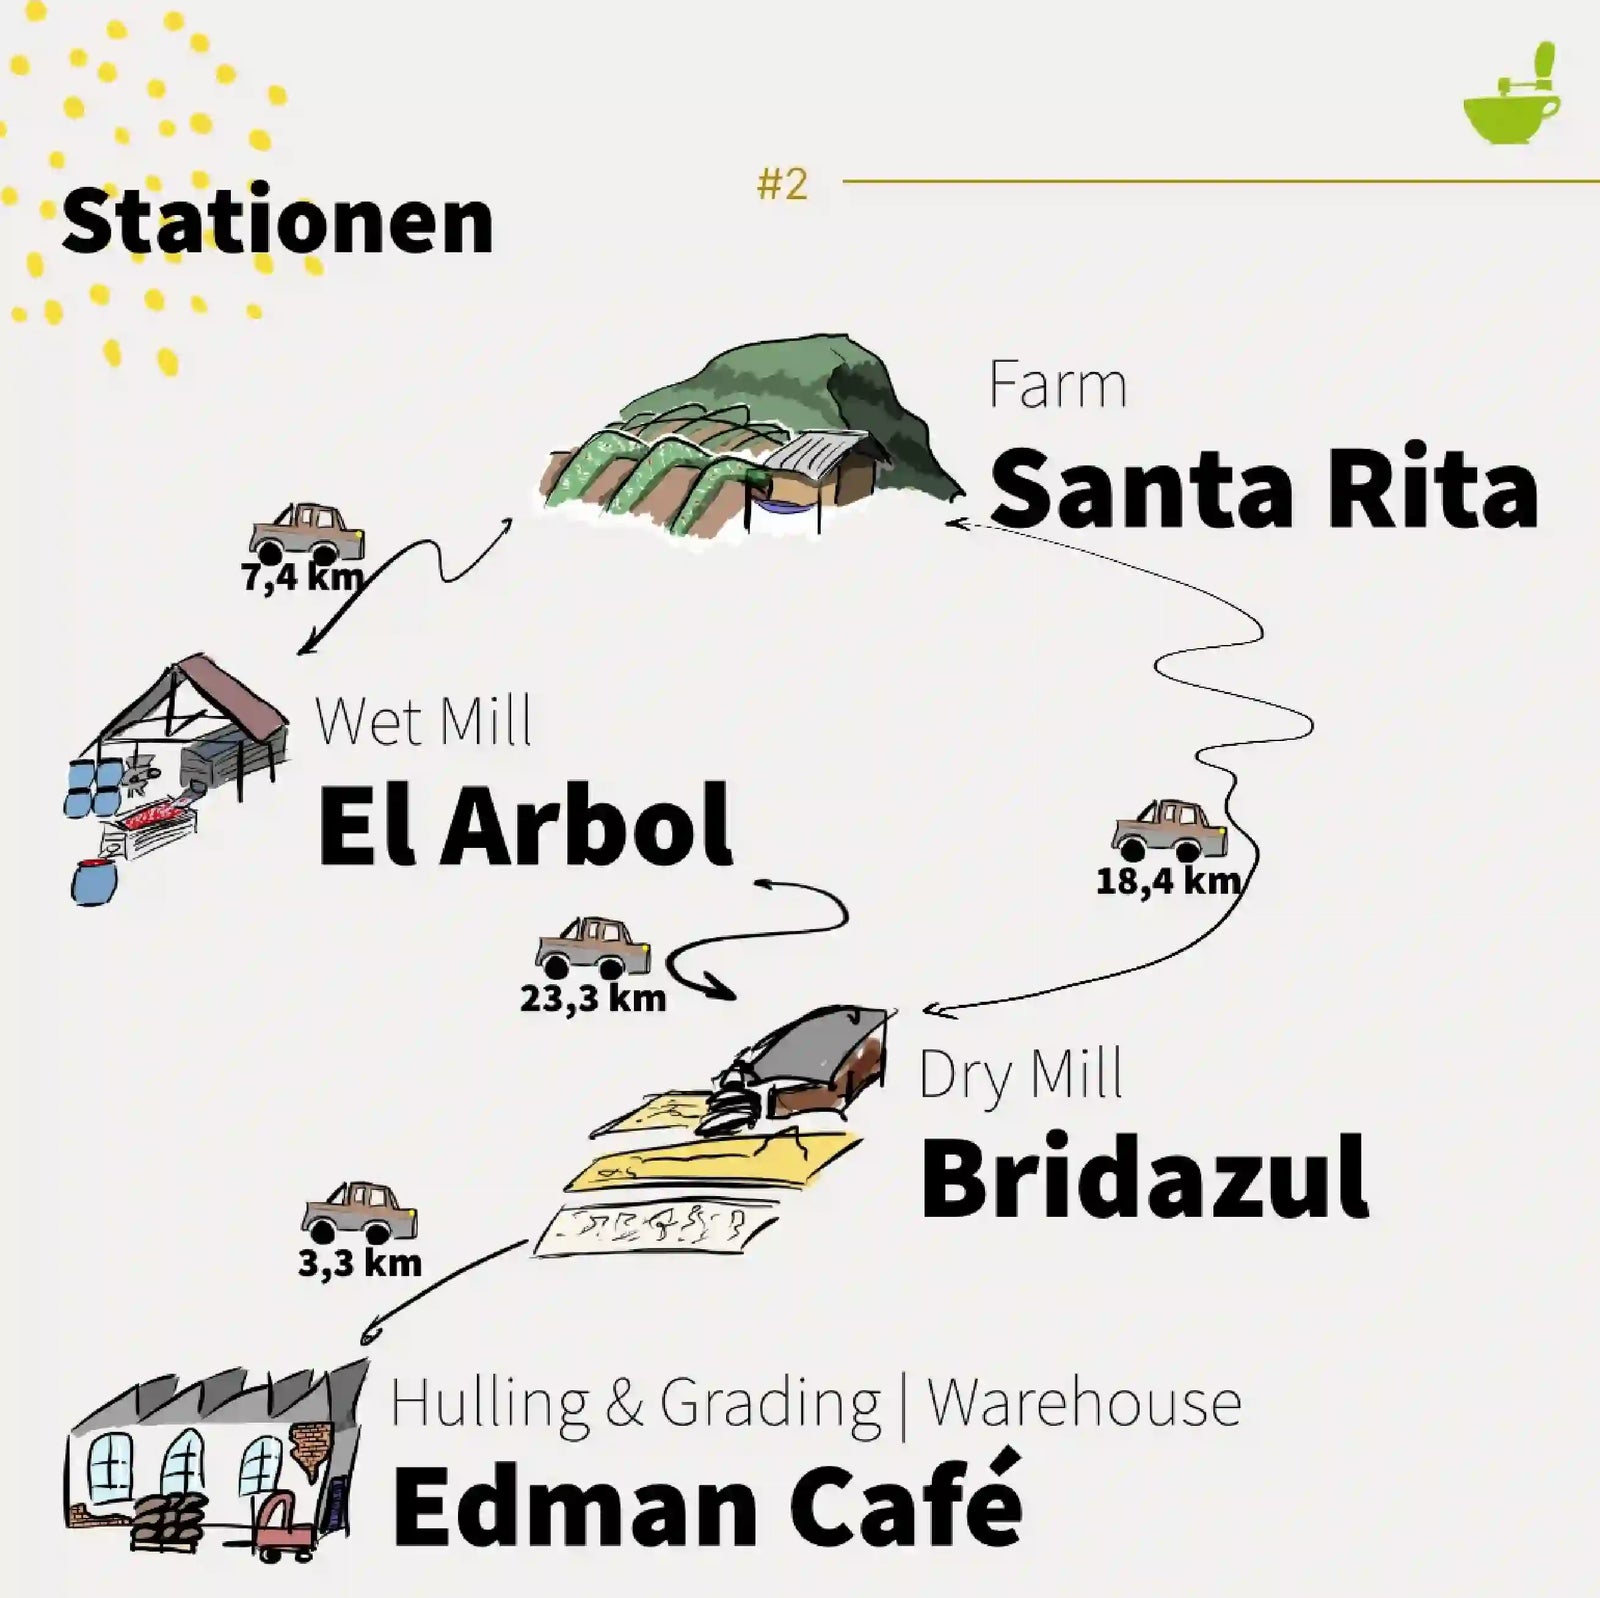
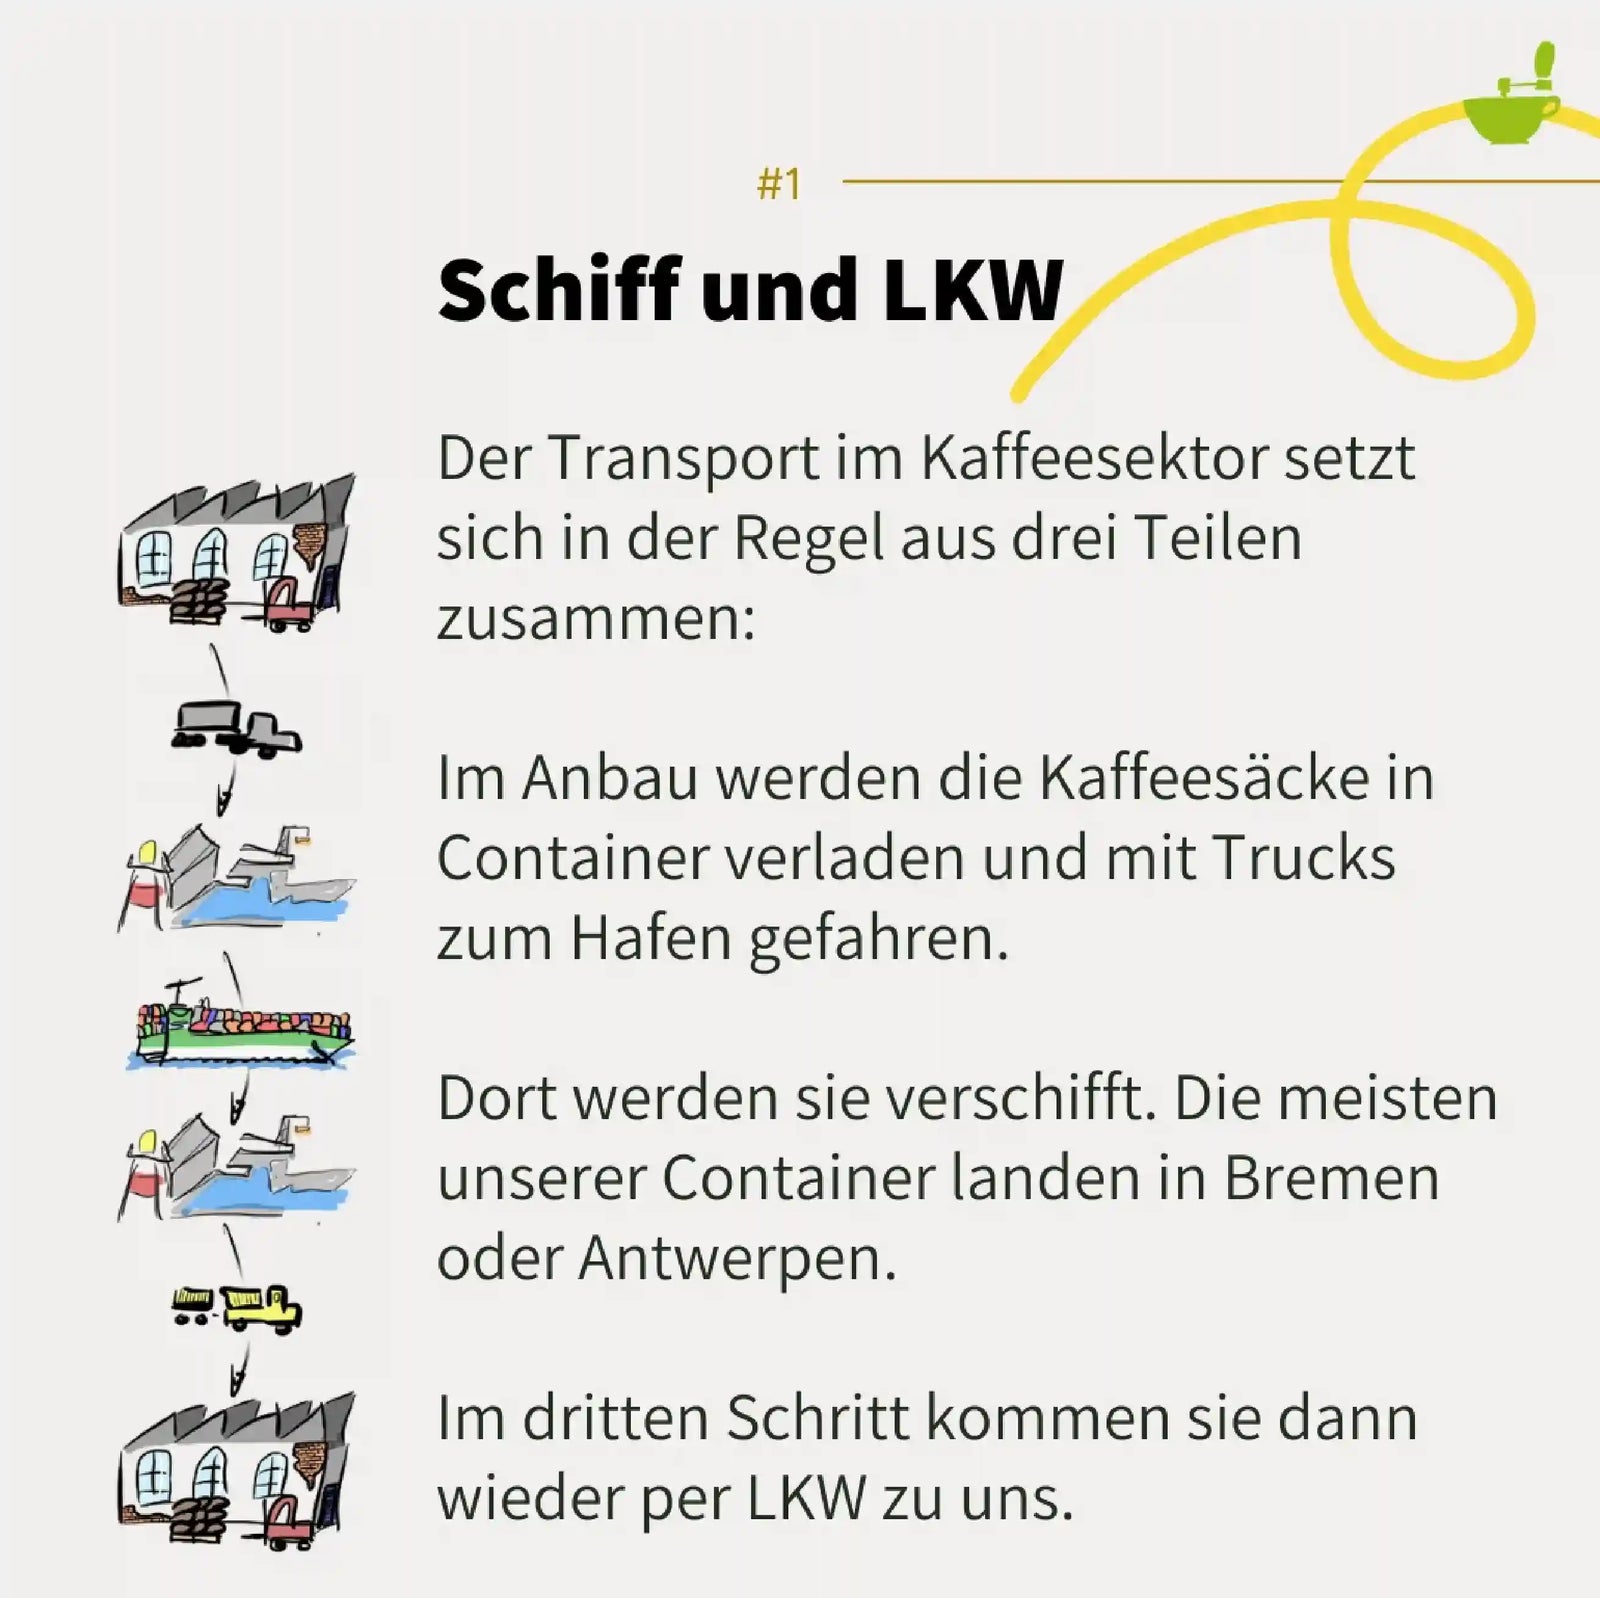
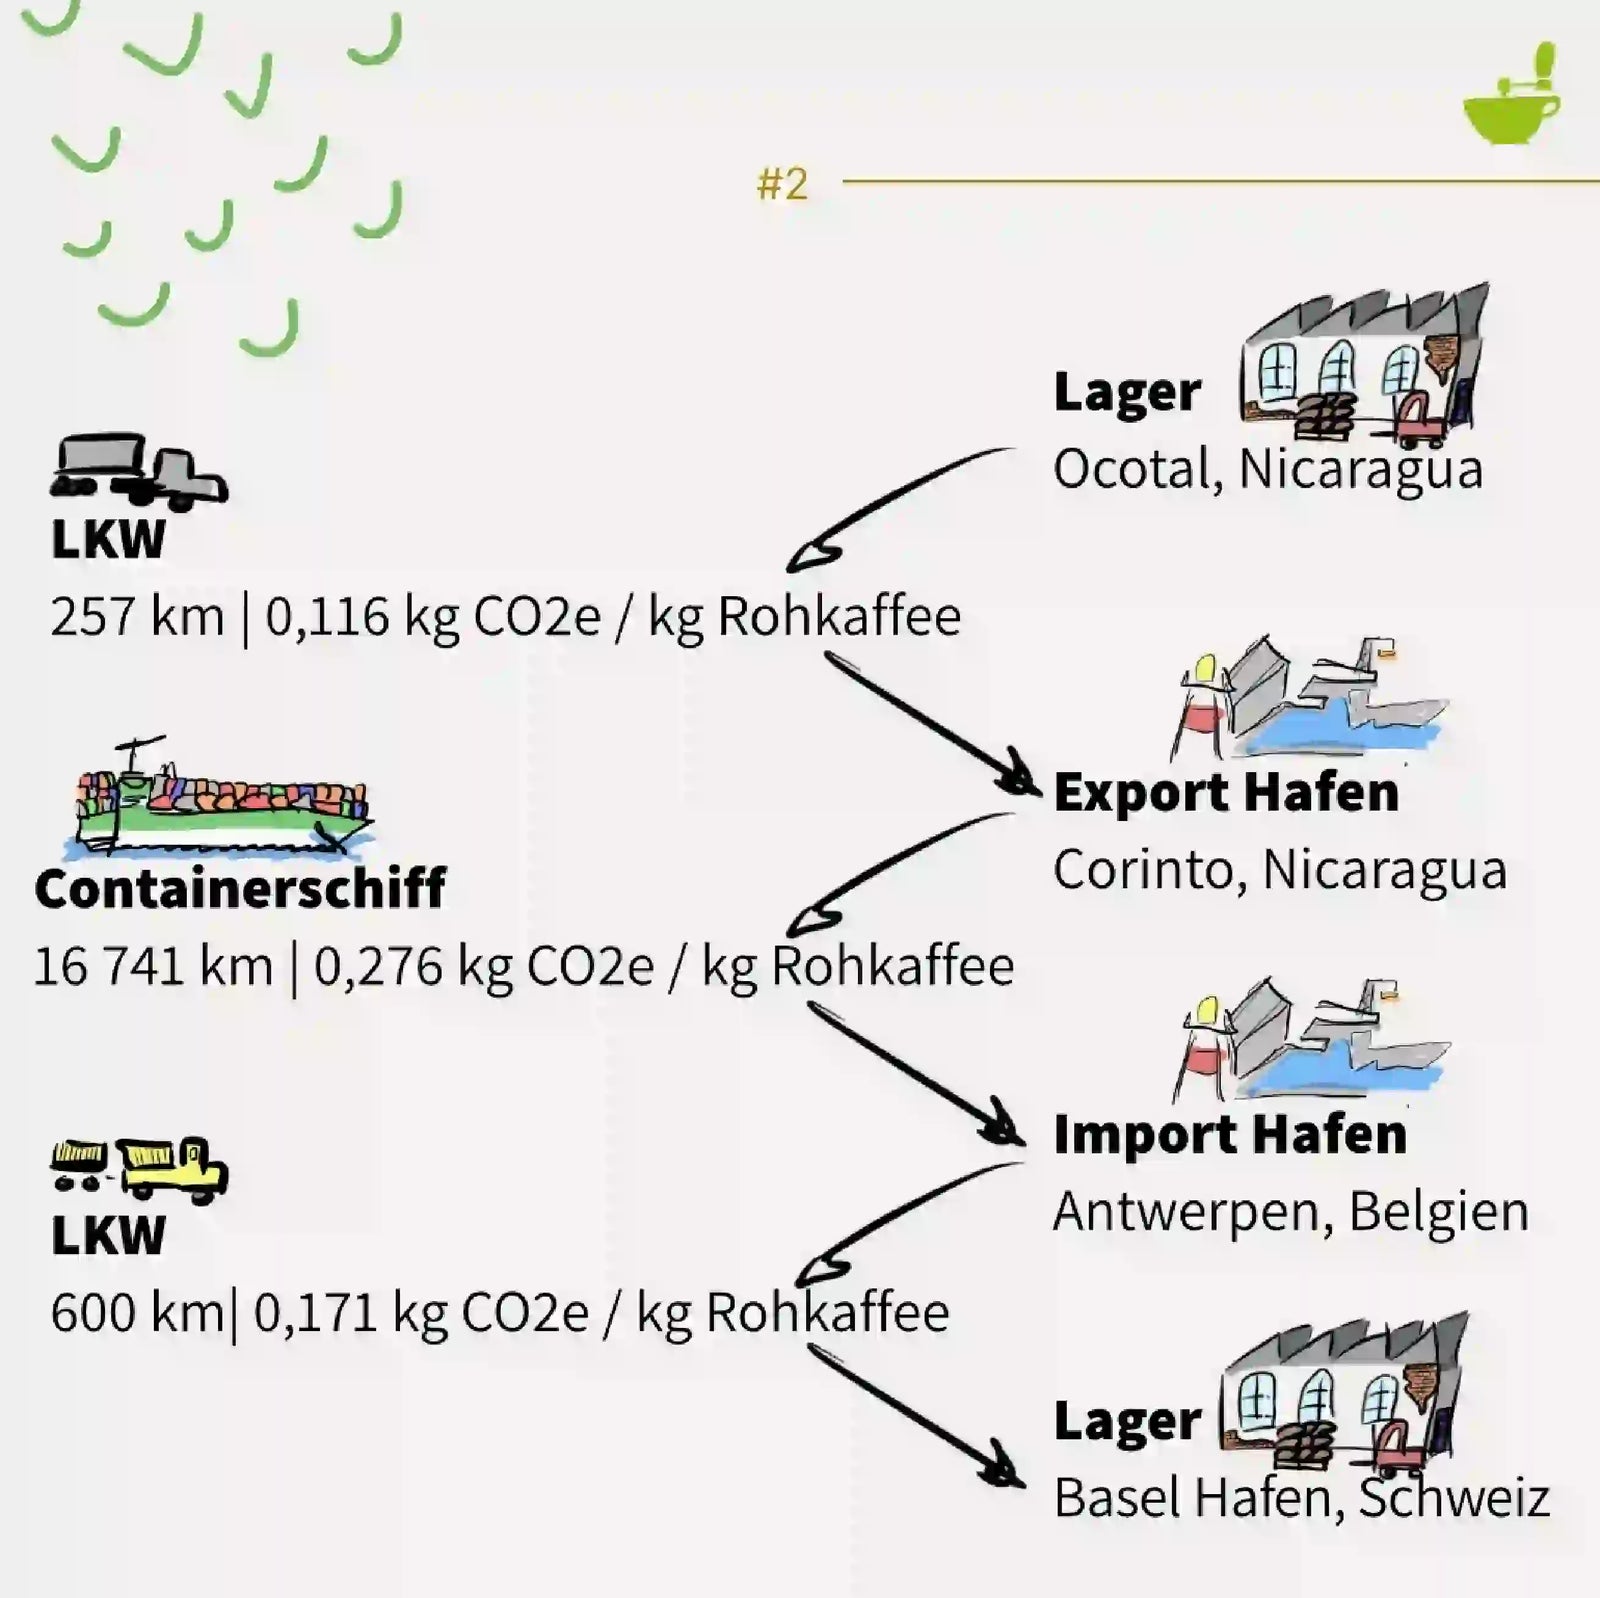
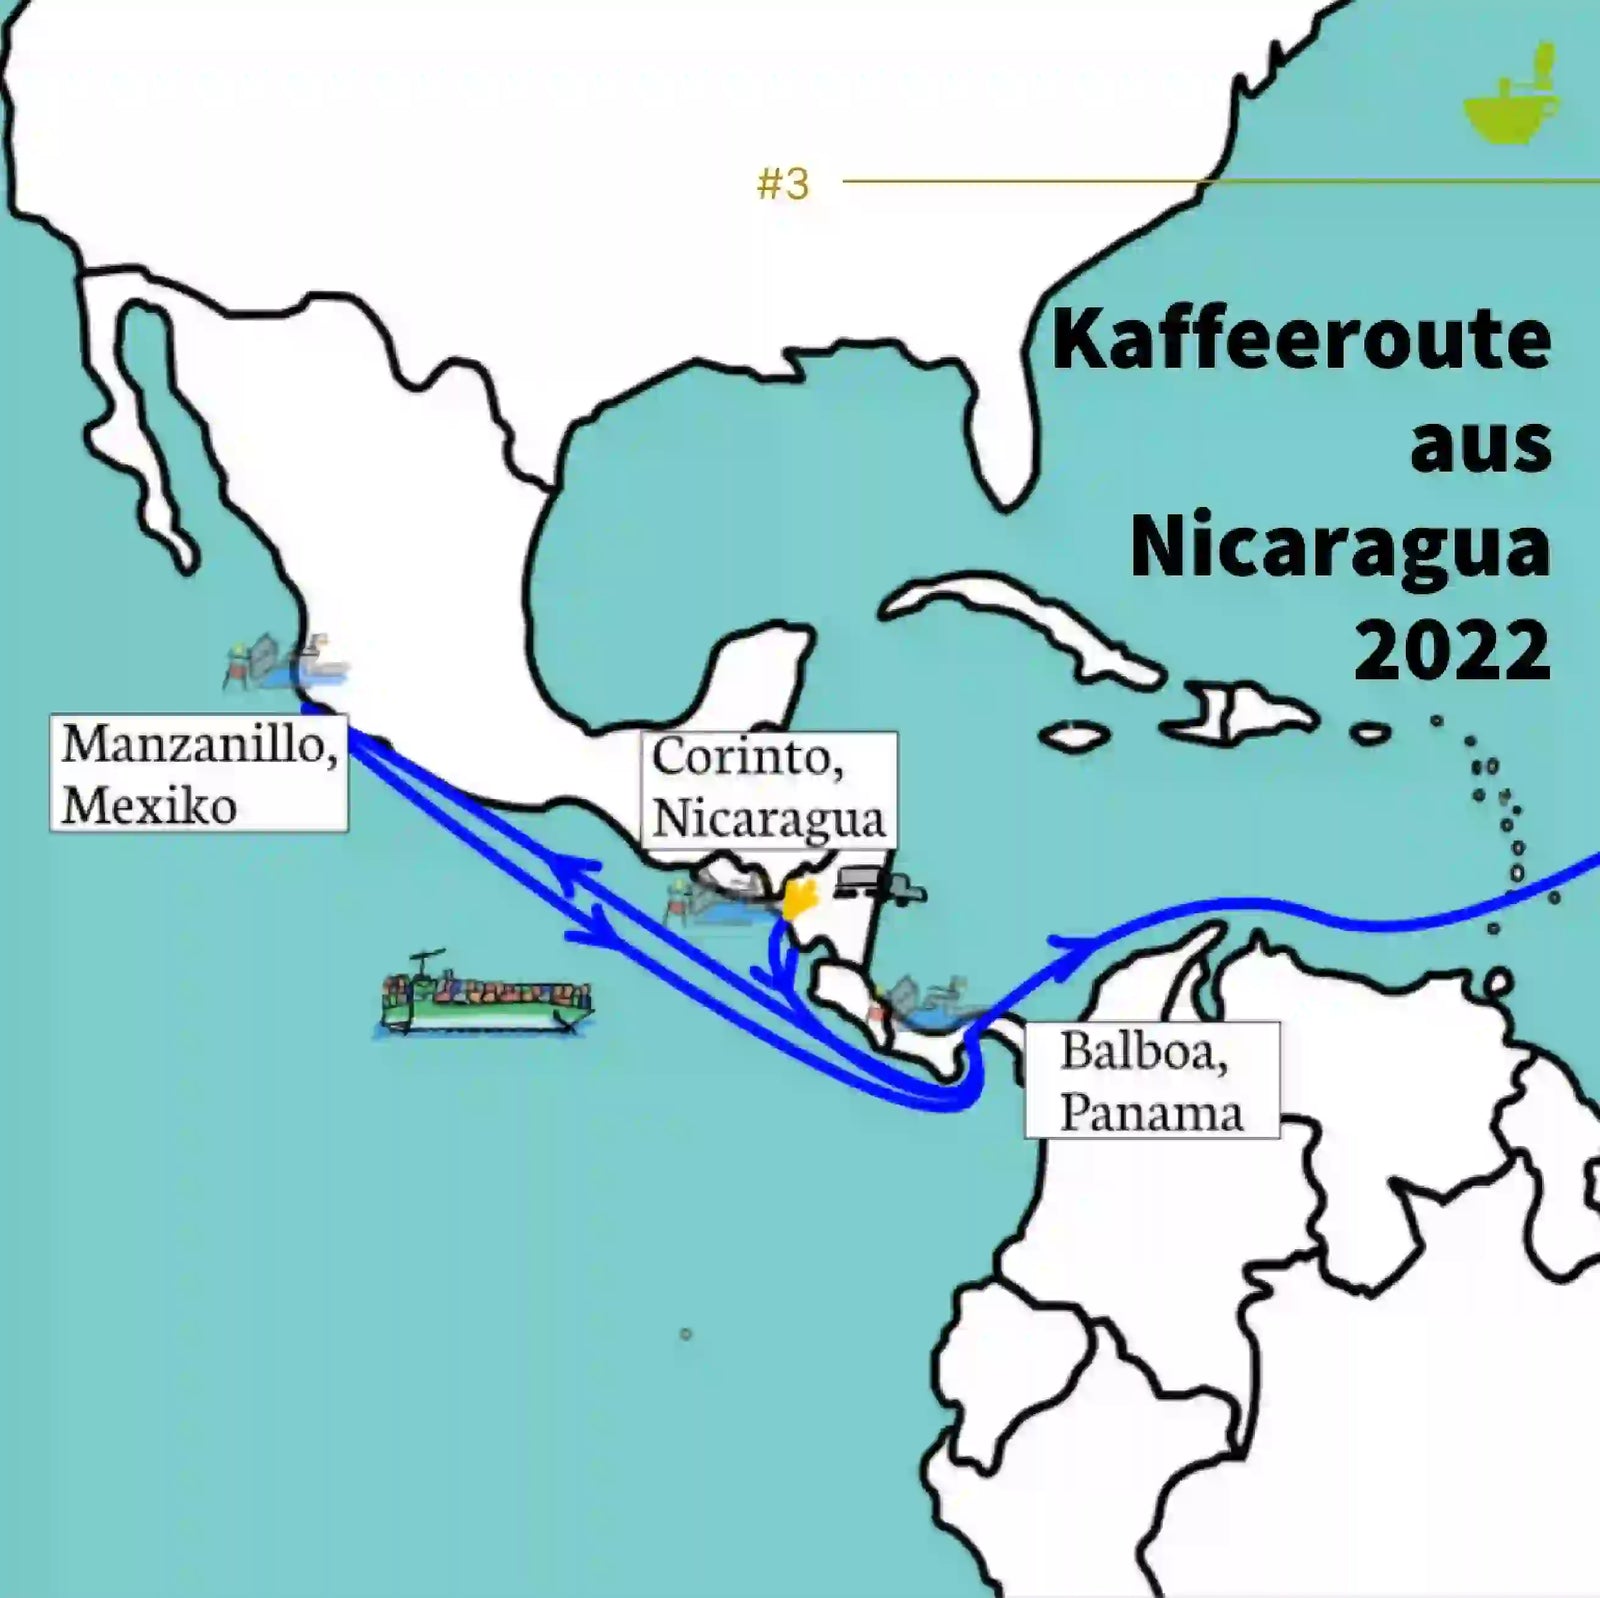
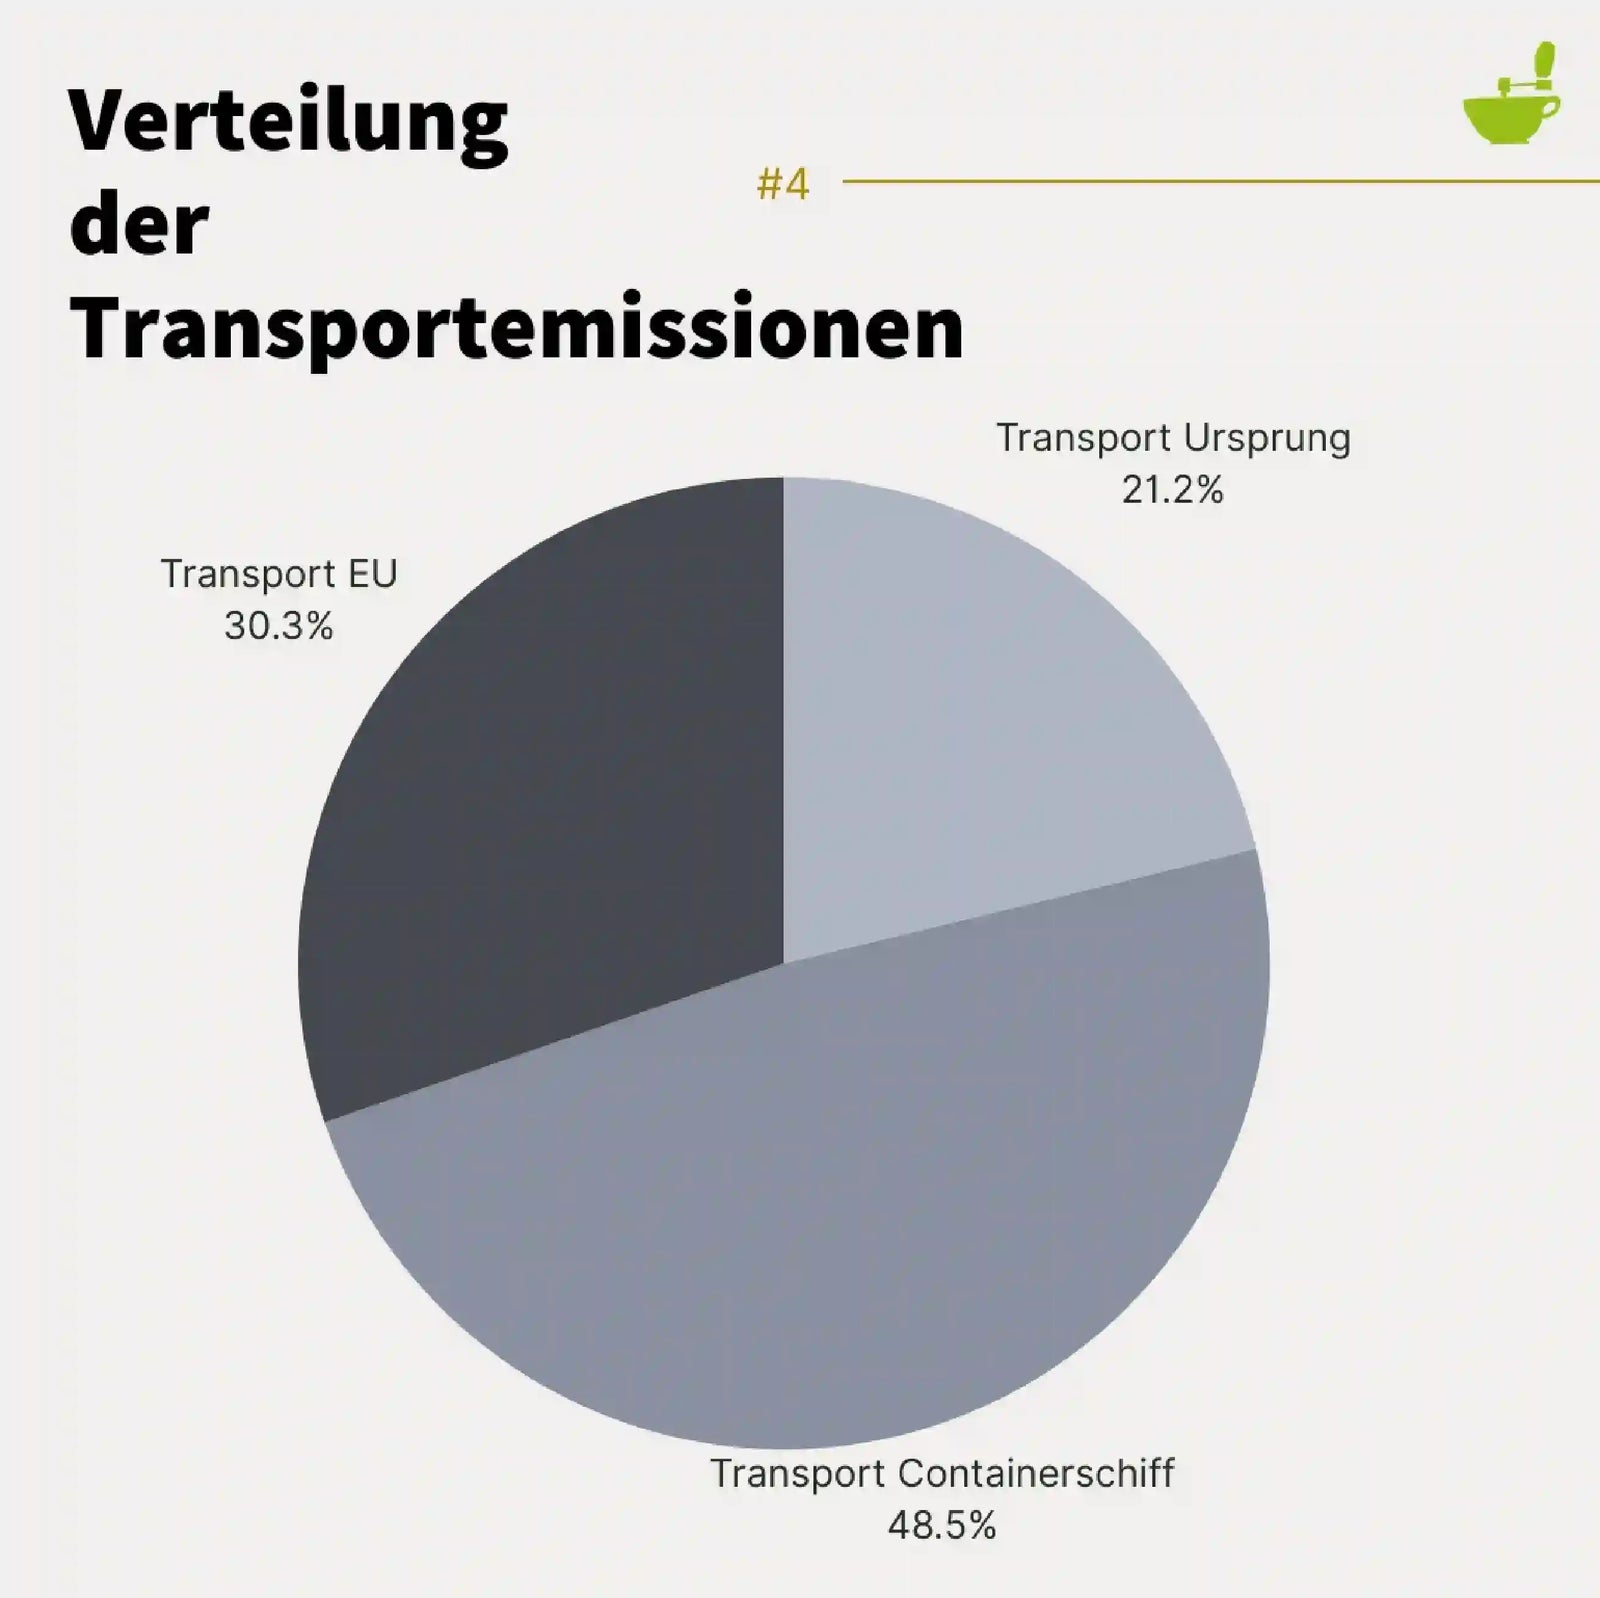
In our assessment, transport is divided into "cultivation to port", "port to port" (ship or air transport), and "port to roastery".
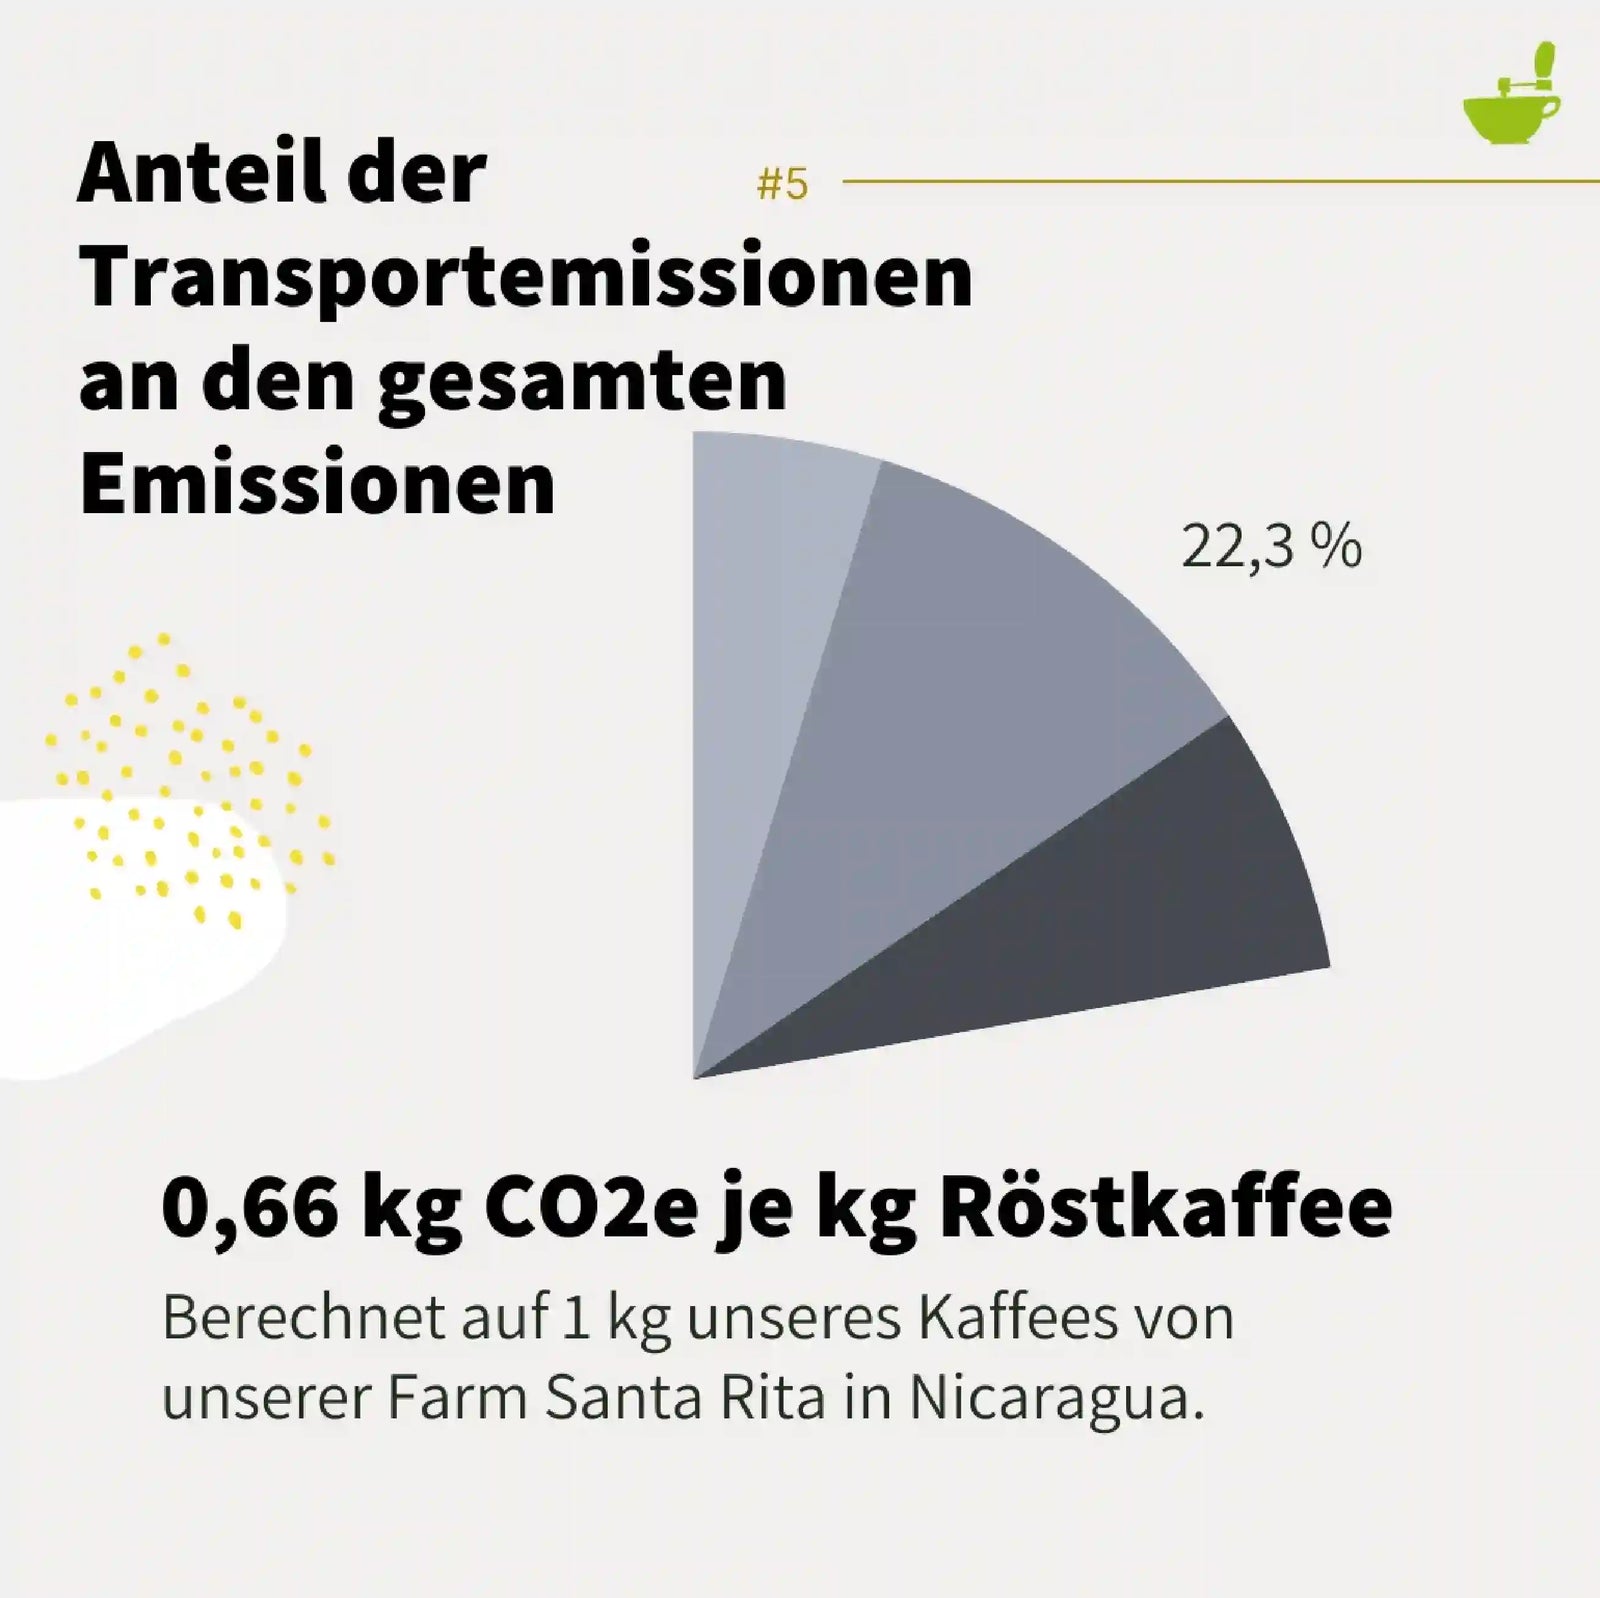
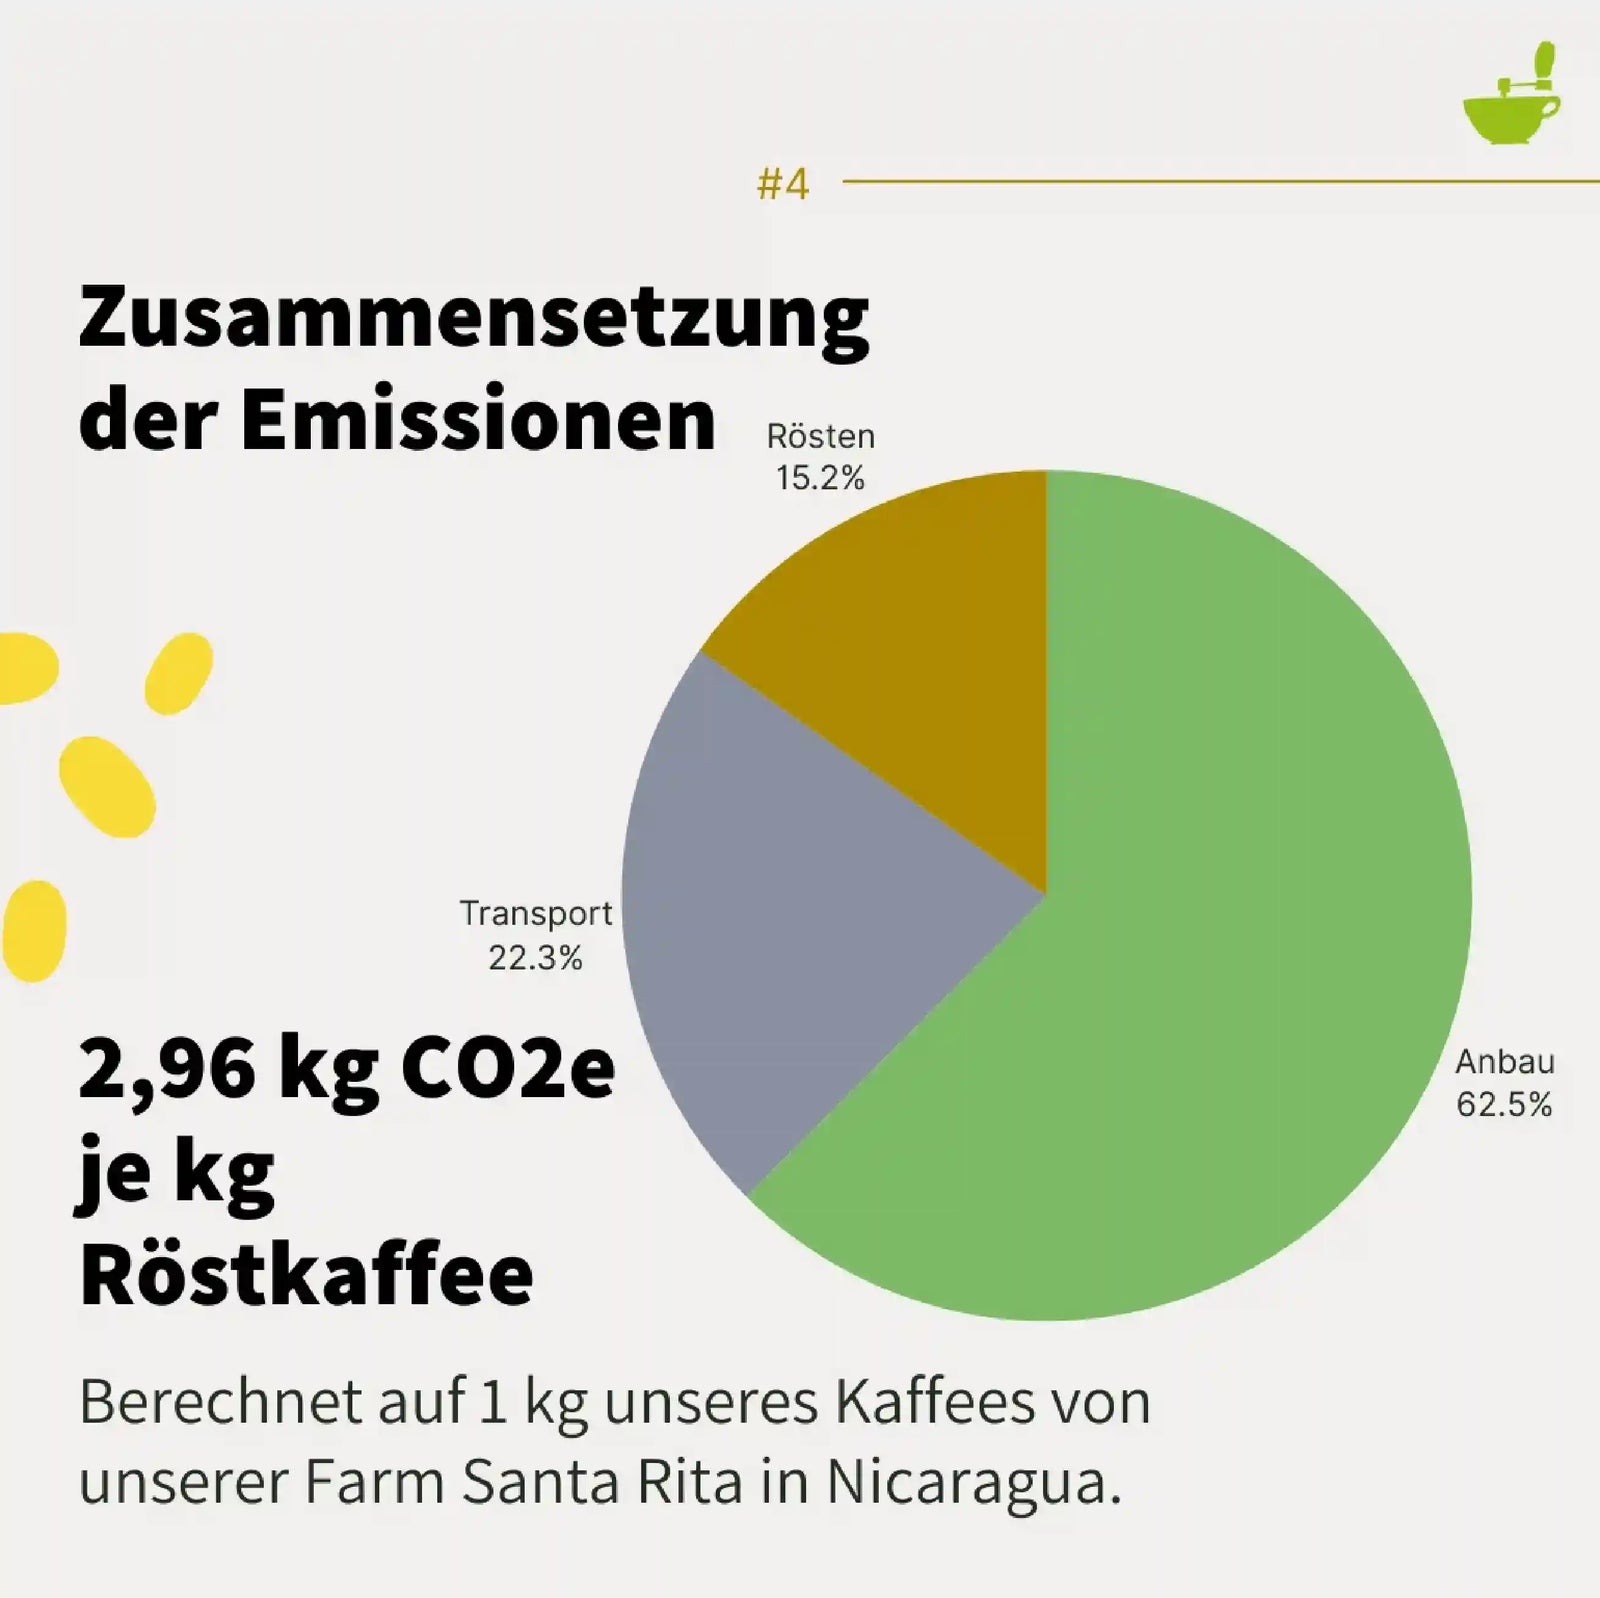
These three areas each account for approximately one third of transport emissions. Transport in turn accounts for 22.3% of total emissions for our Nicaragua coffees.
For the calculation, we created a simple CO₂ calculator. It is based on data from the Mobitool and can be applied to any shipment. Whether coffee, cocoa, or avocado, tomatoes. The calculation is always based on the weight of the goods shipped.
The footprint of our roastery
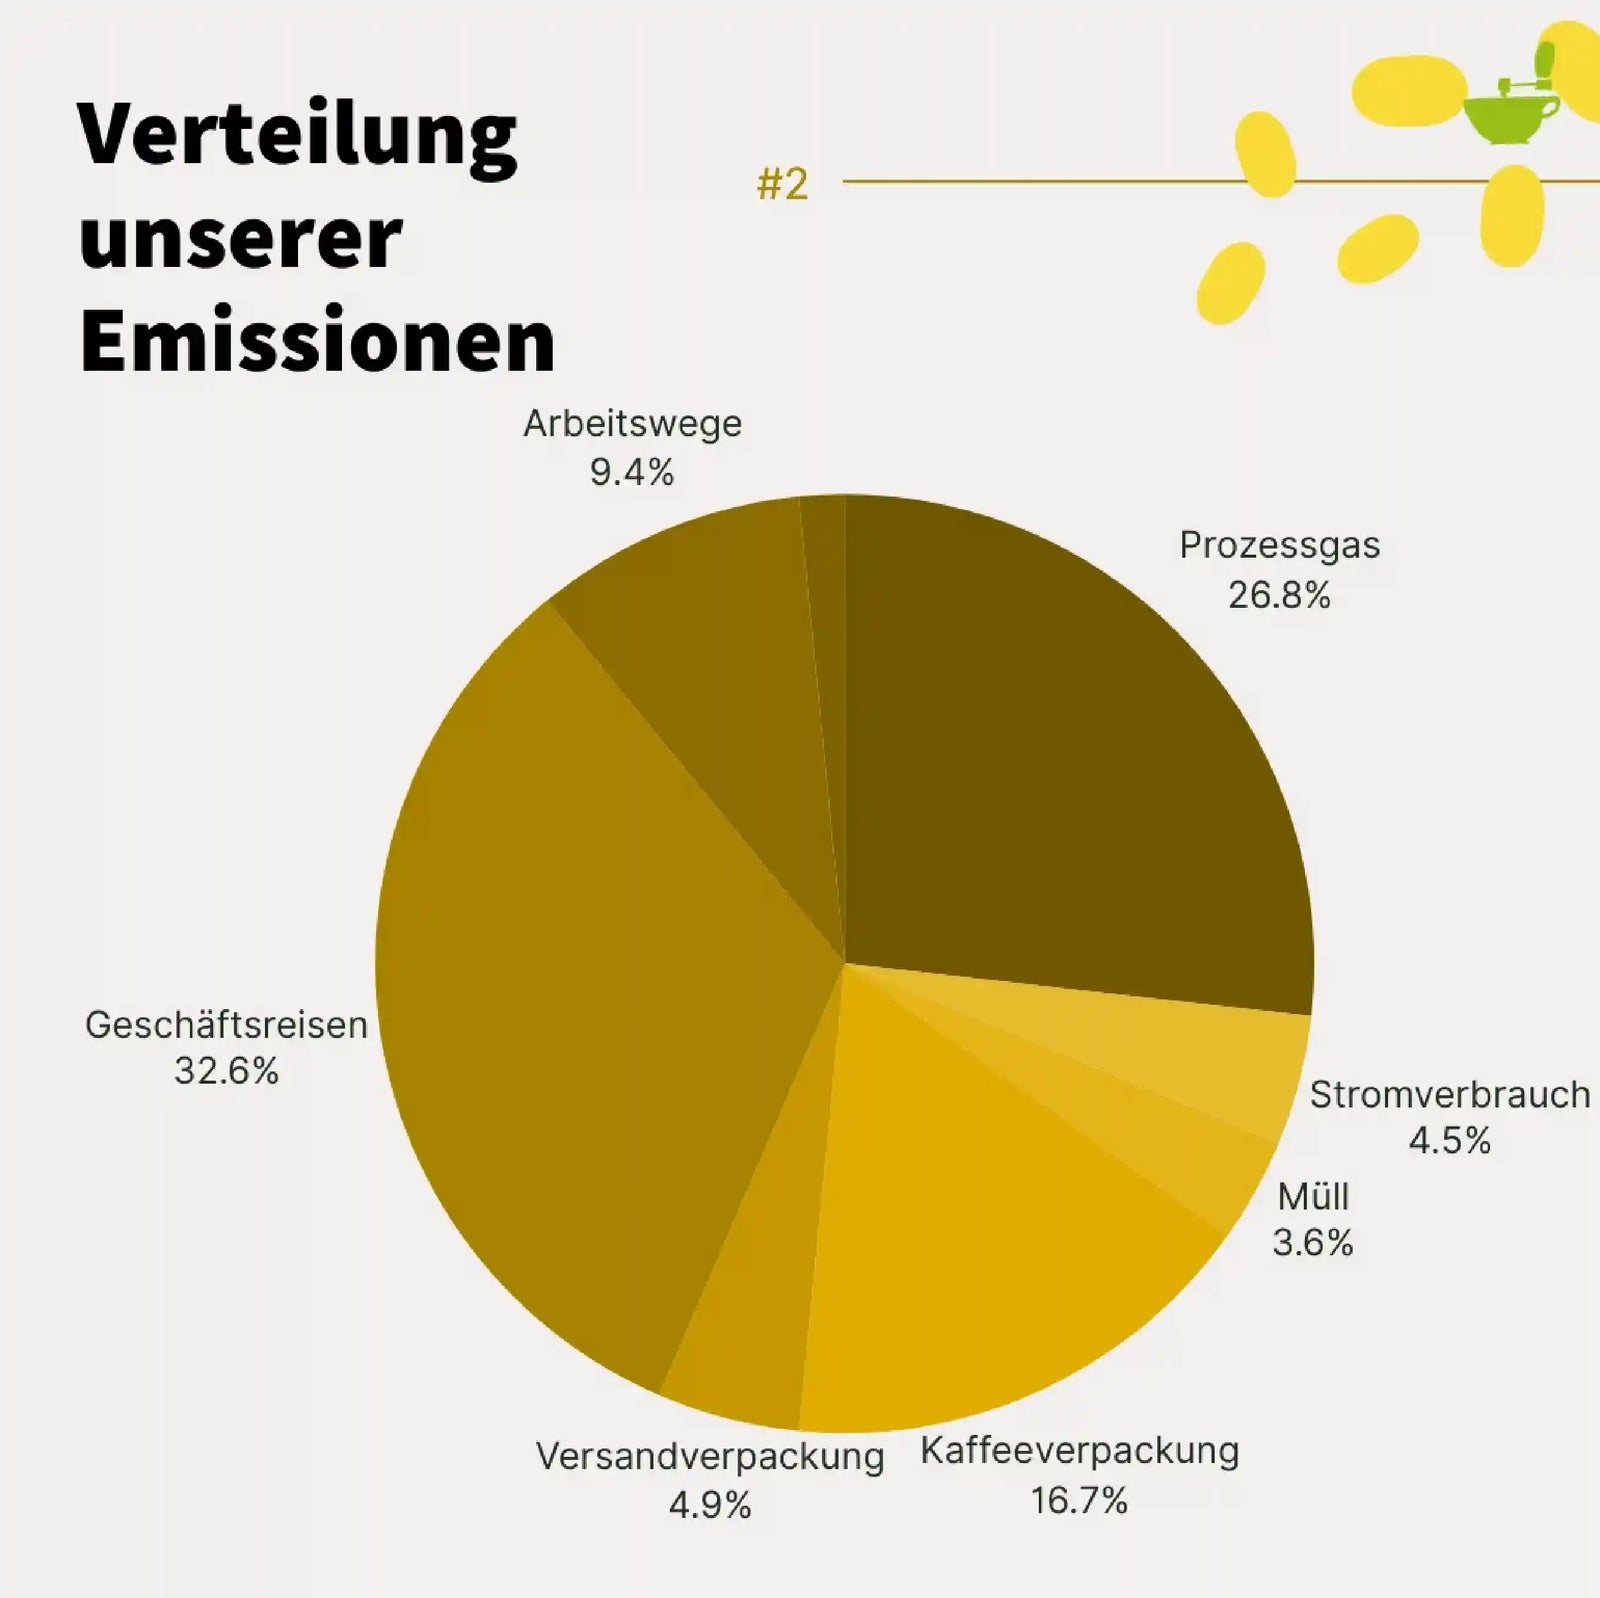
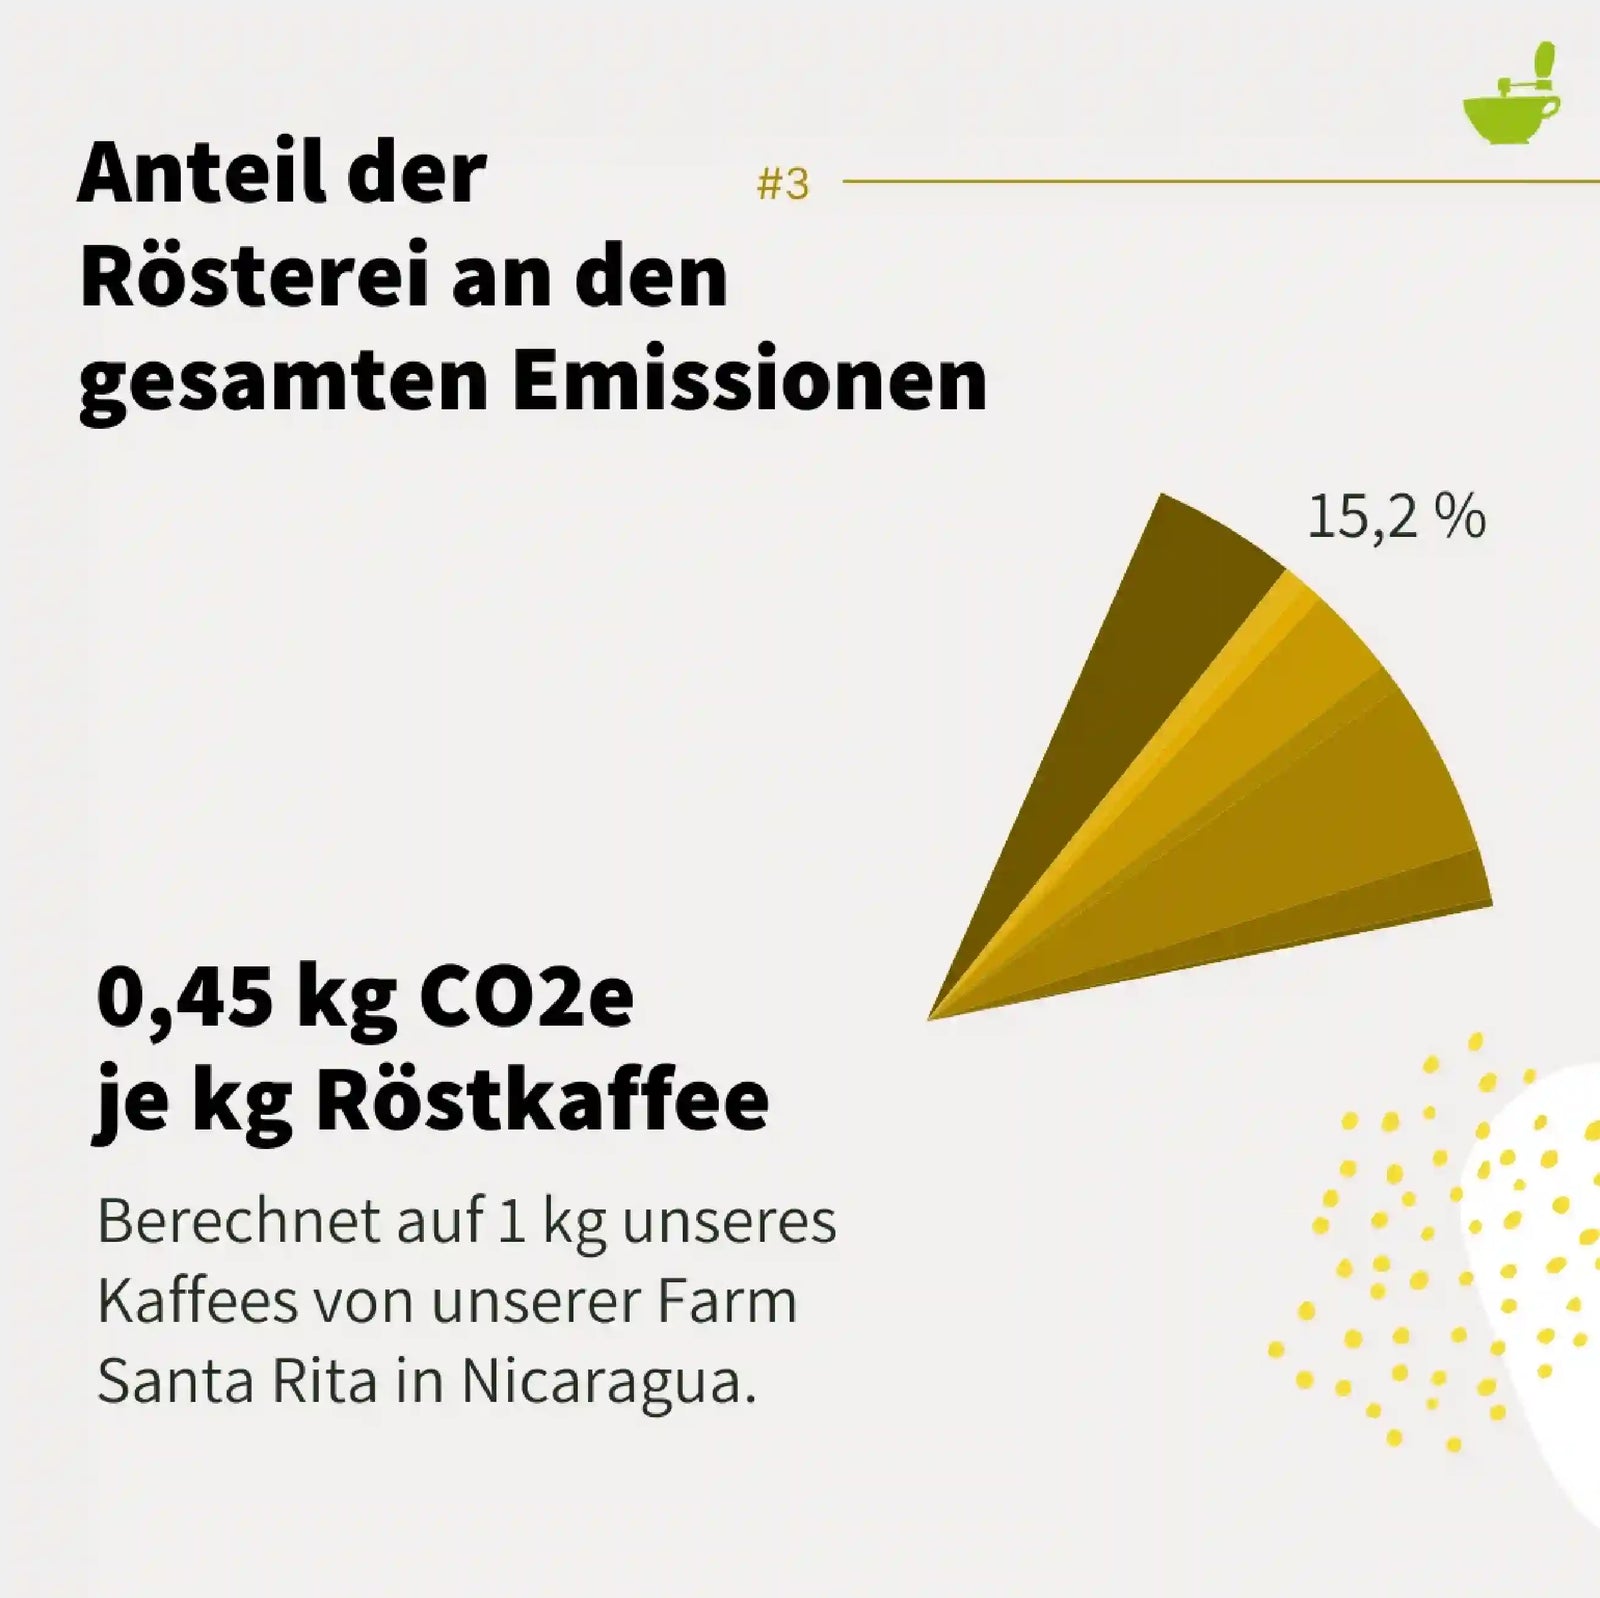
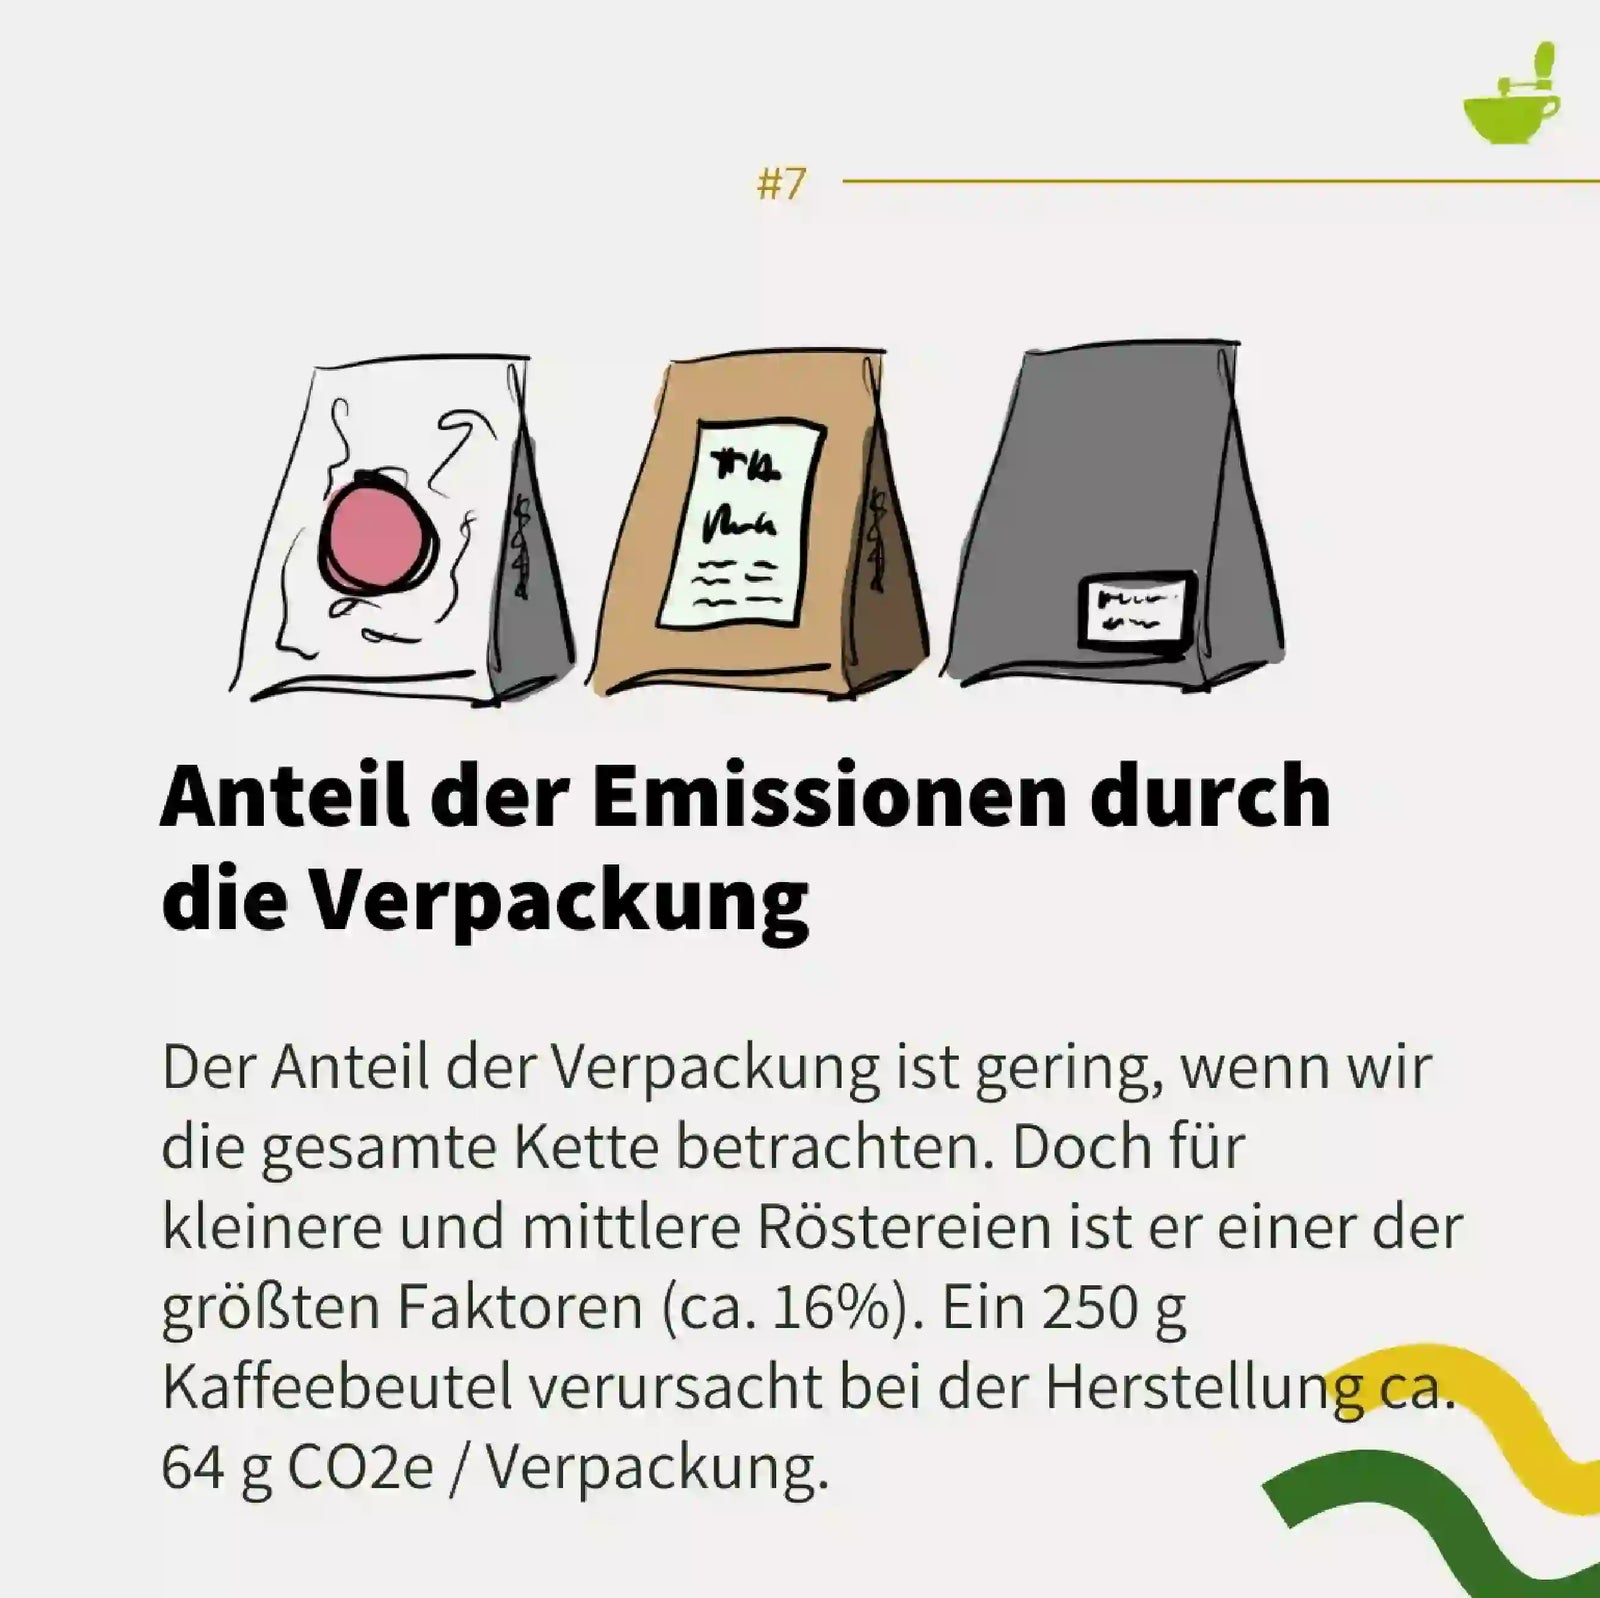
The Kaffeemacher roastery in Basel roasted nearly 50 tonnes of green coffee in 2022. This resulted in 22.12 tonnes of CO₂ equivalents. Broken down per kilogram of coffee, that's still 0.45 kg CO₂e / kg roasted coffee and thus 15.2% for the Santa Rita coffee. The largest factors in the roastery's footprint are gas consumption for roasting, packaging, and business trips to the origin.
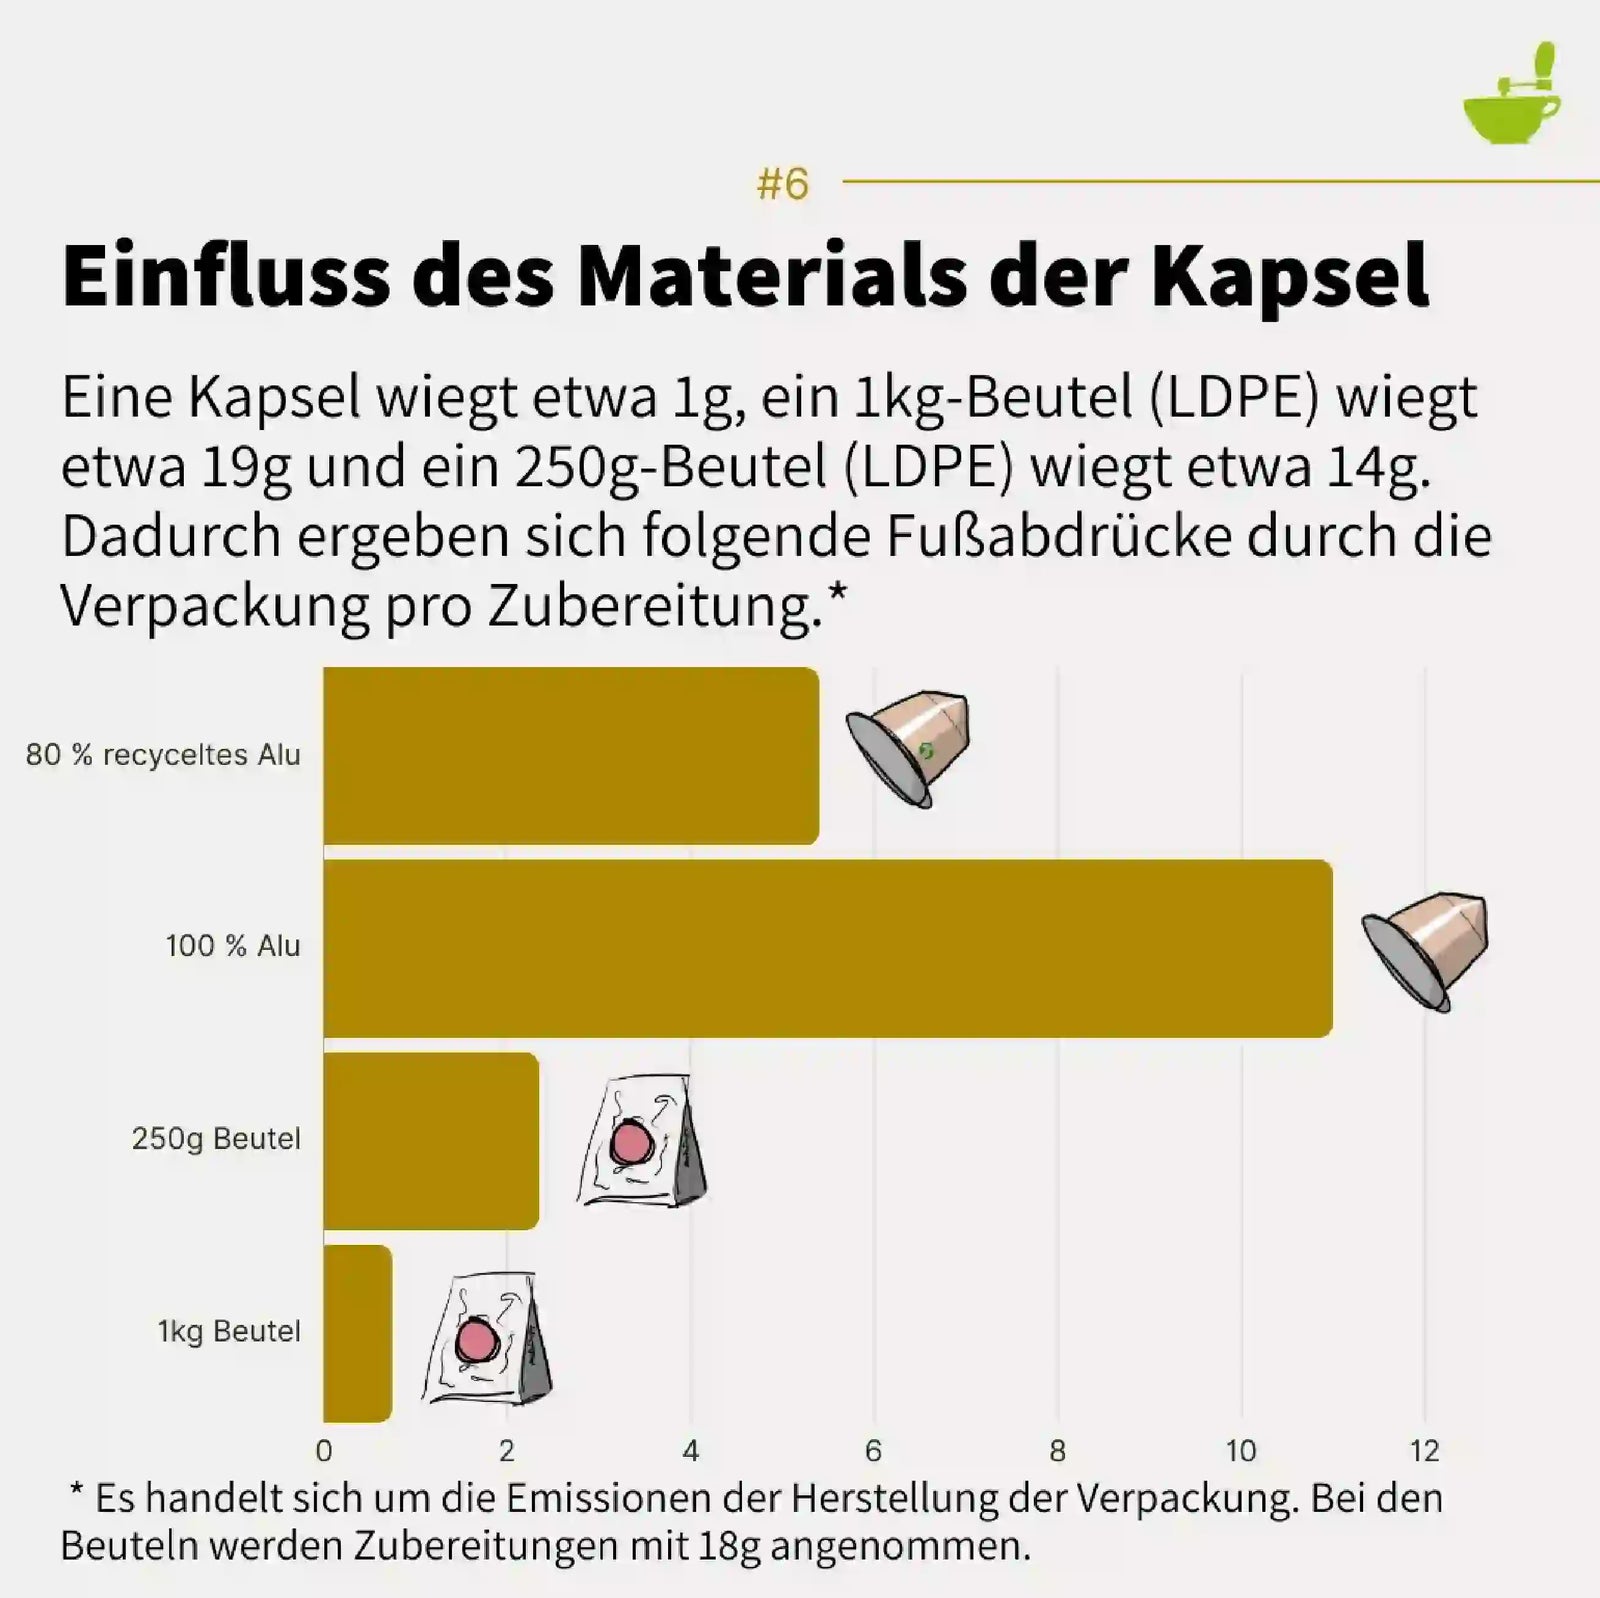
A 250g mono-plastic bag produces approximately 64 g CO₂ equivalents in manufacturing. If the bag goes to incineration, this value can roughly double.
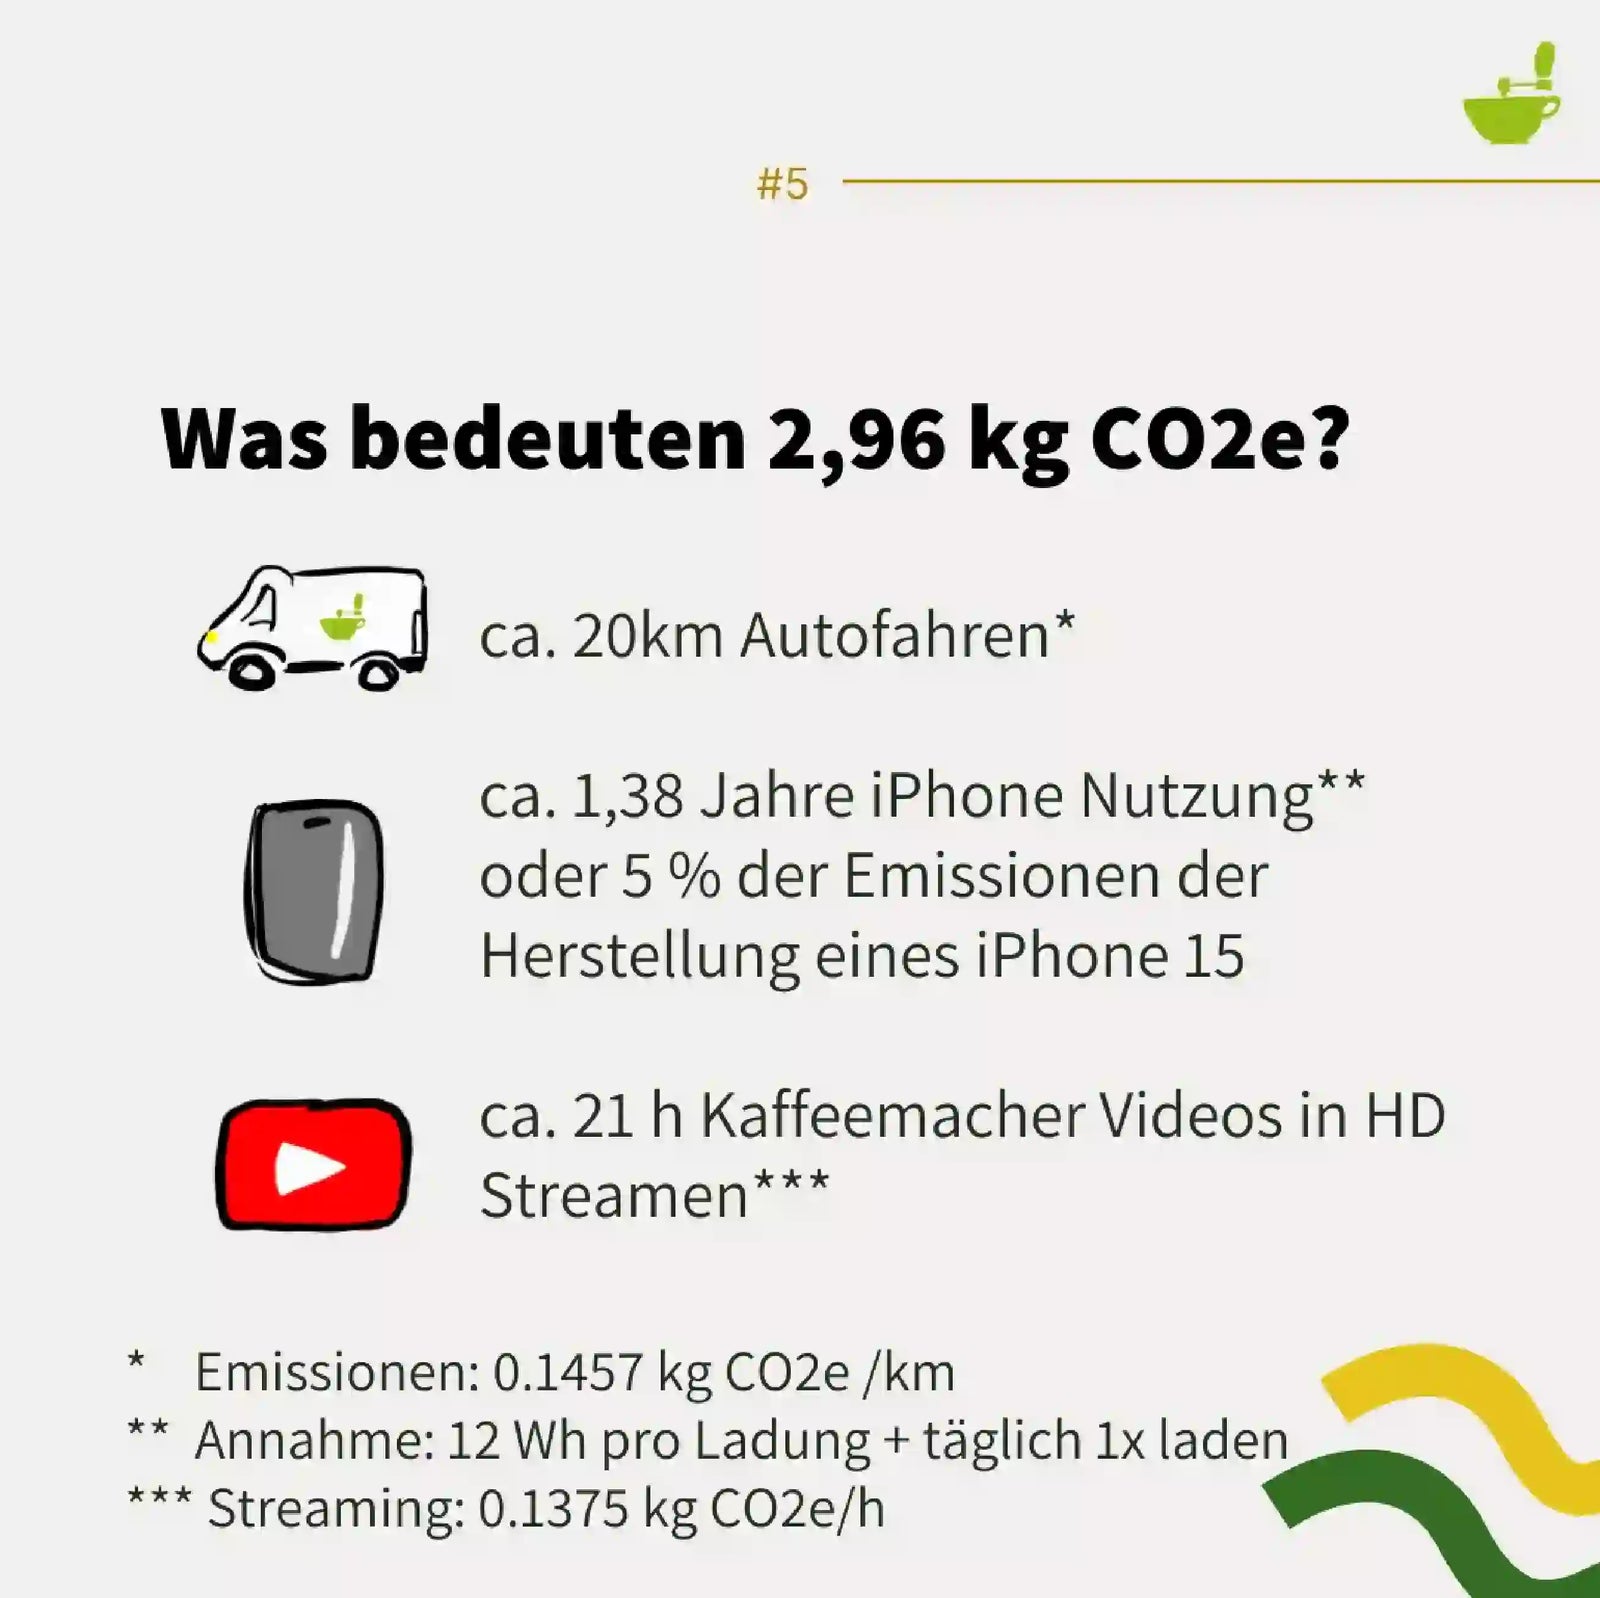
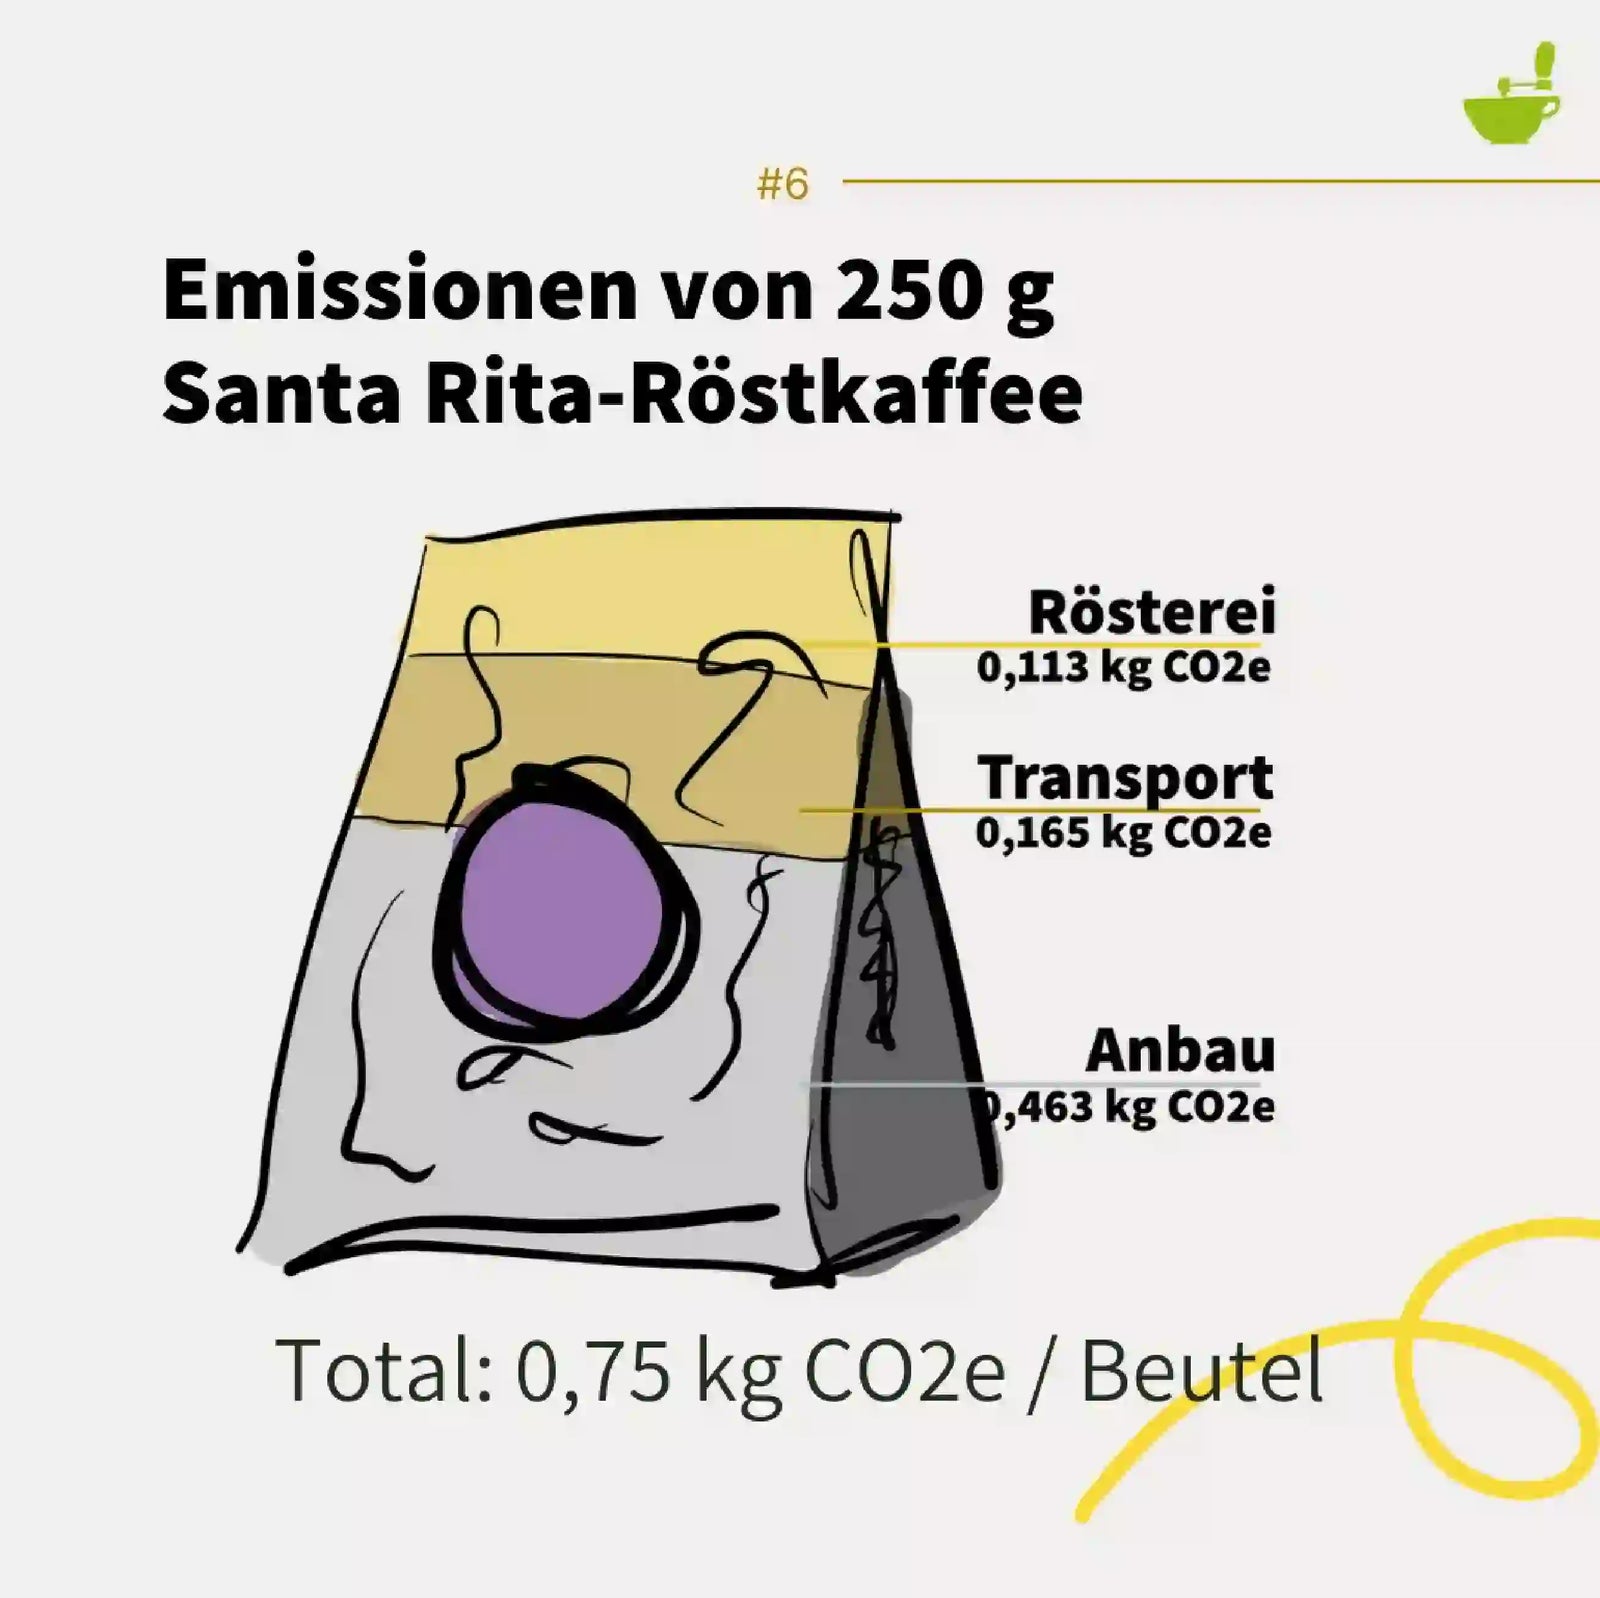
And even though it represents only a small part of the value chain, these are the measures we can implement on-site ourselves. Combined, cultivation, transport, and roasting amount to 2.96 kg CO₂e / kg roasted coffee (that's 0.75 kg CO₂e / 250 g bag). This equals a car drive of approximately 20 km.
The CO₂ footprint of preparation
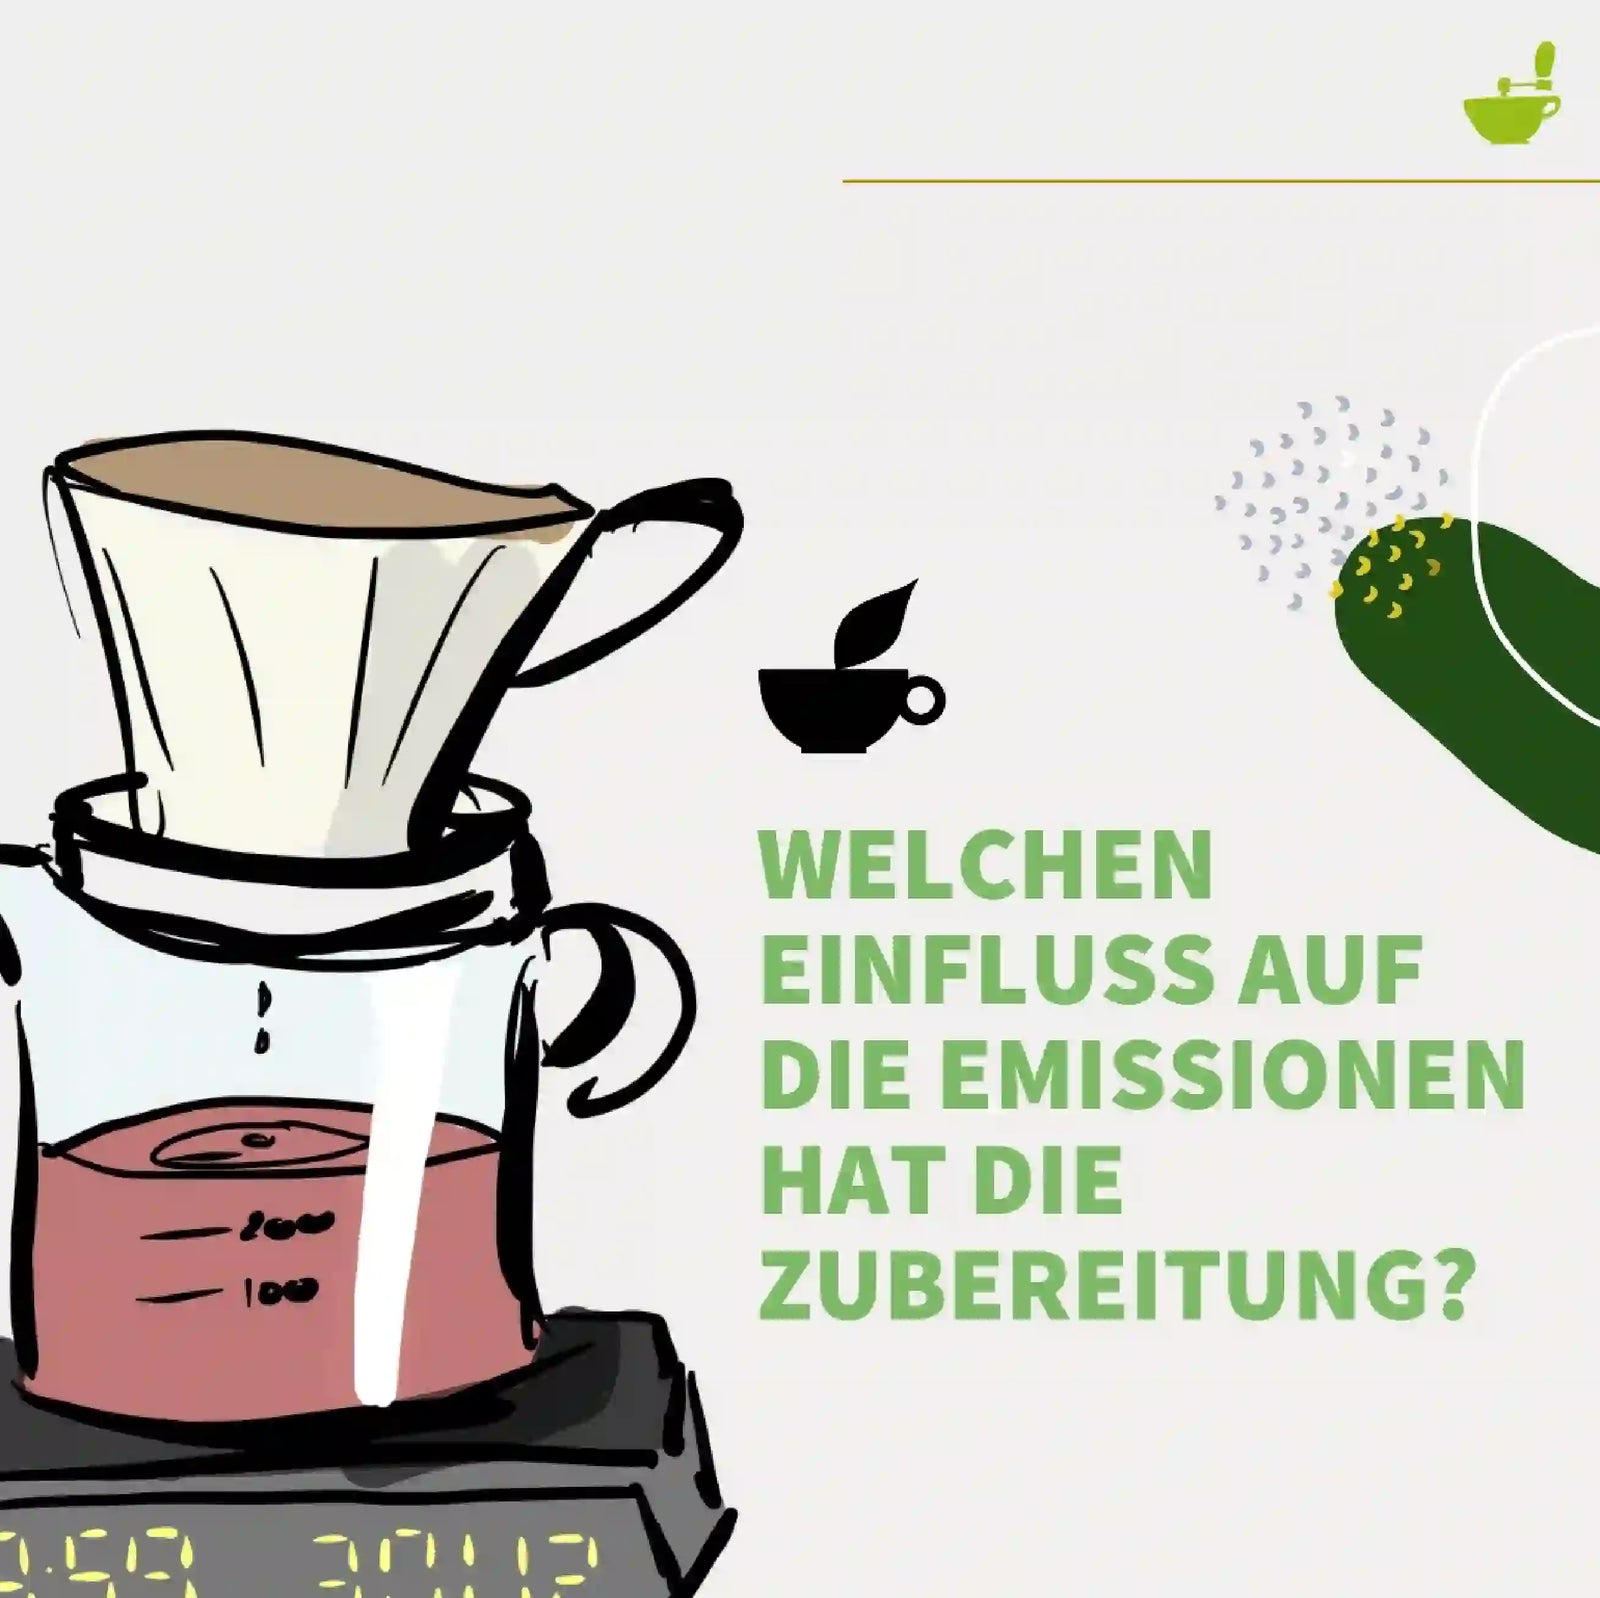
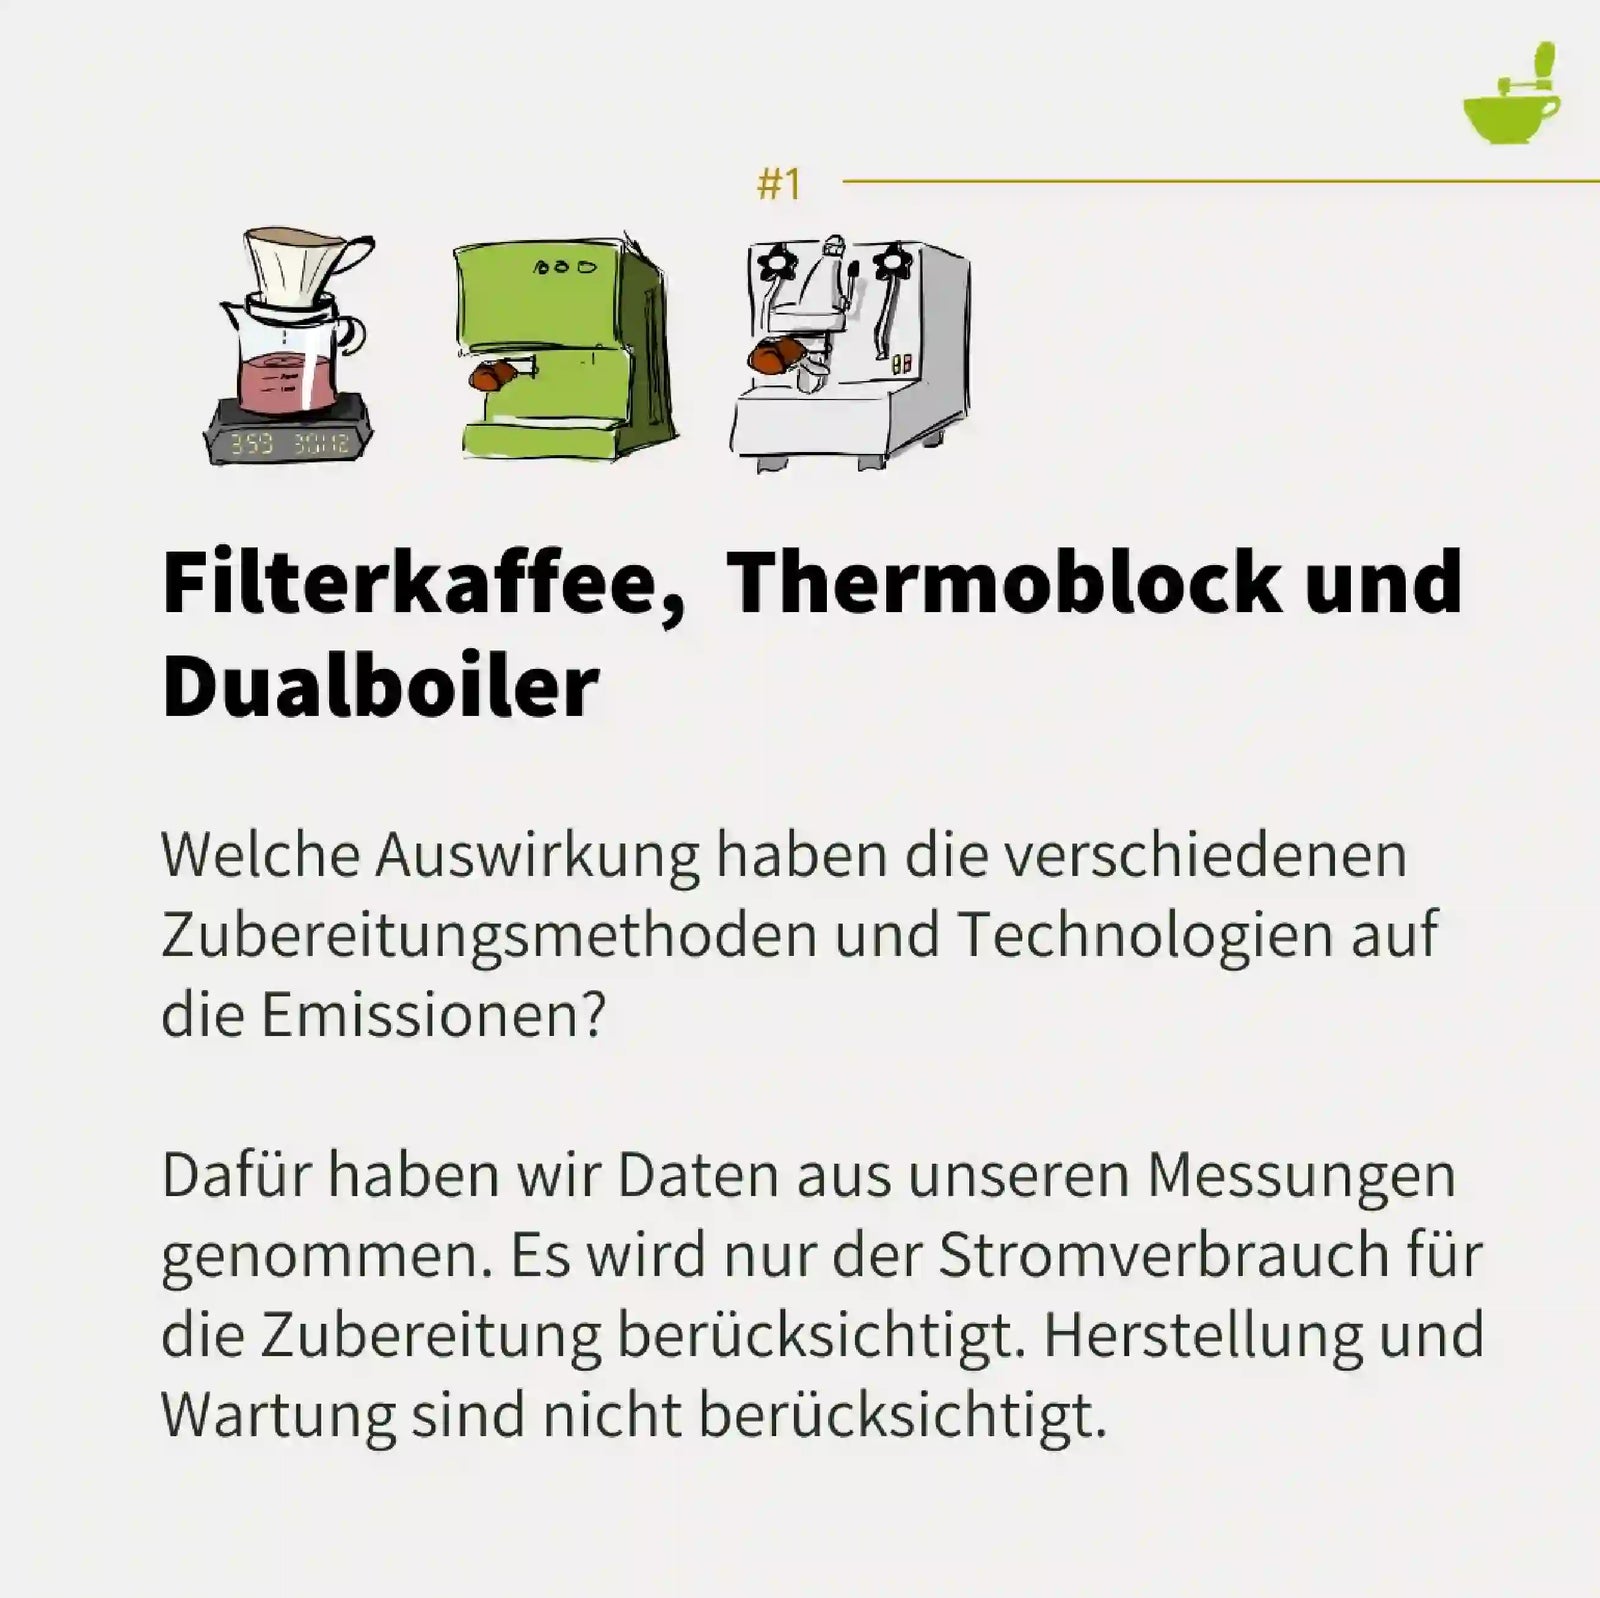
The last step before enjoyment is preparation. Depending on the method, it also contributes significantly to emissions. And this is despite the fact that manufacturing, disposal, and maintenance of machines are not considered in our assessment.
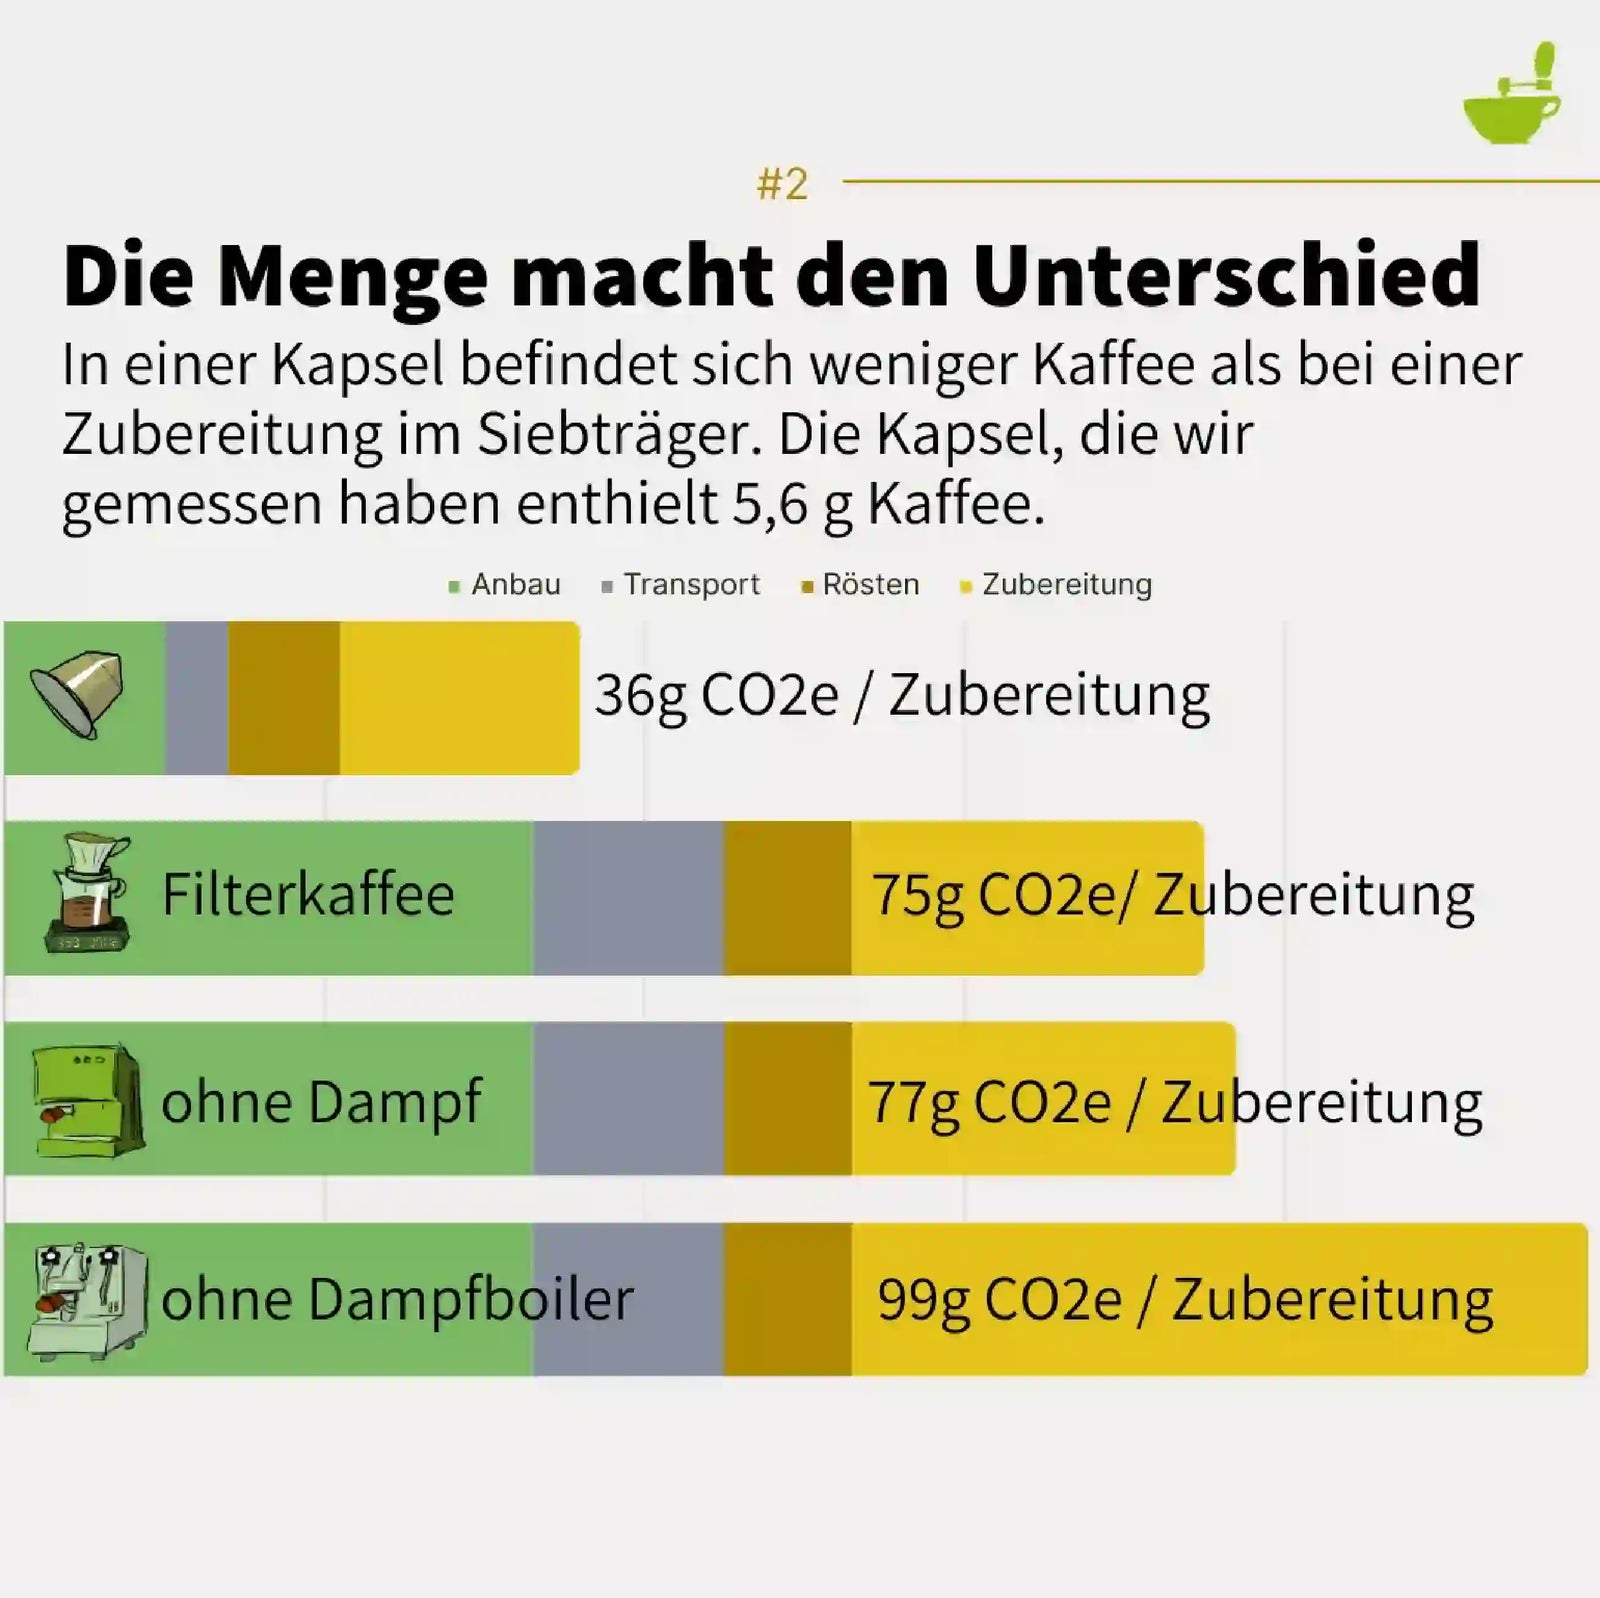
It turns out that preparation has a major influence on emissions as well. Beyond the method, the electricity mix used to power the coffee makers is especially decisive.
The data for the results are based on energy measurements we conduct for each machine for the test videos.
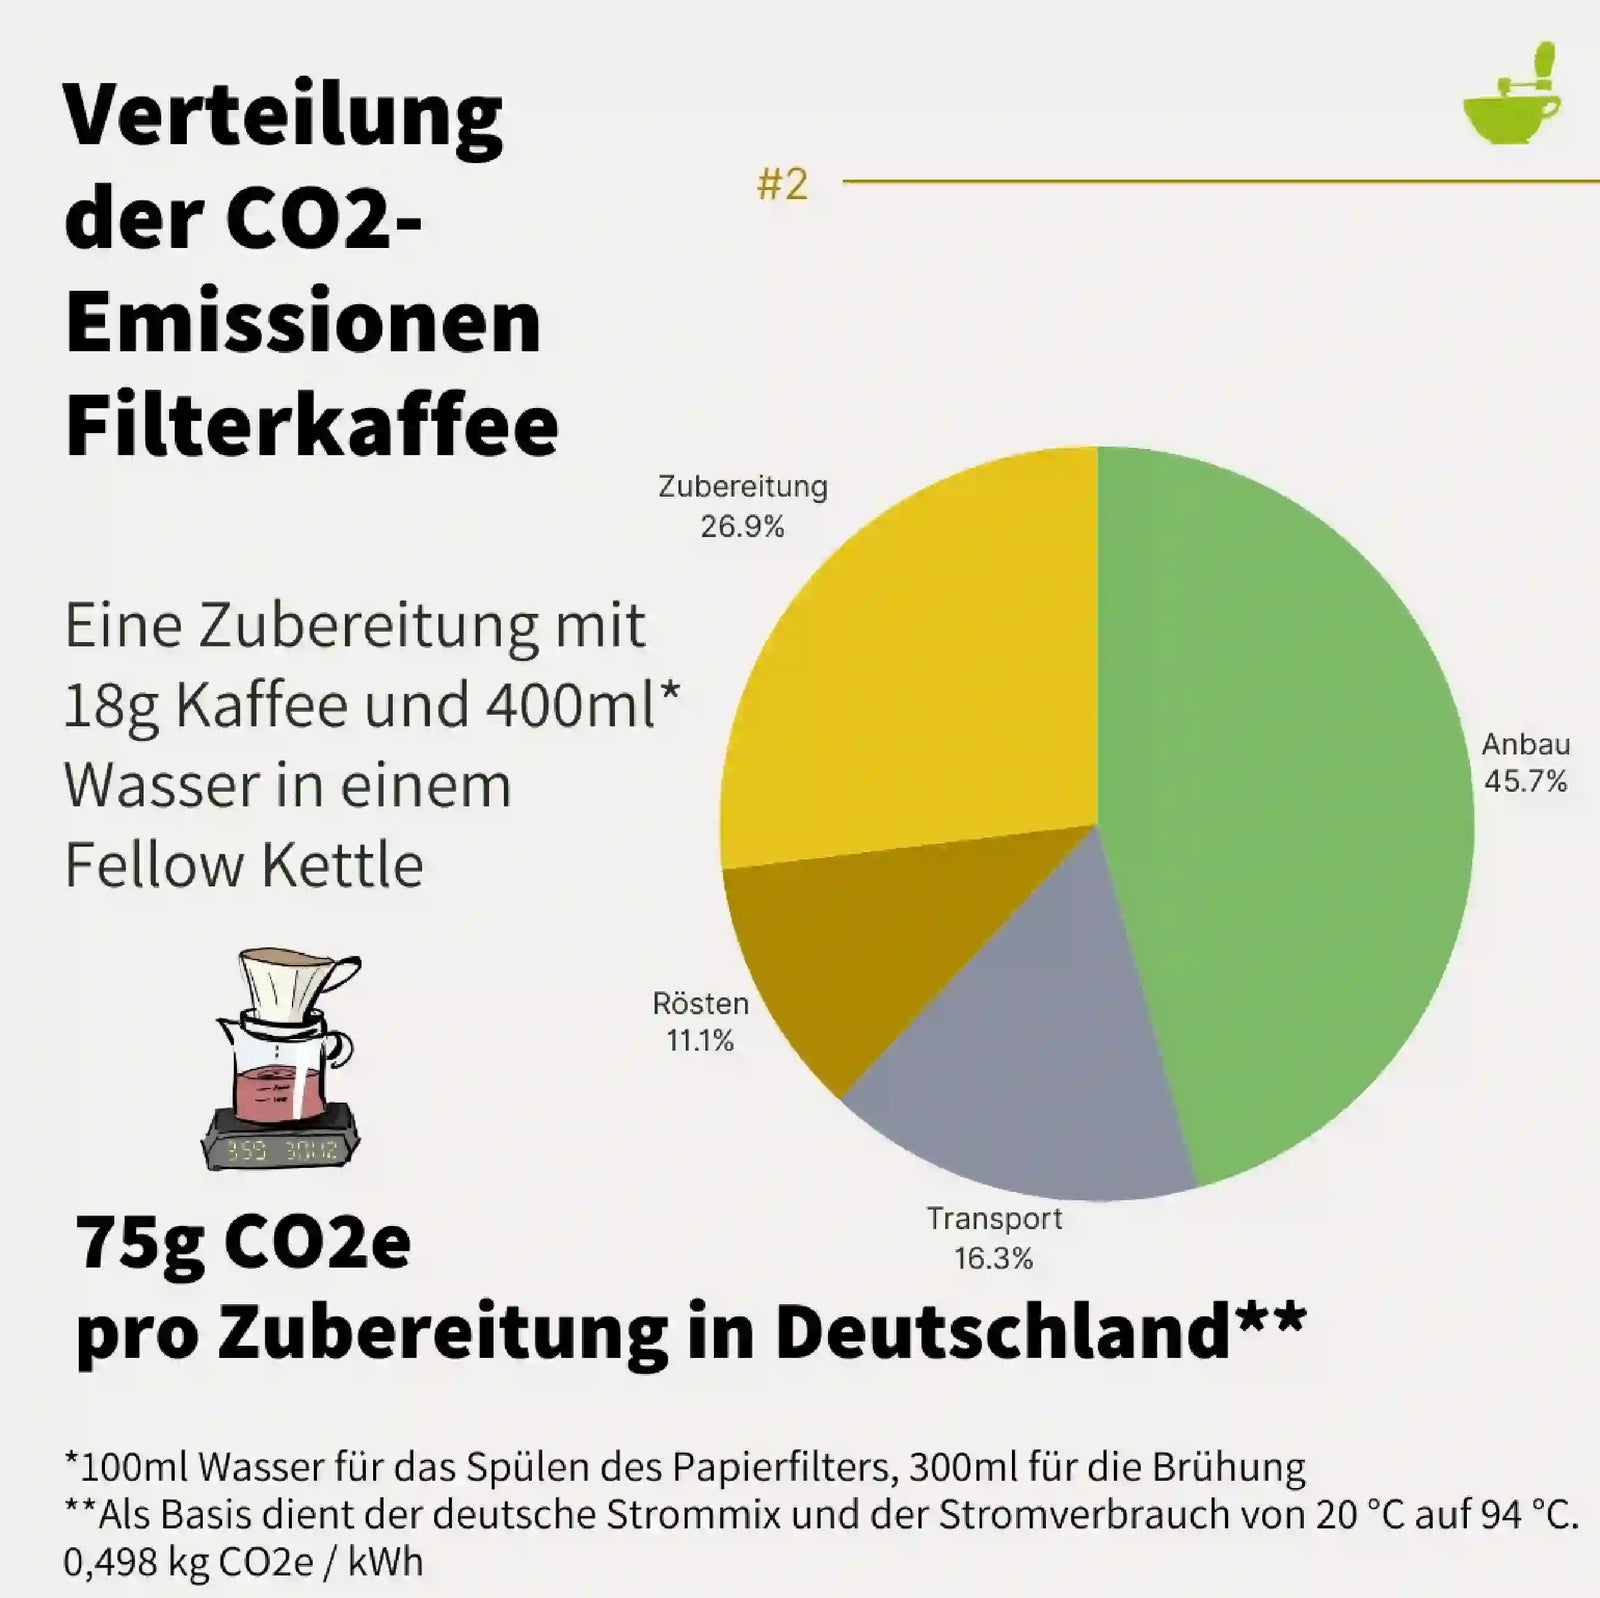
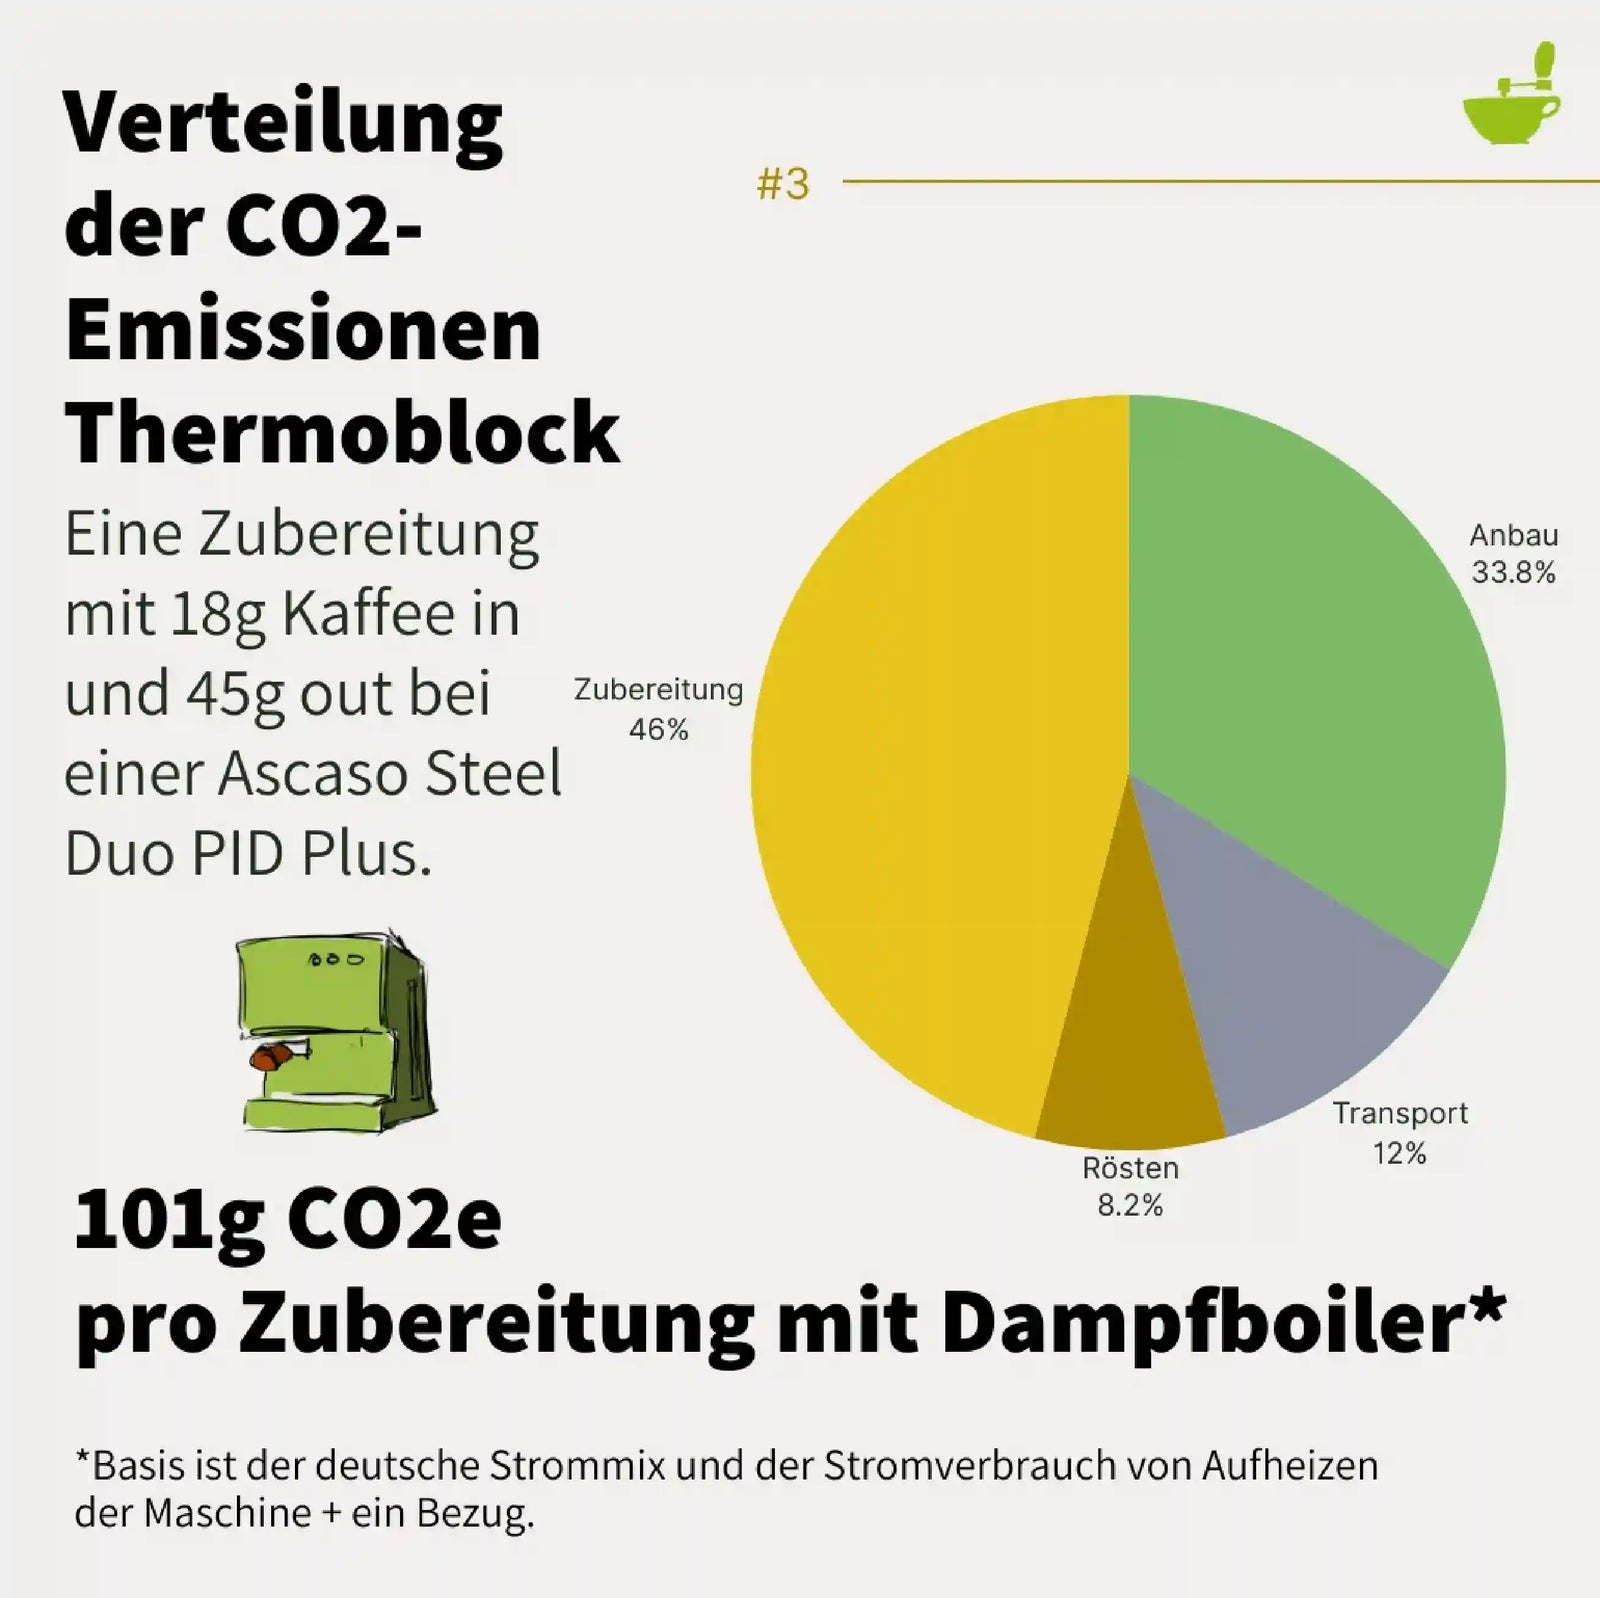
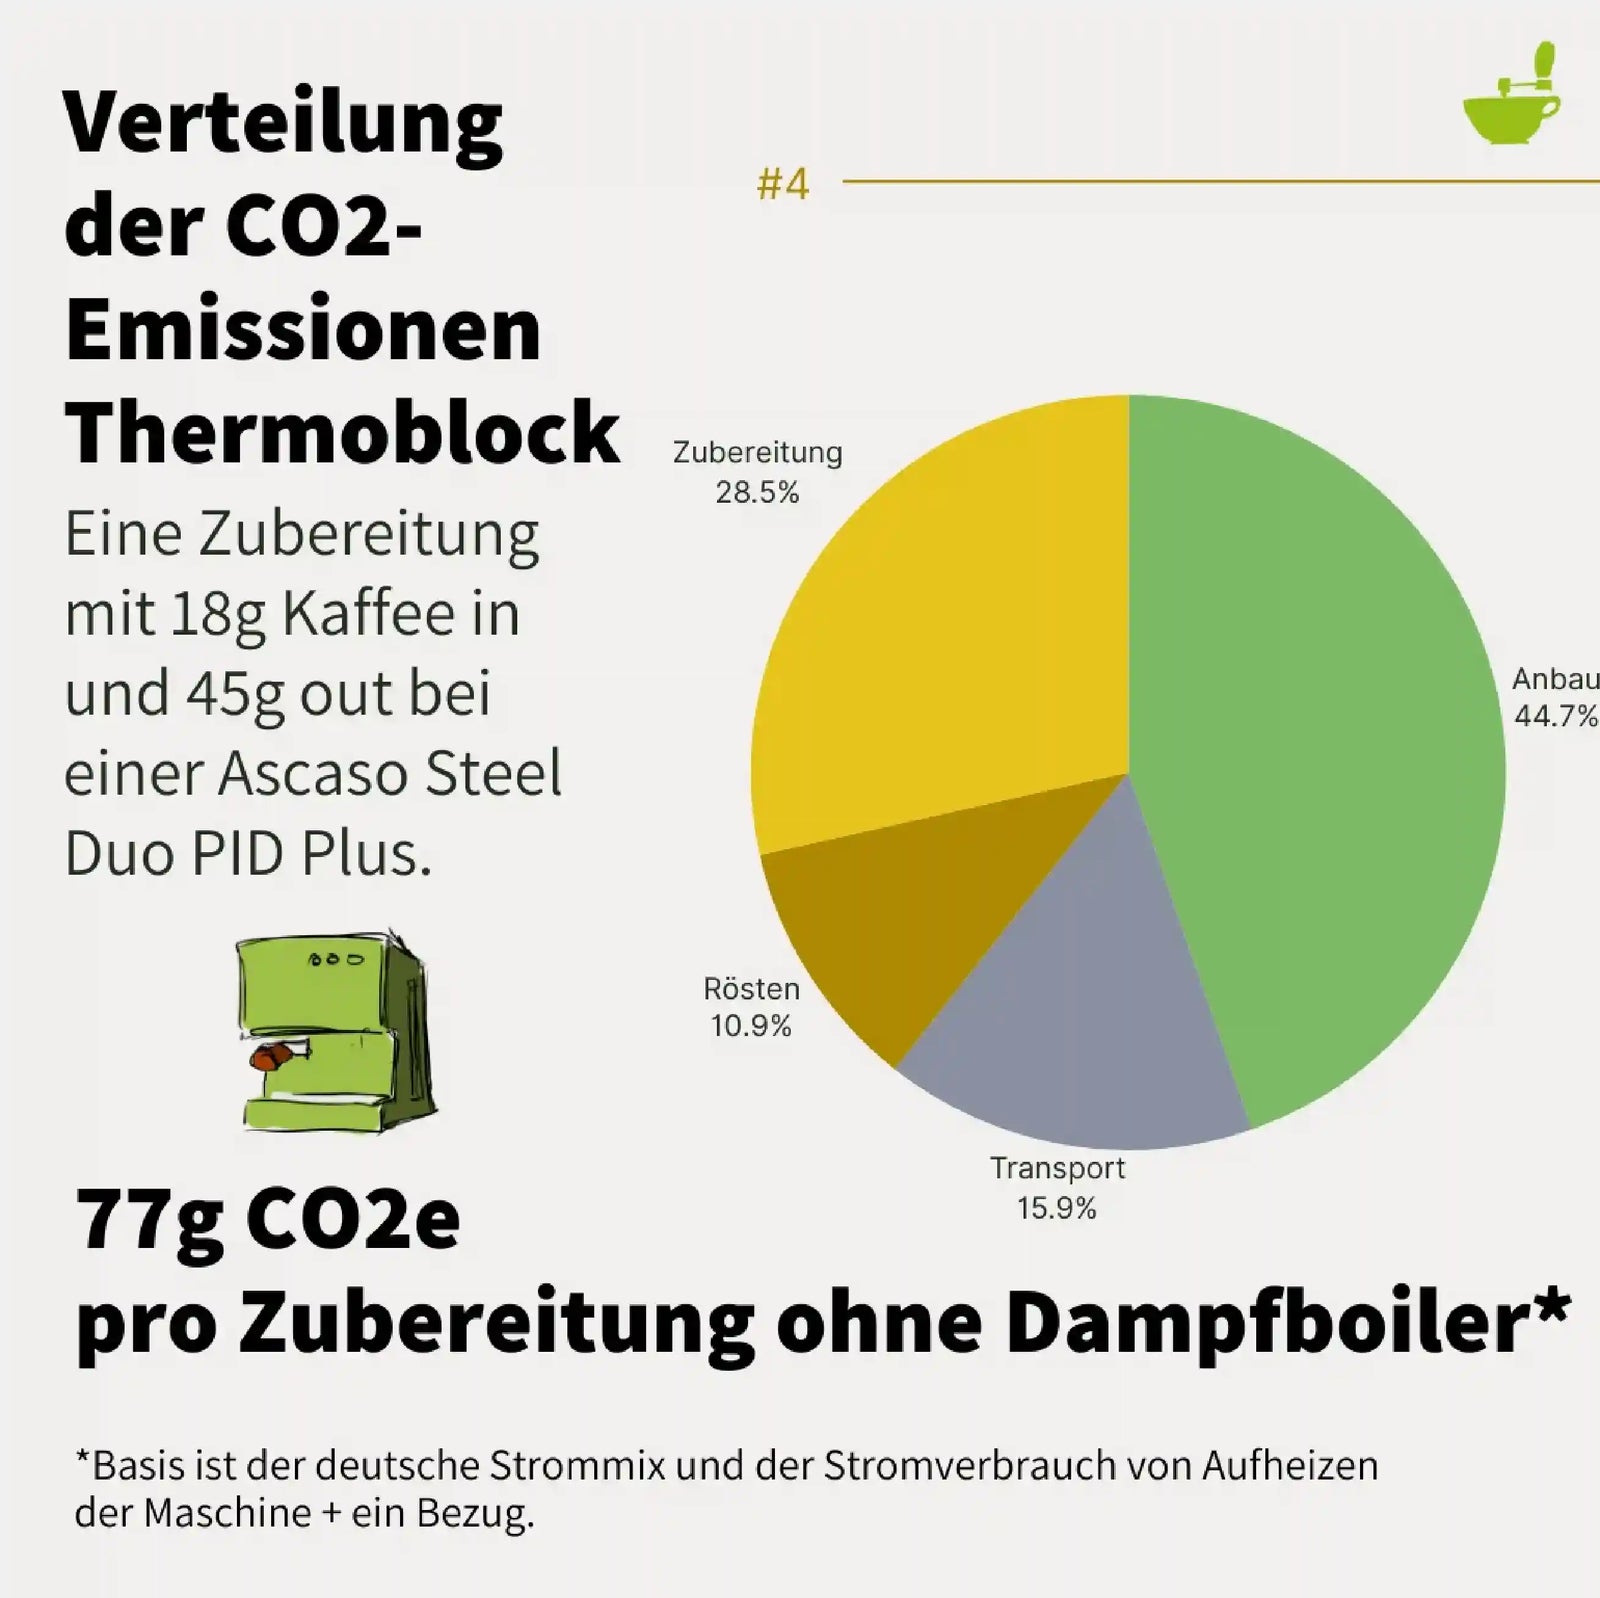
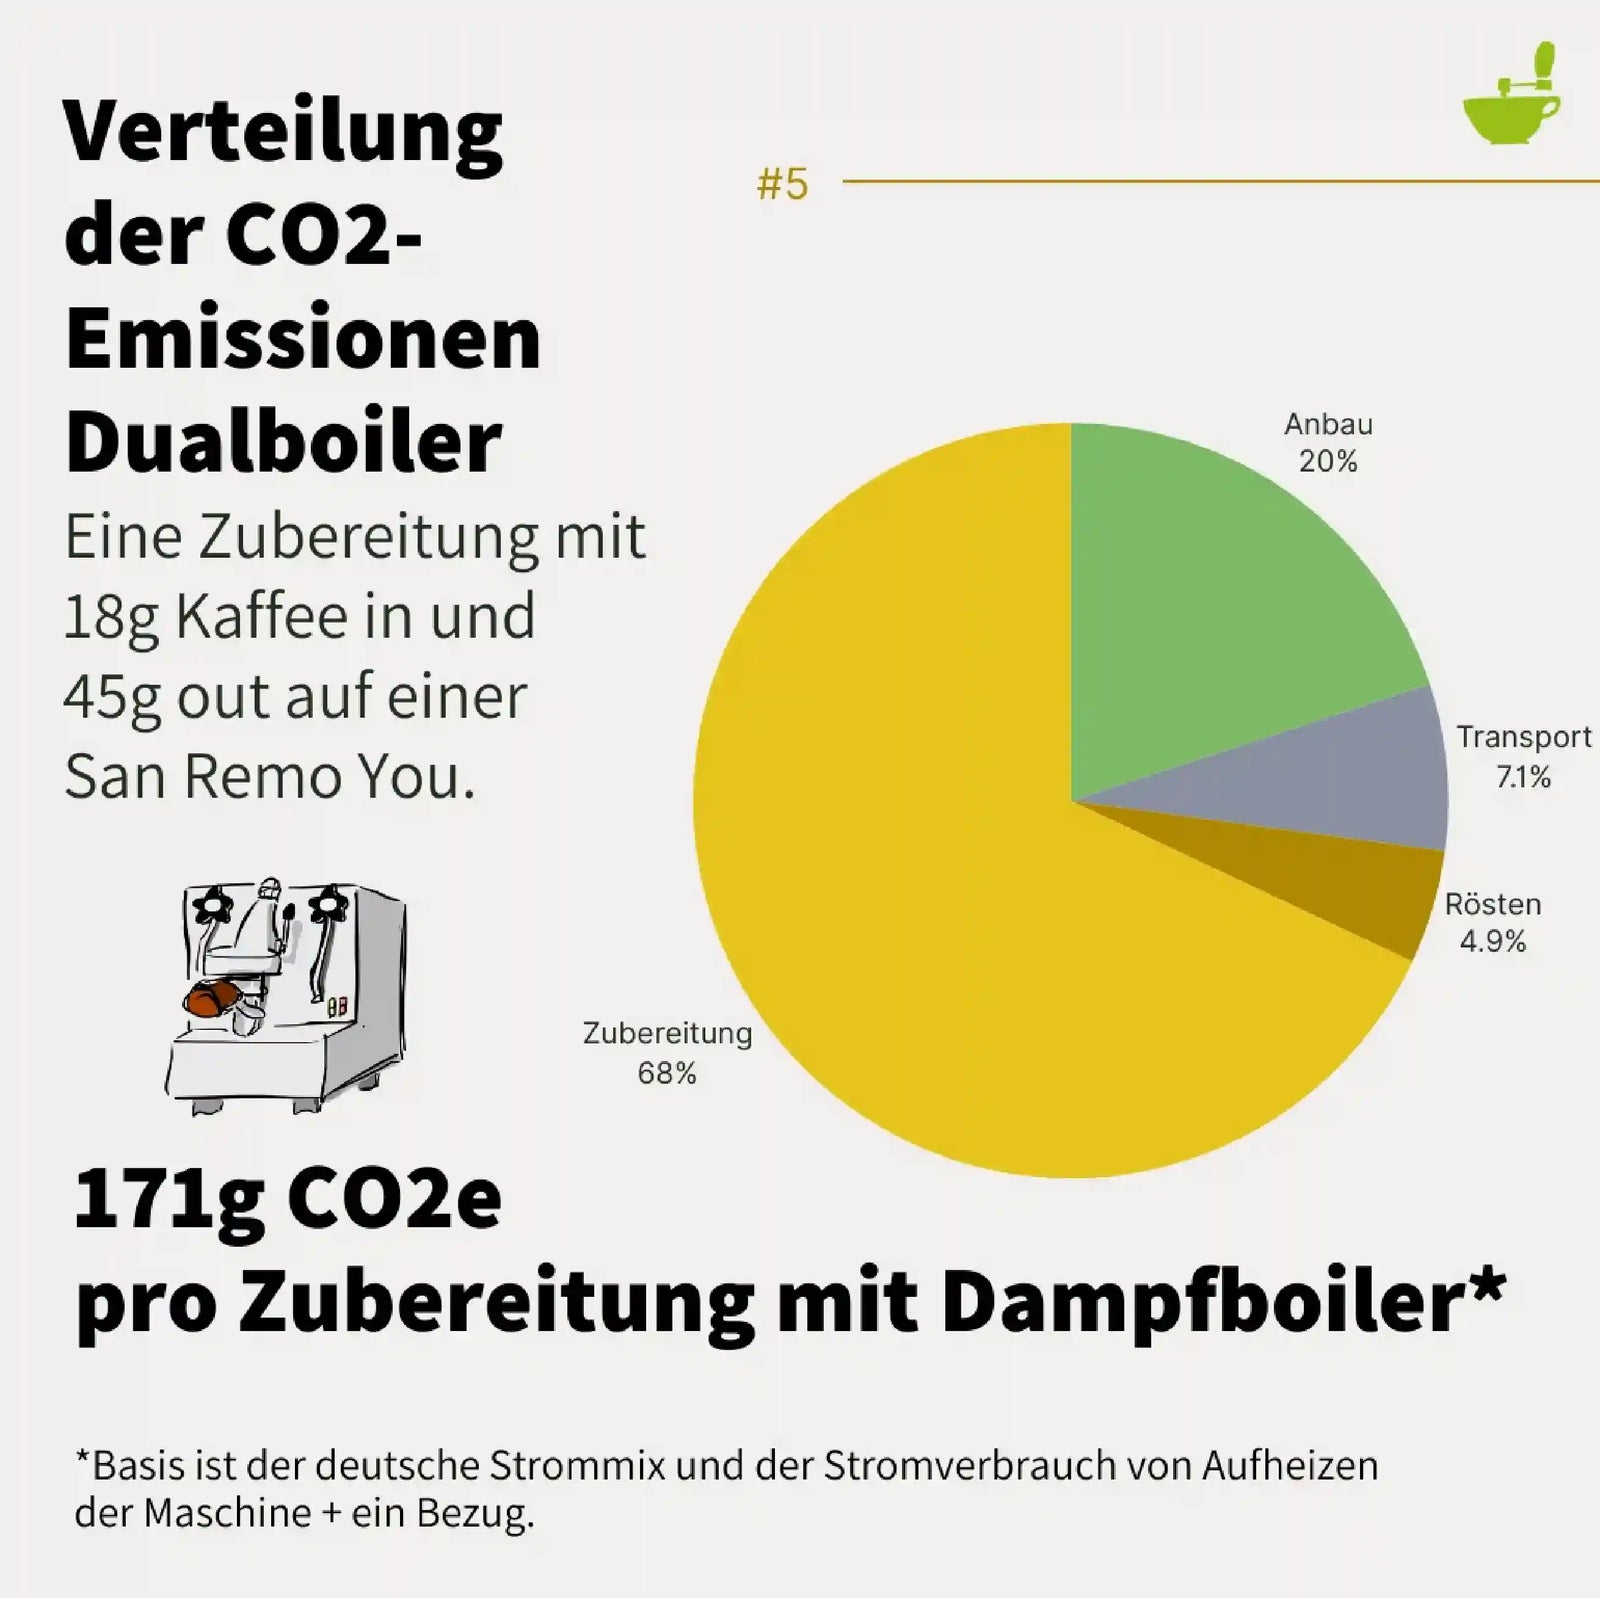
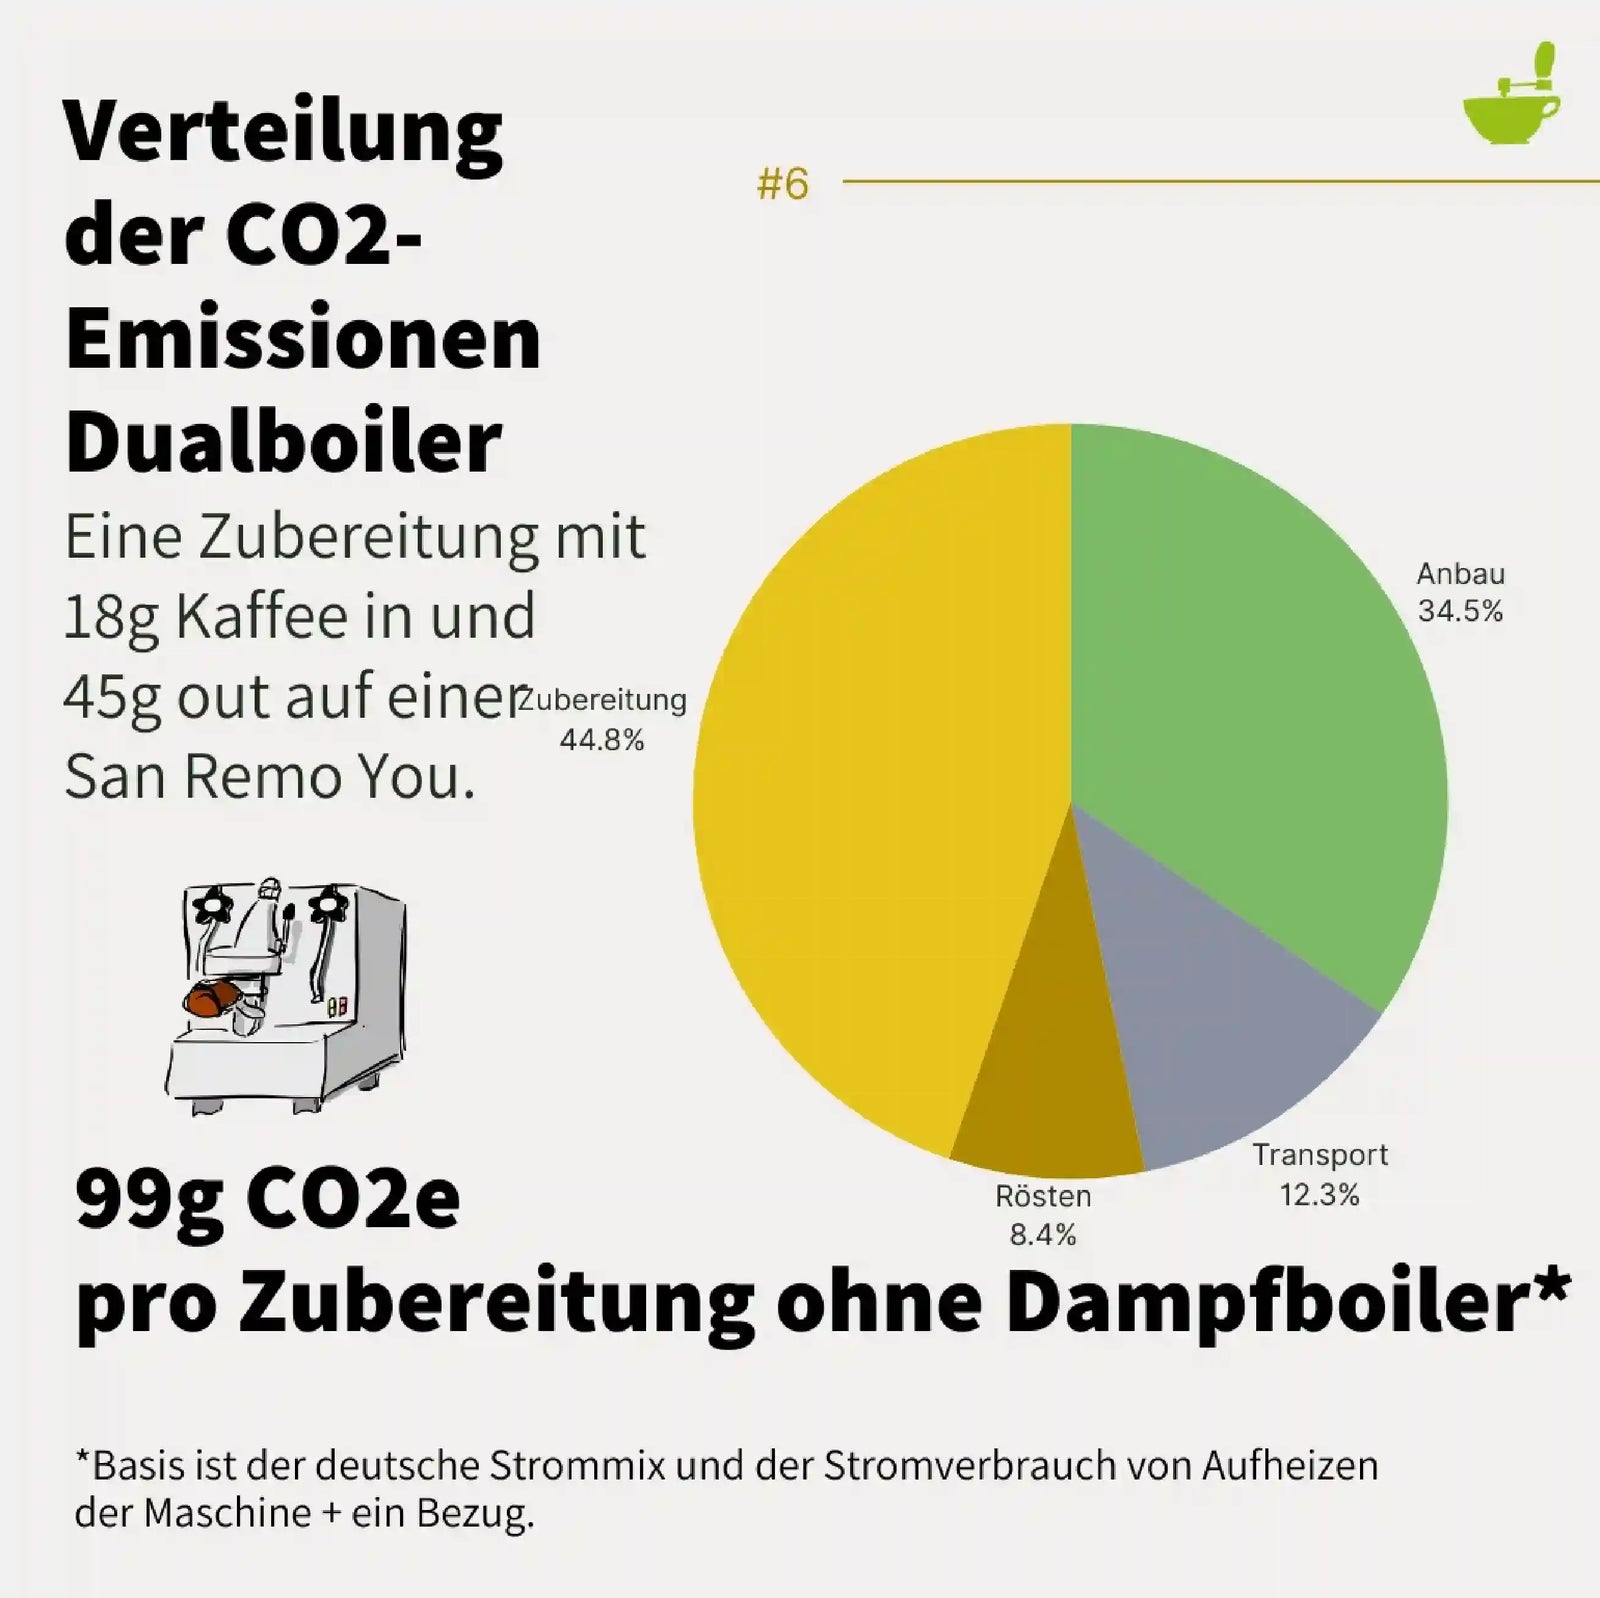
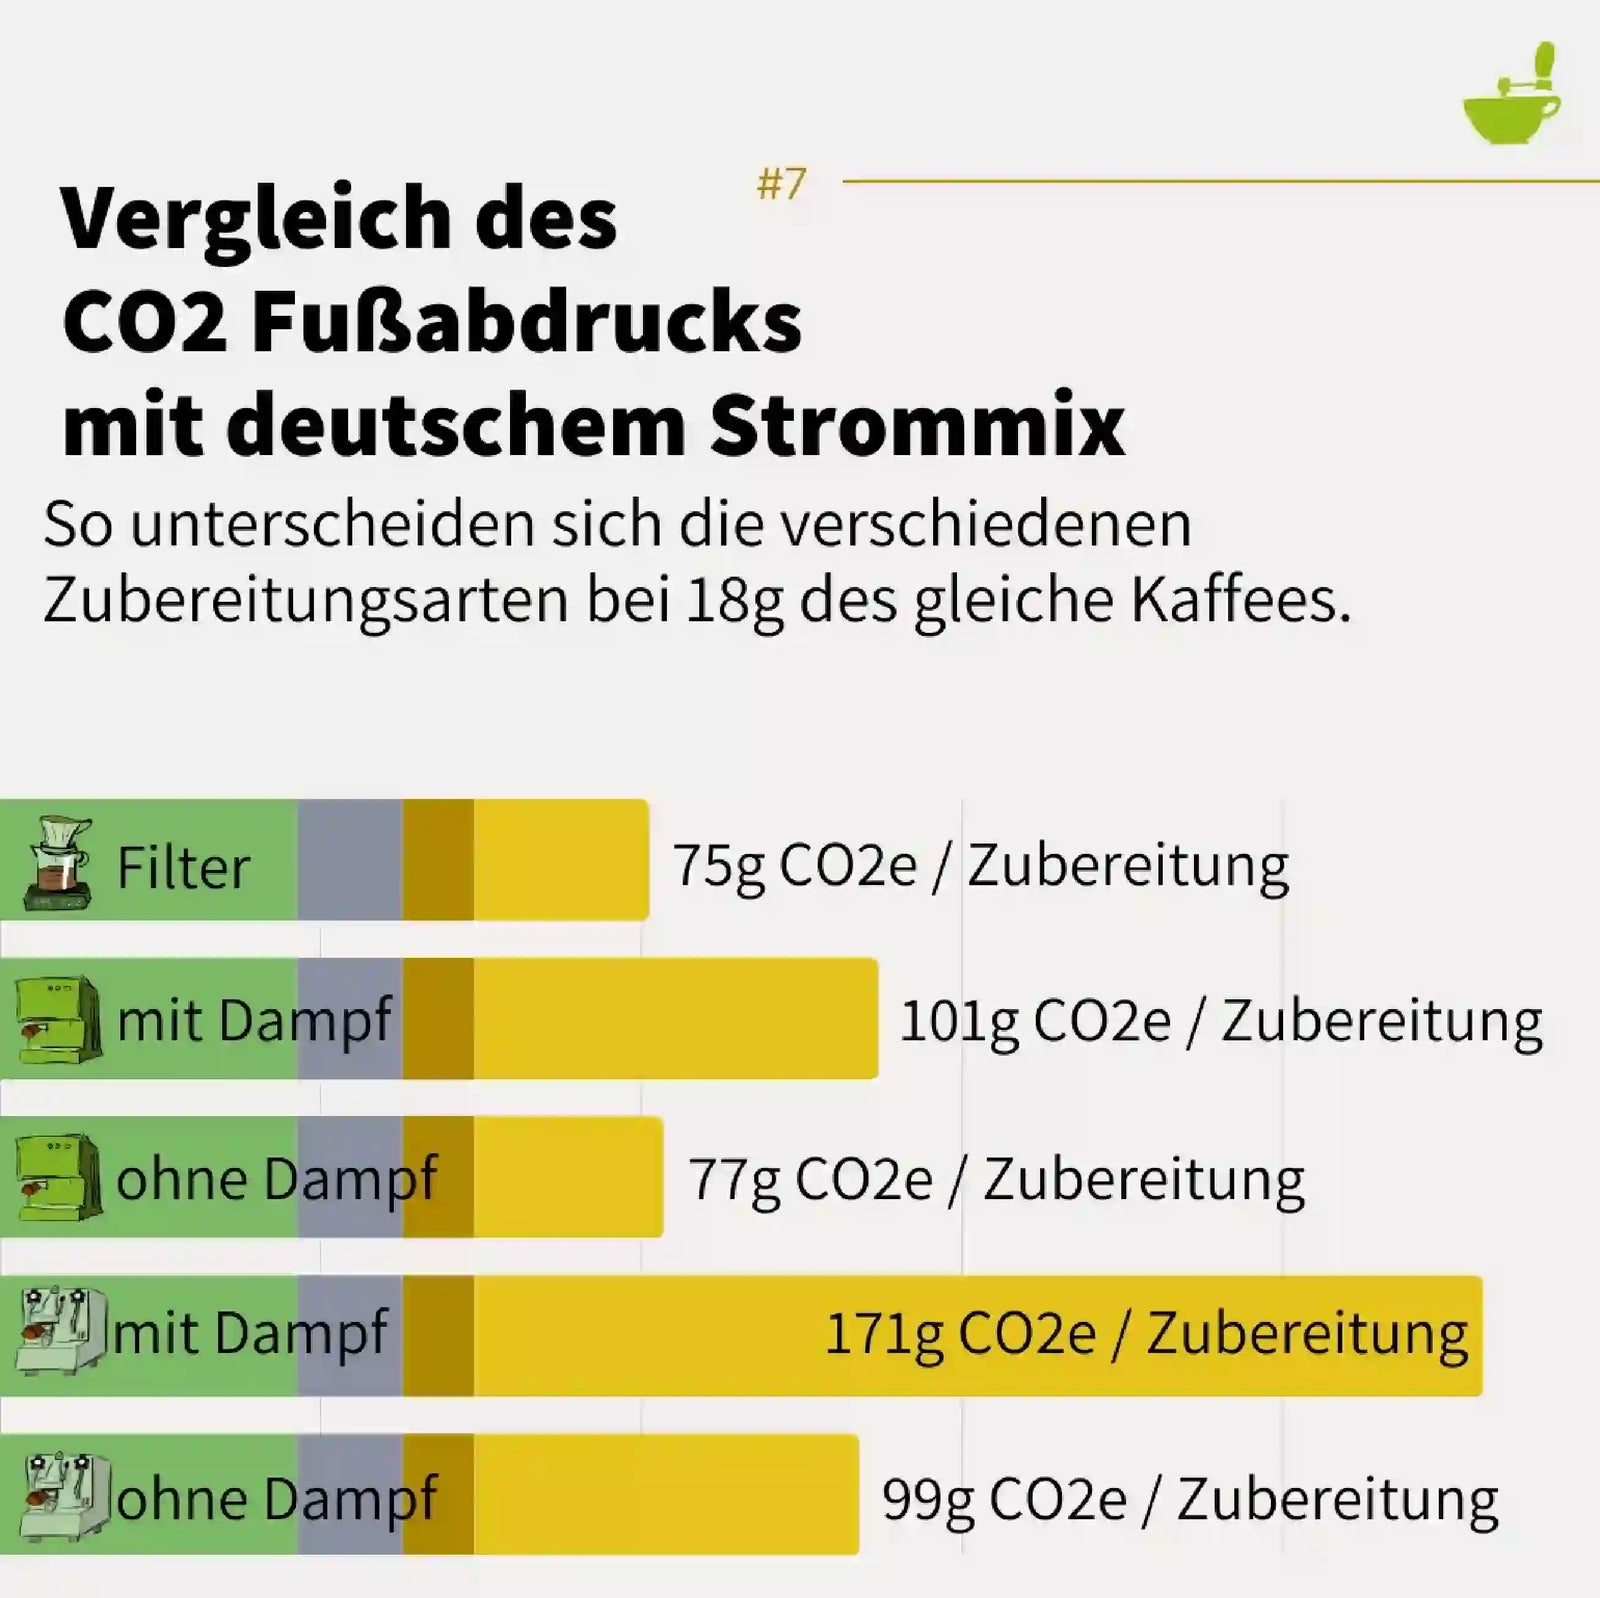
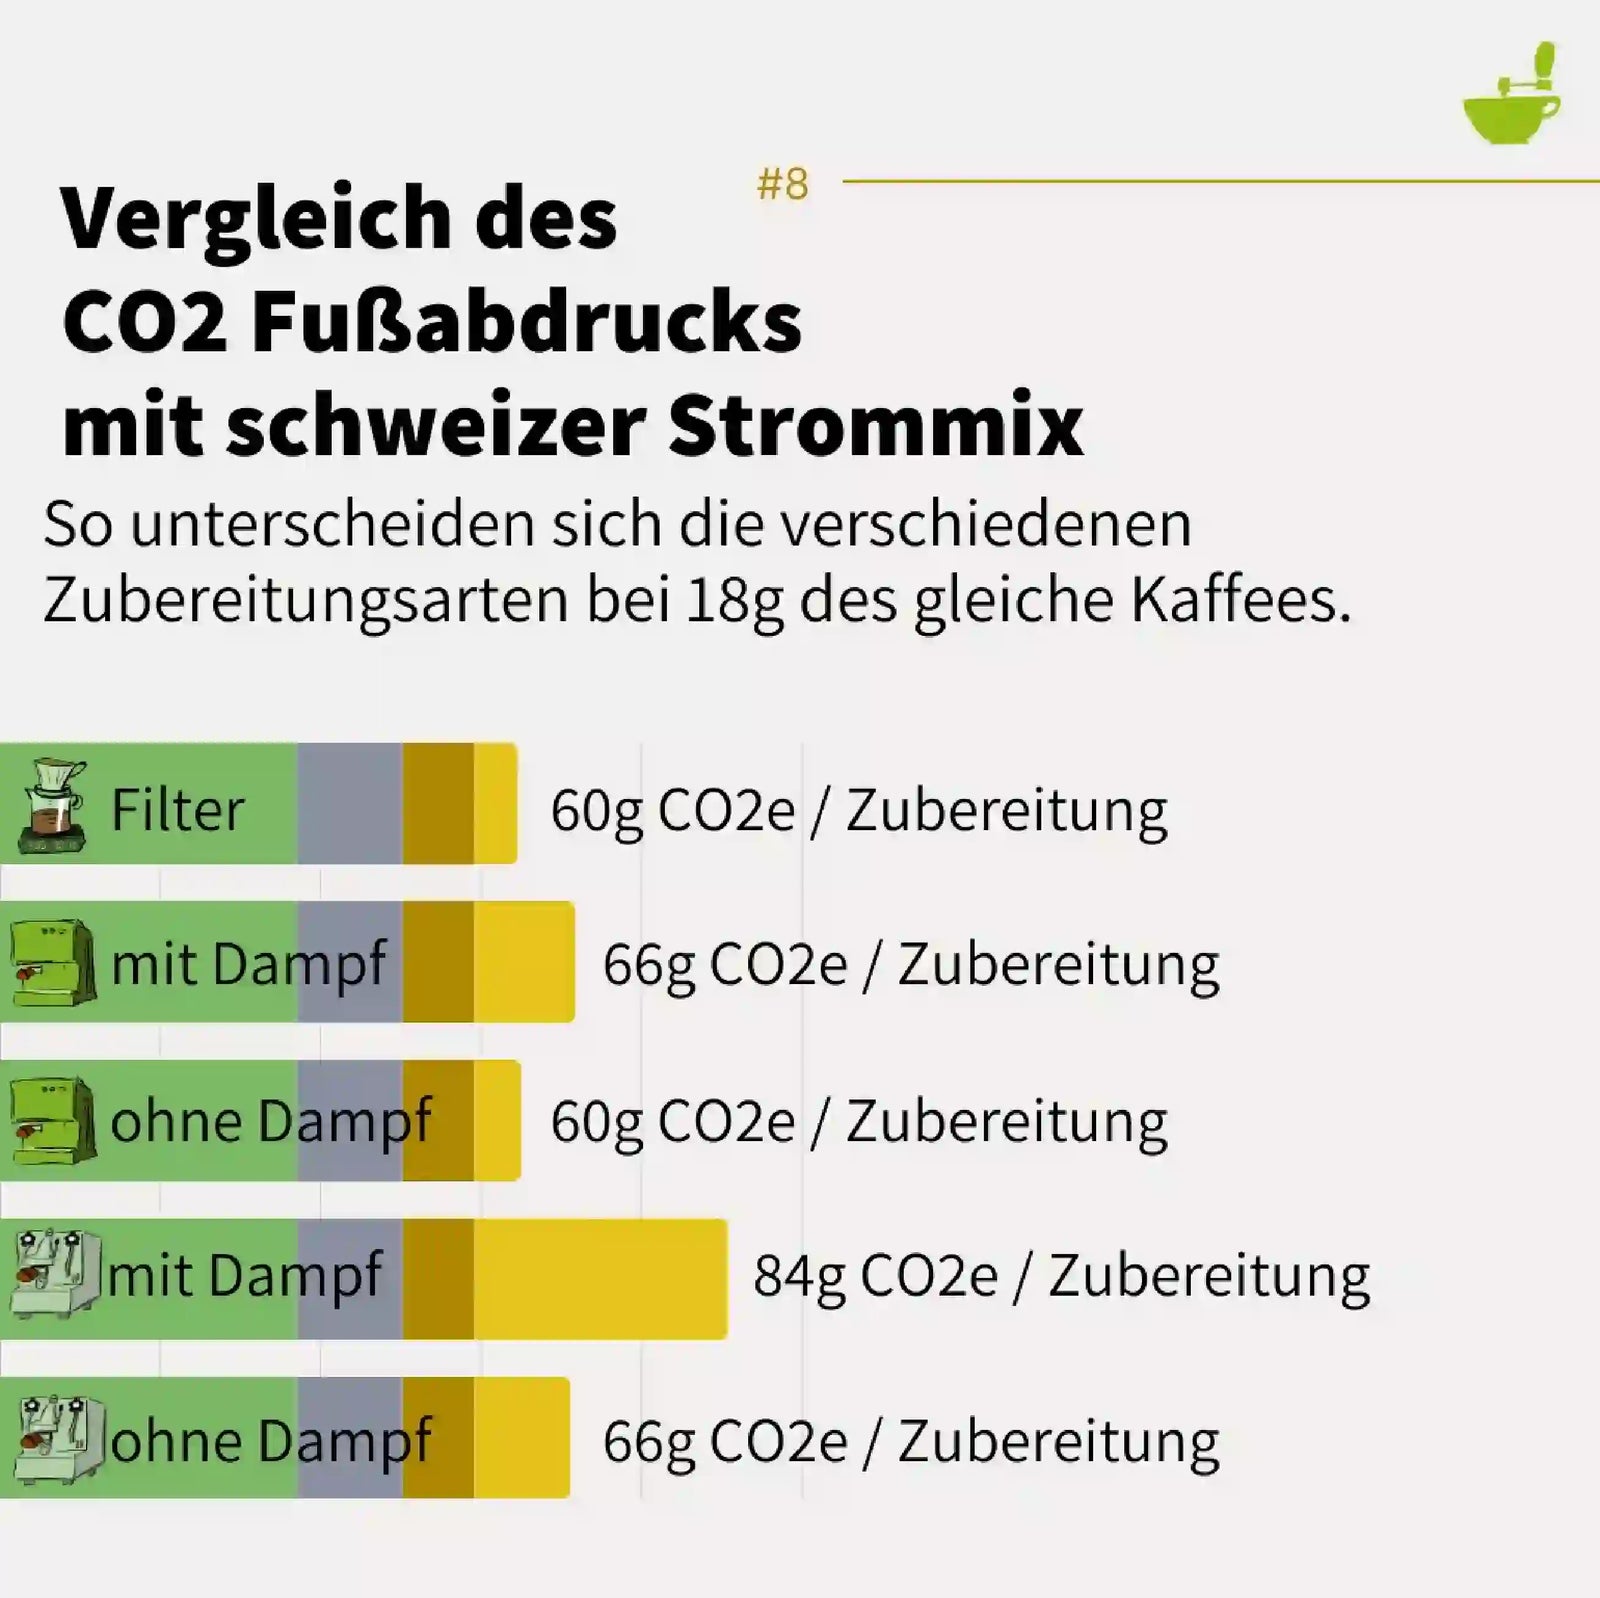
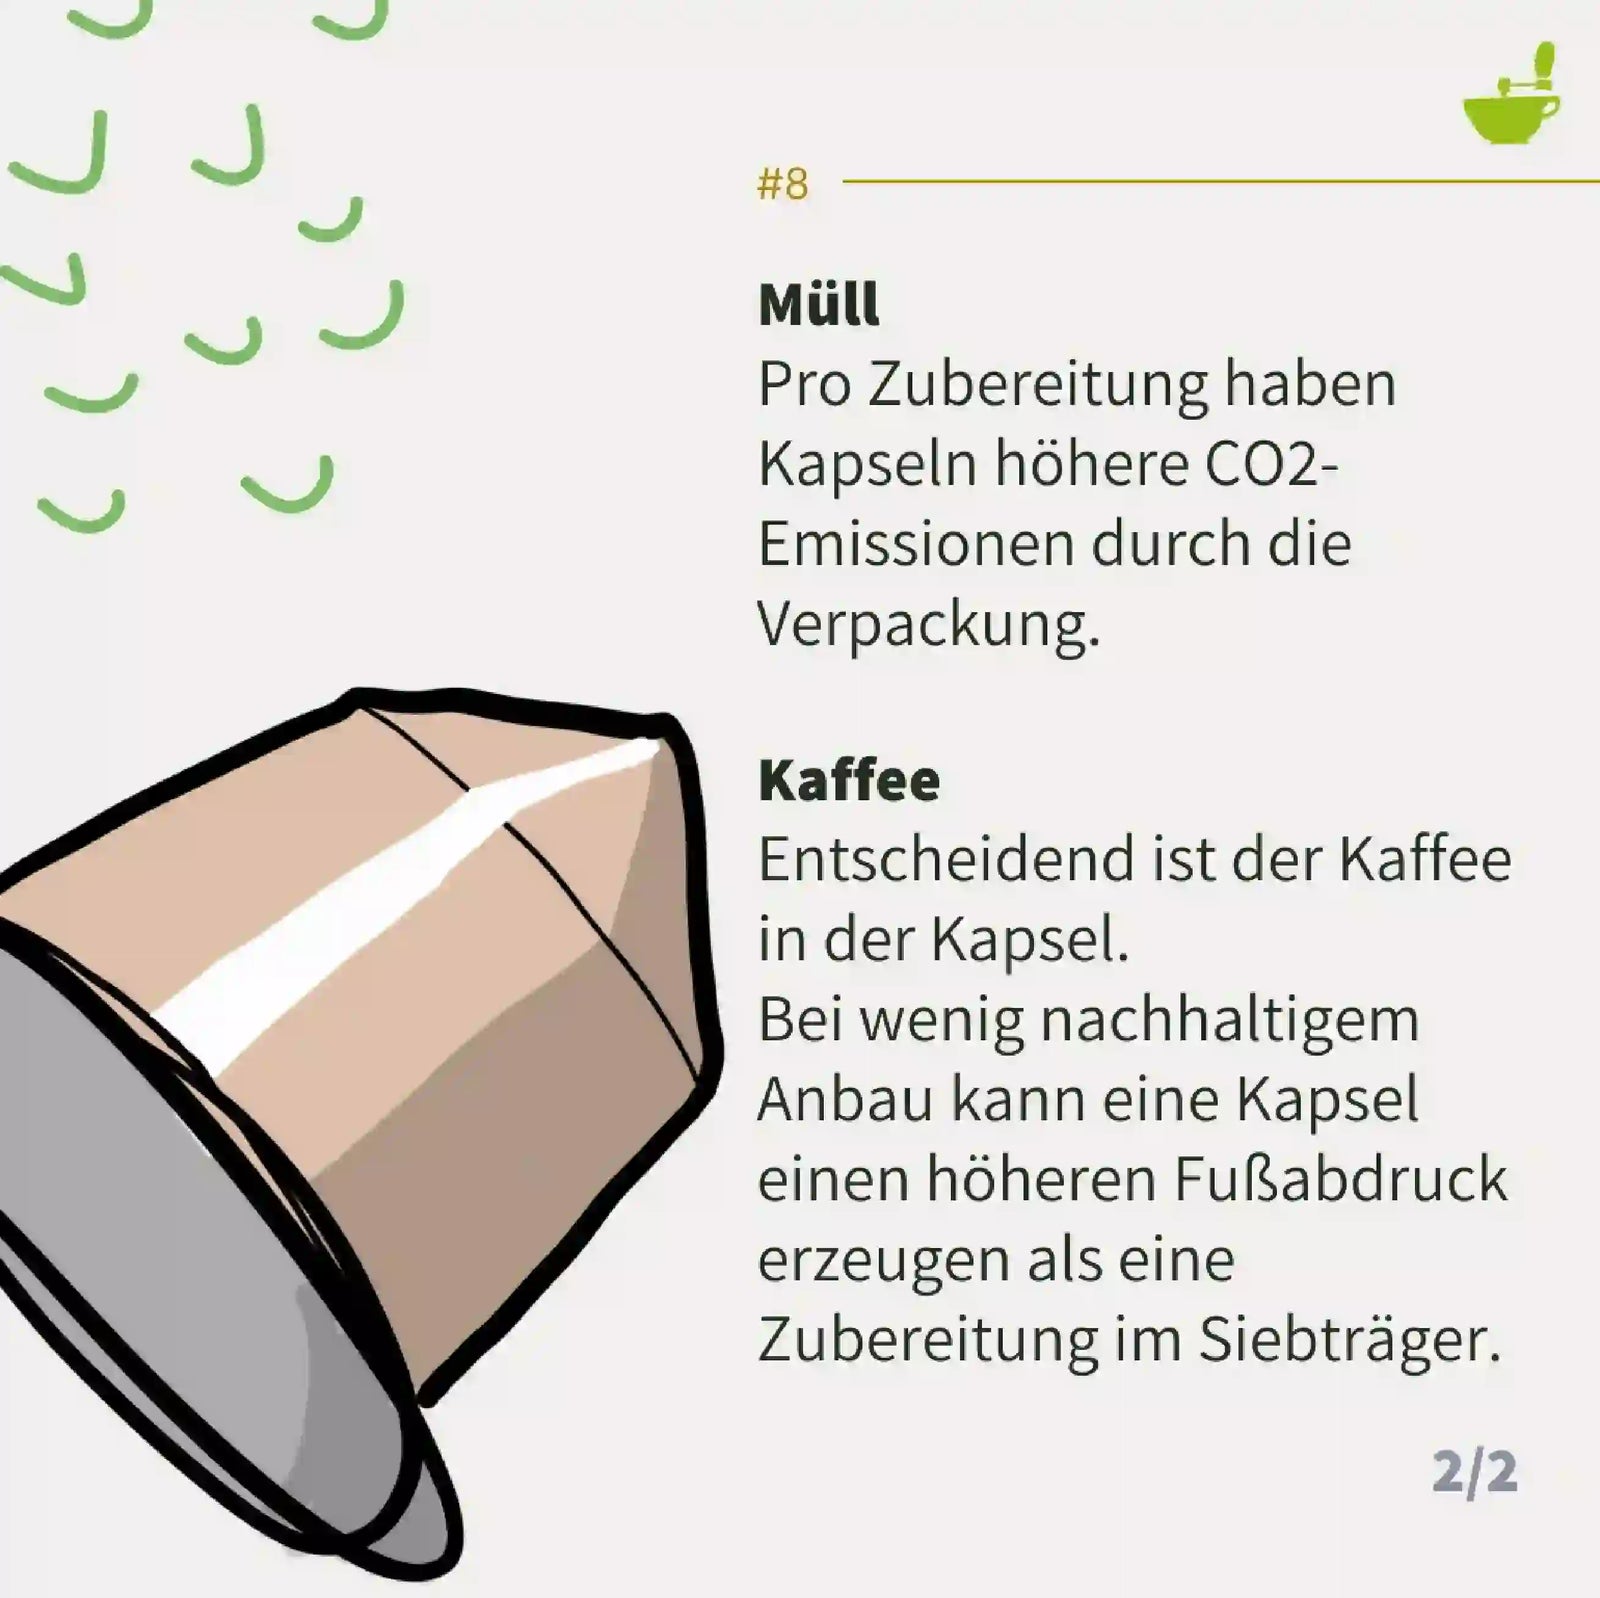
Are coffee capsules sustainable?
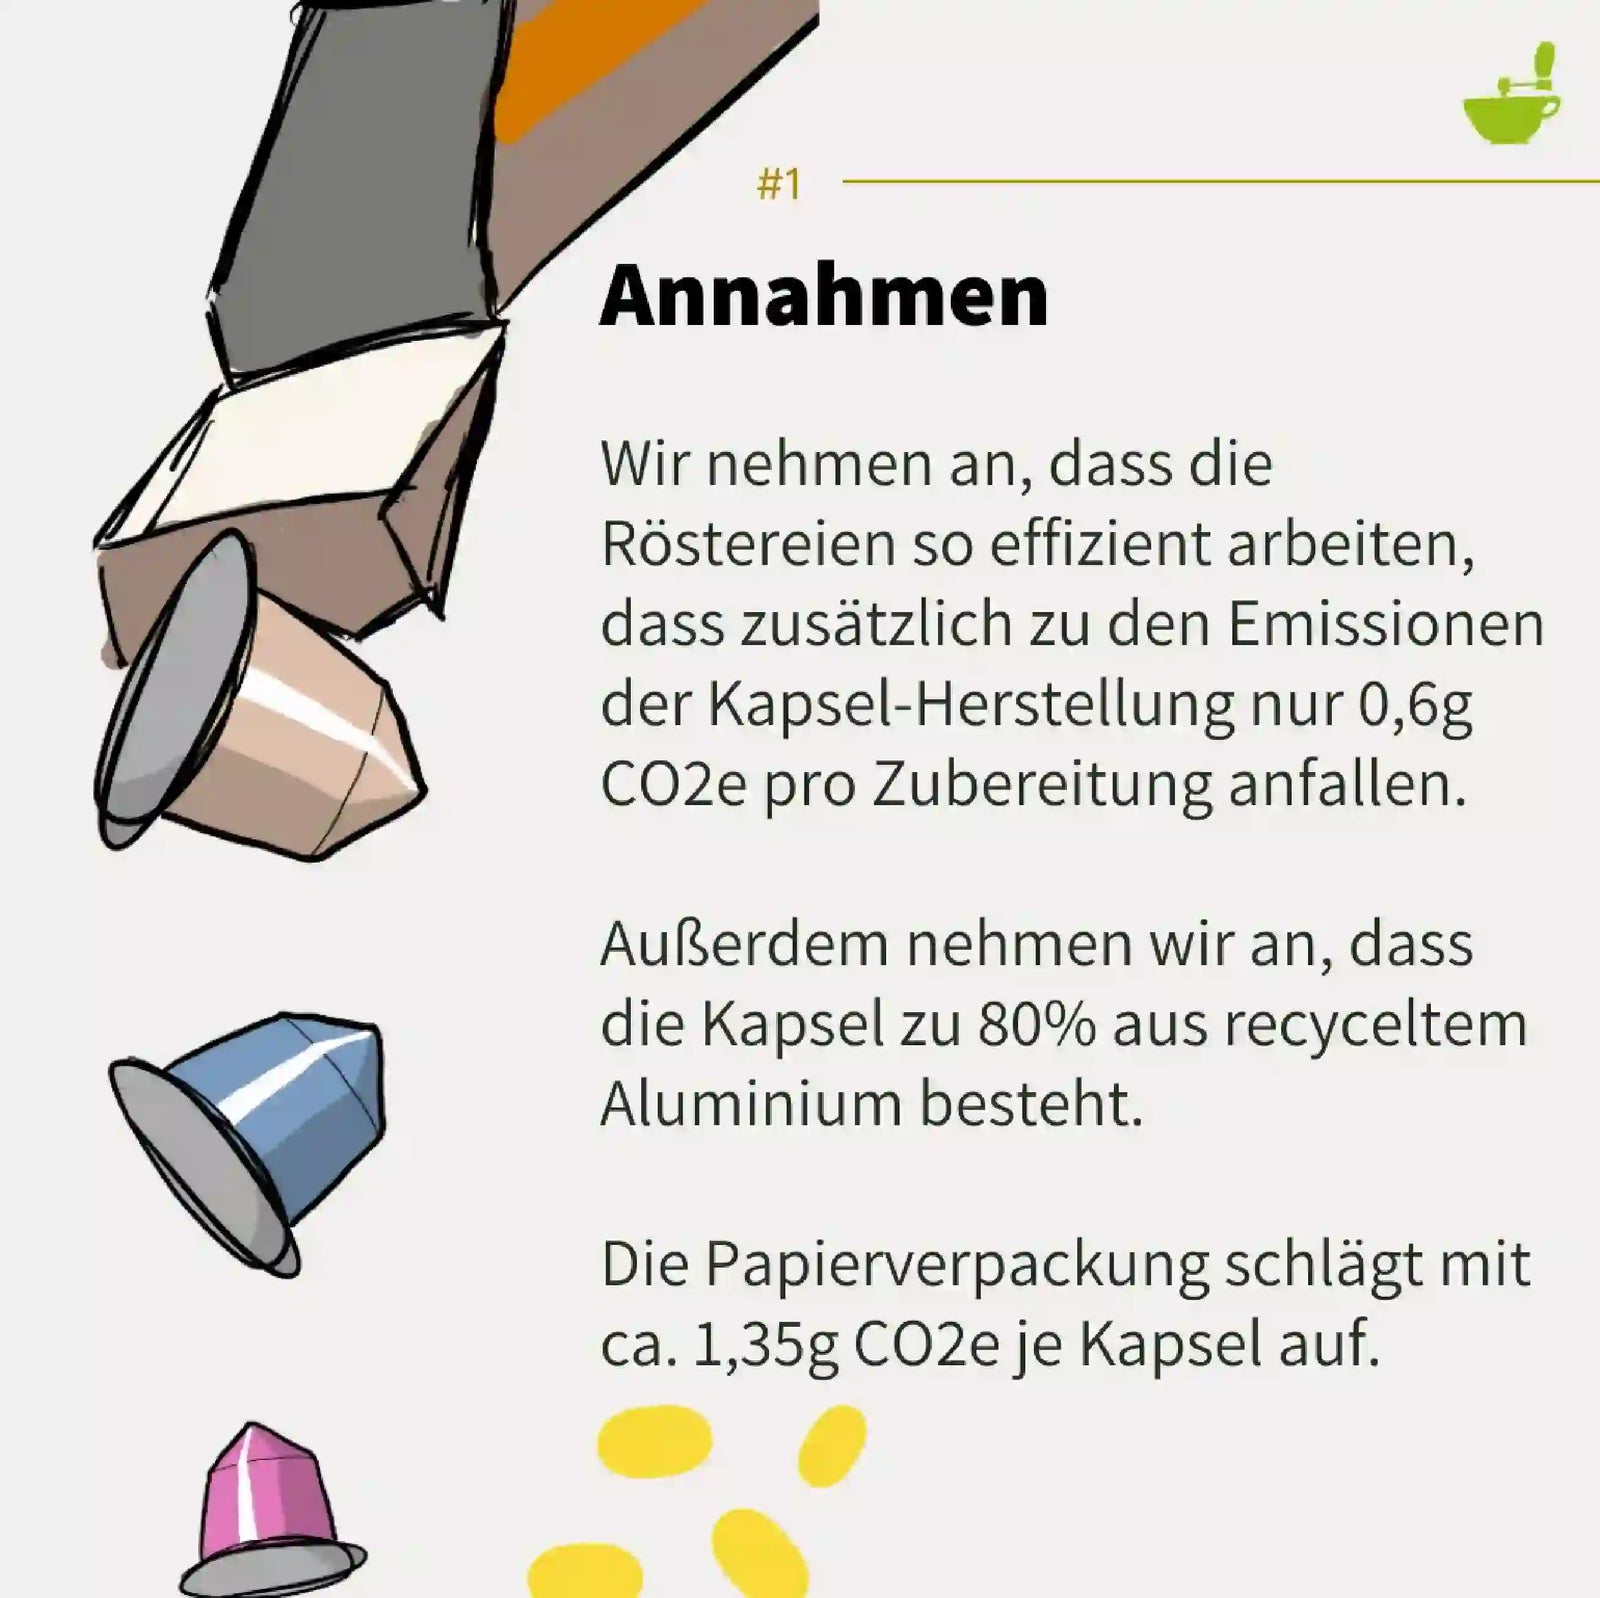
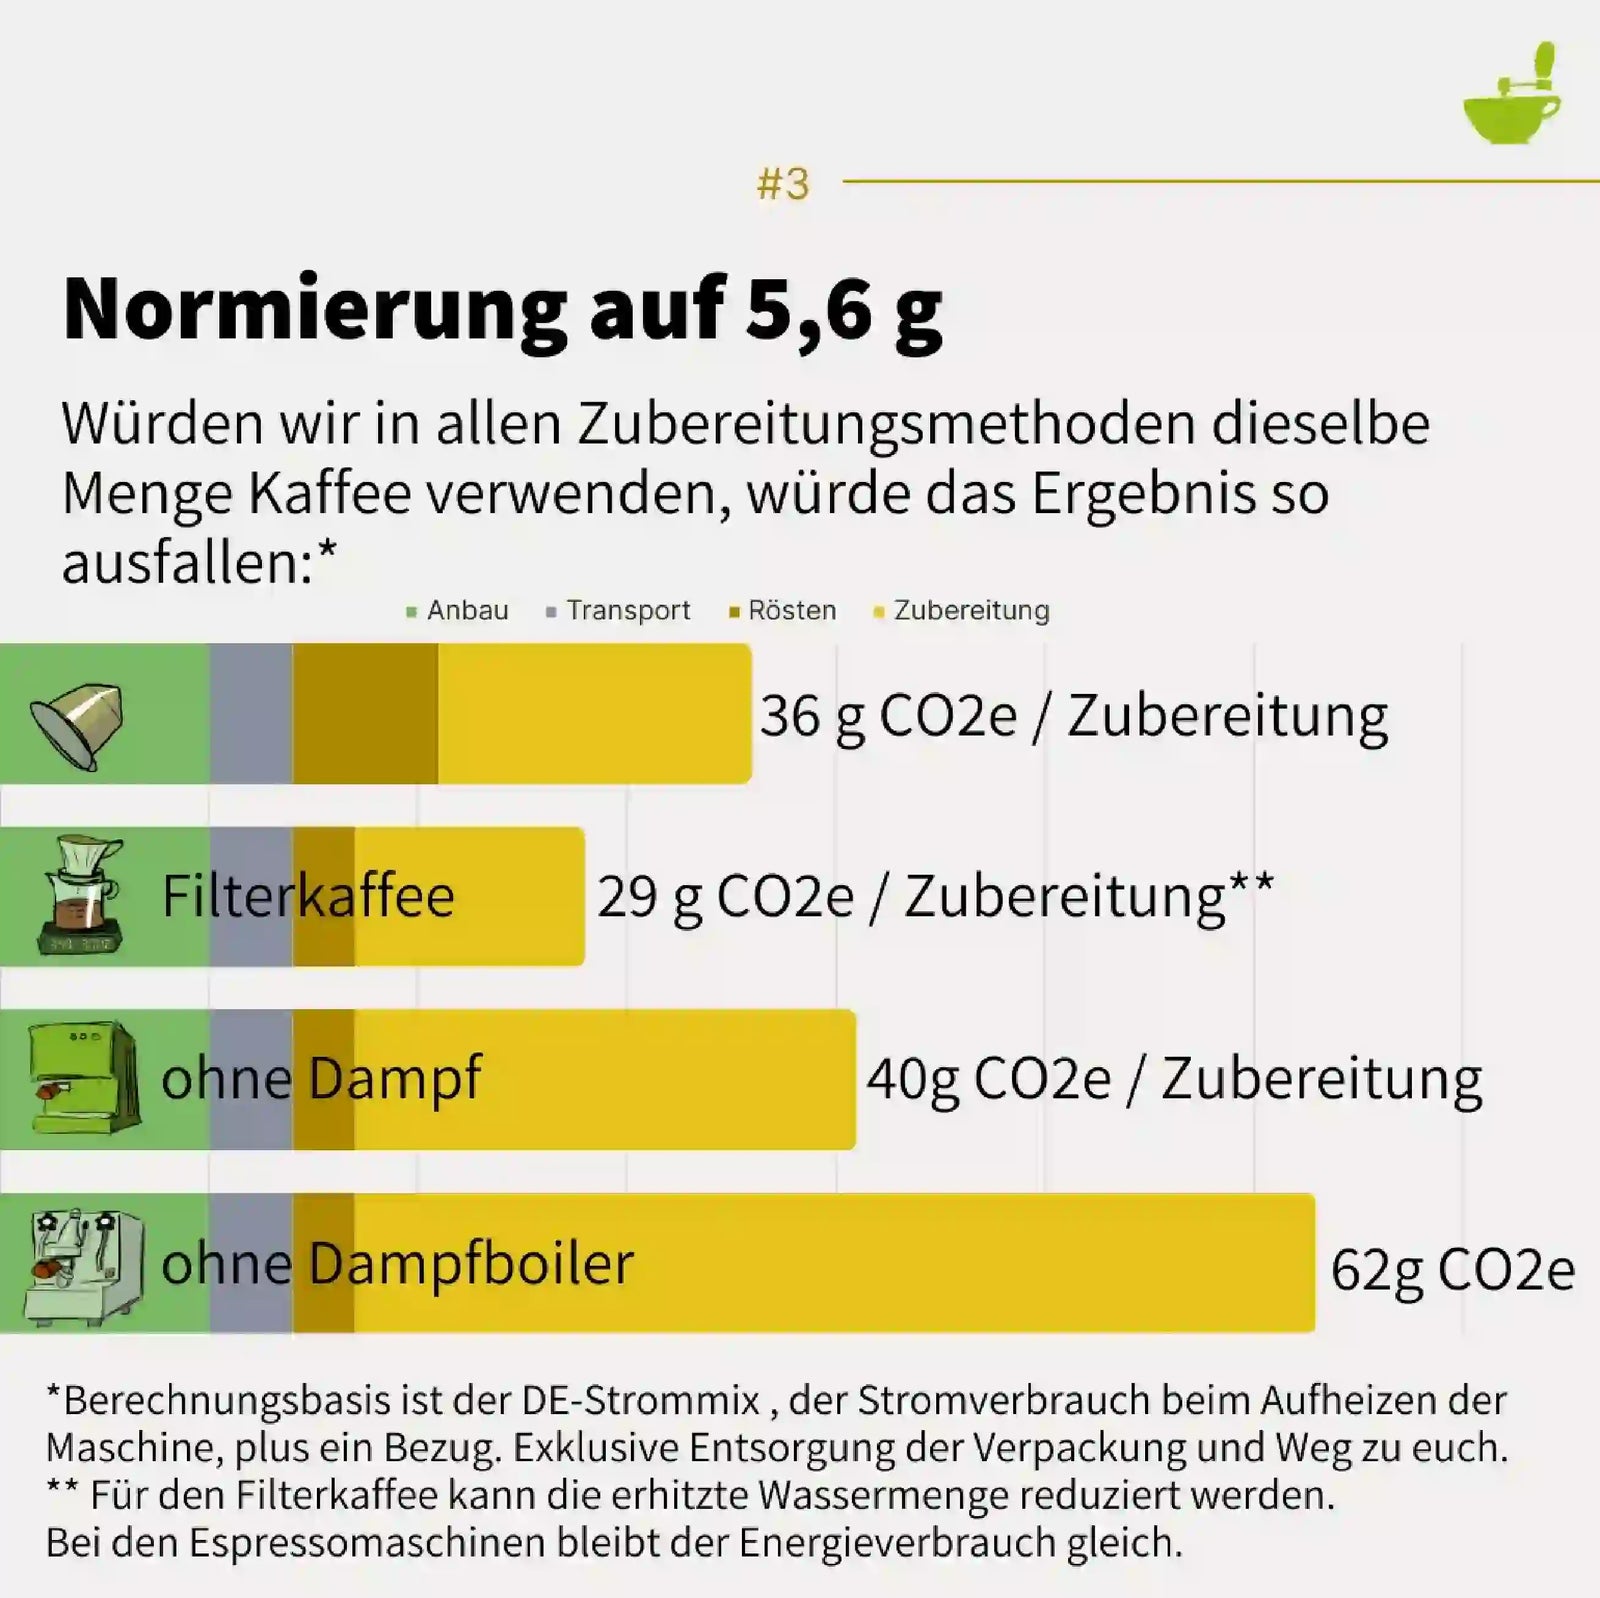
A discussion often conducted with passion. How do coffee capsules fare? The basis of our assessment is a preparation method: a double espresso from a portafilter machine, 280 ml of filter coffee, or a beverage from a capsule.
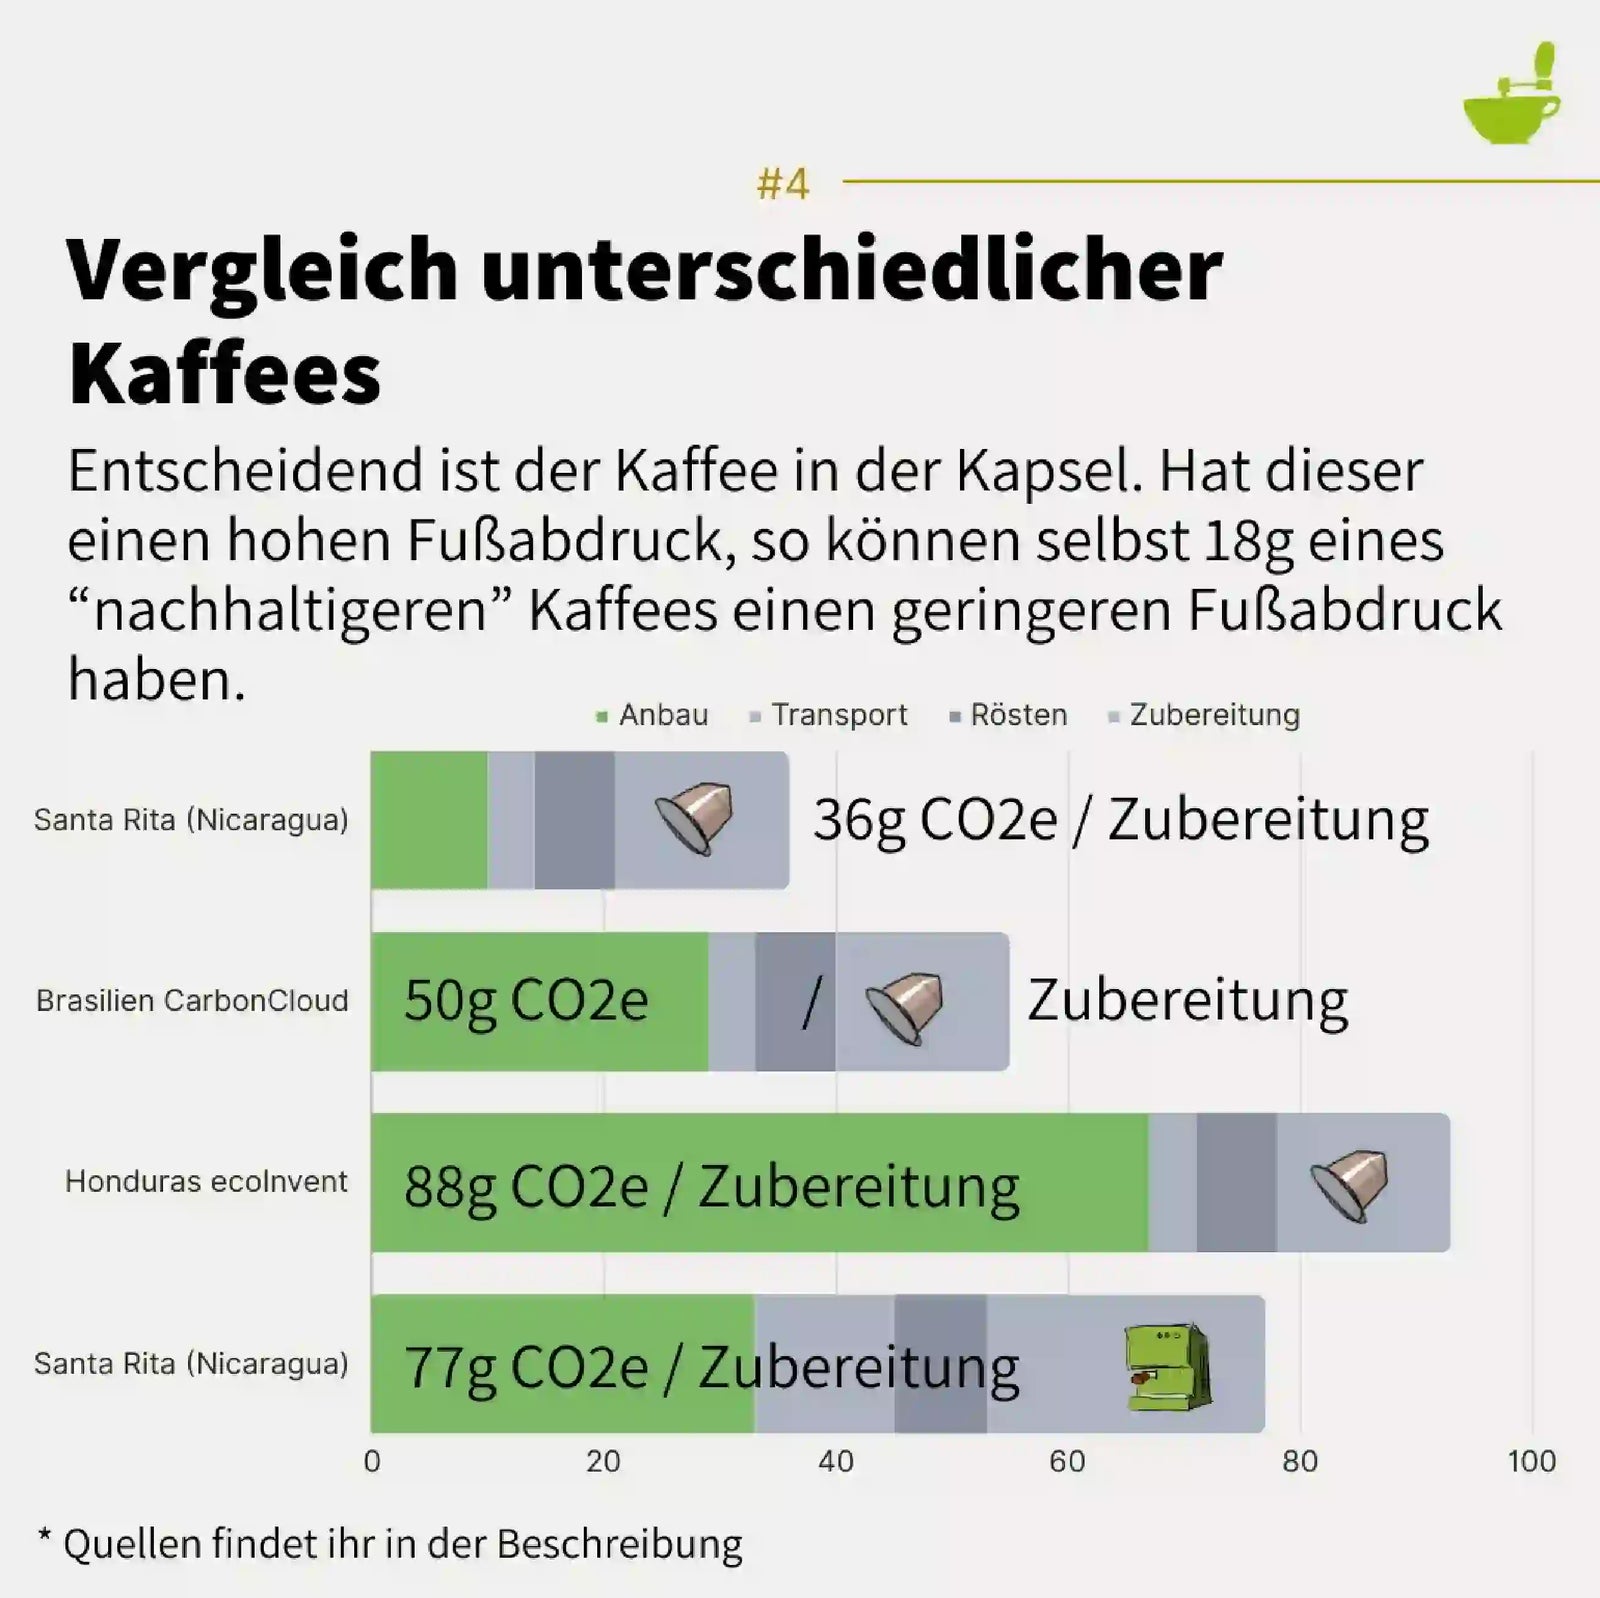
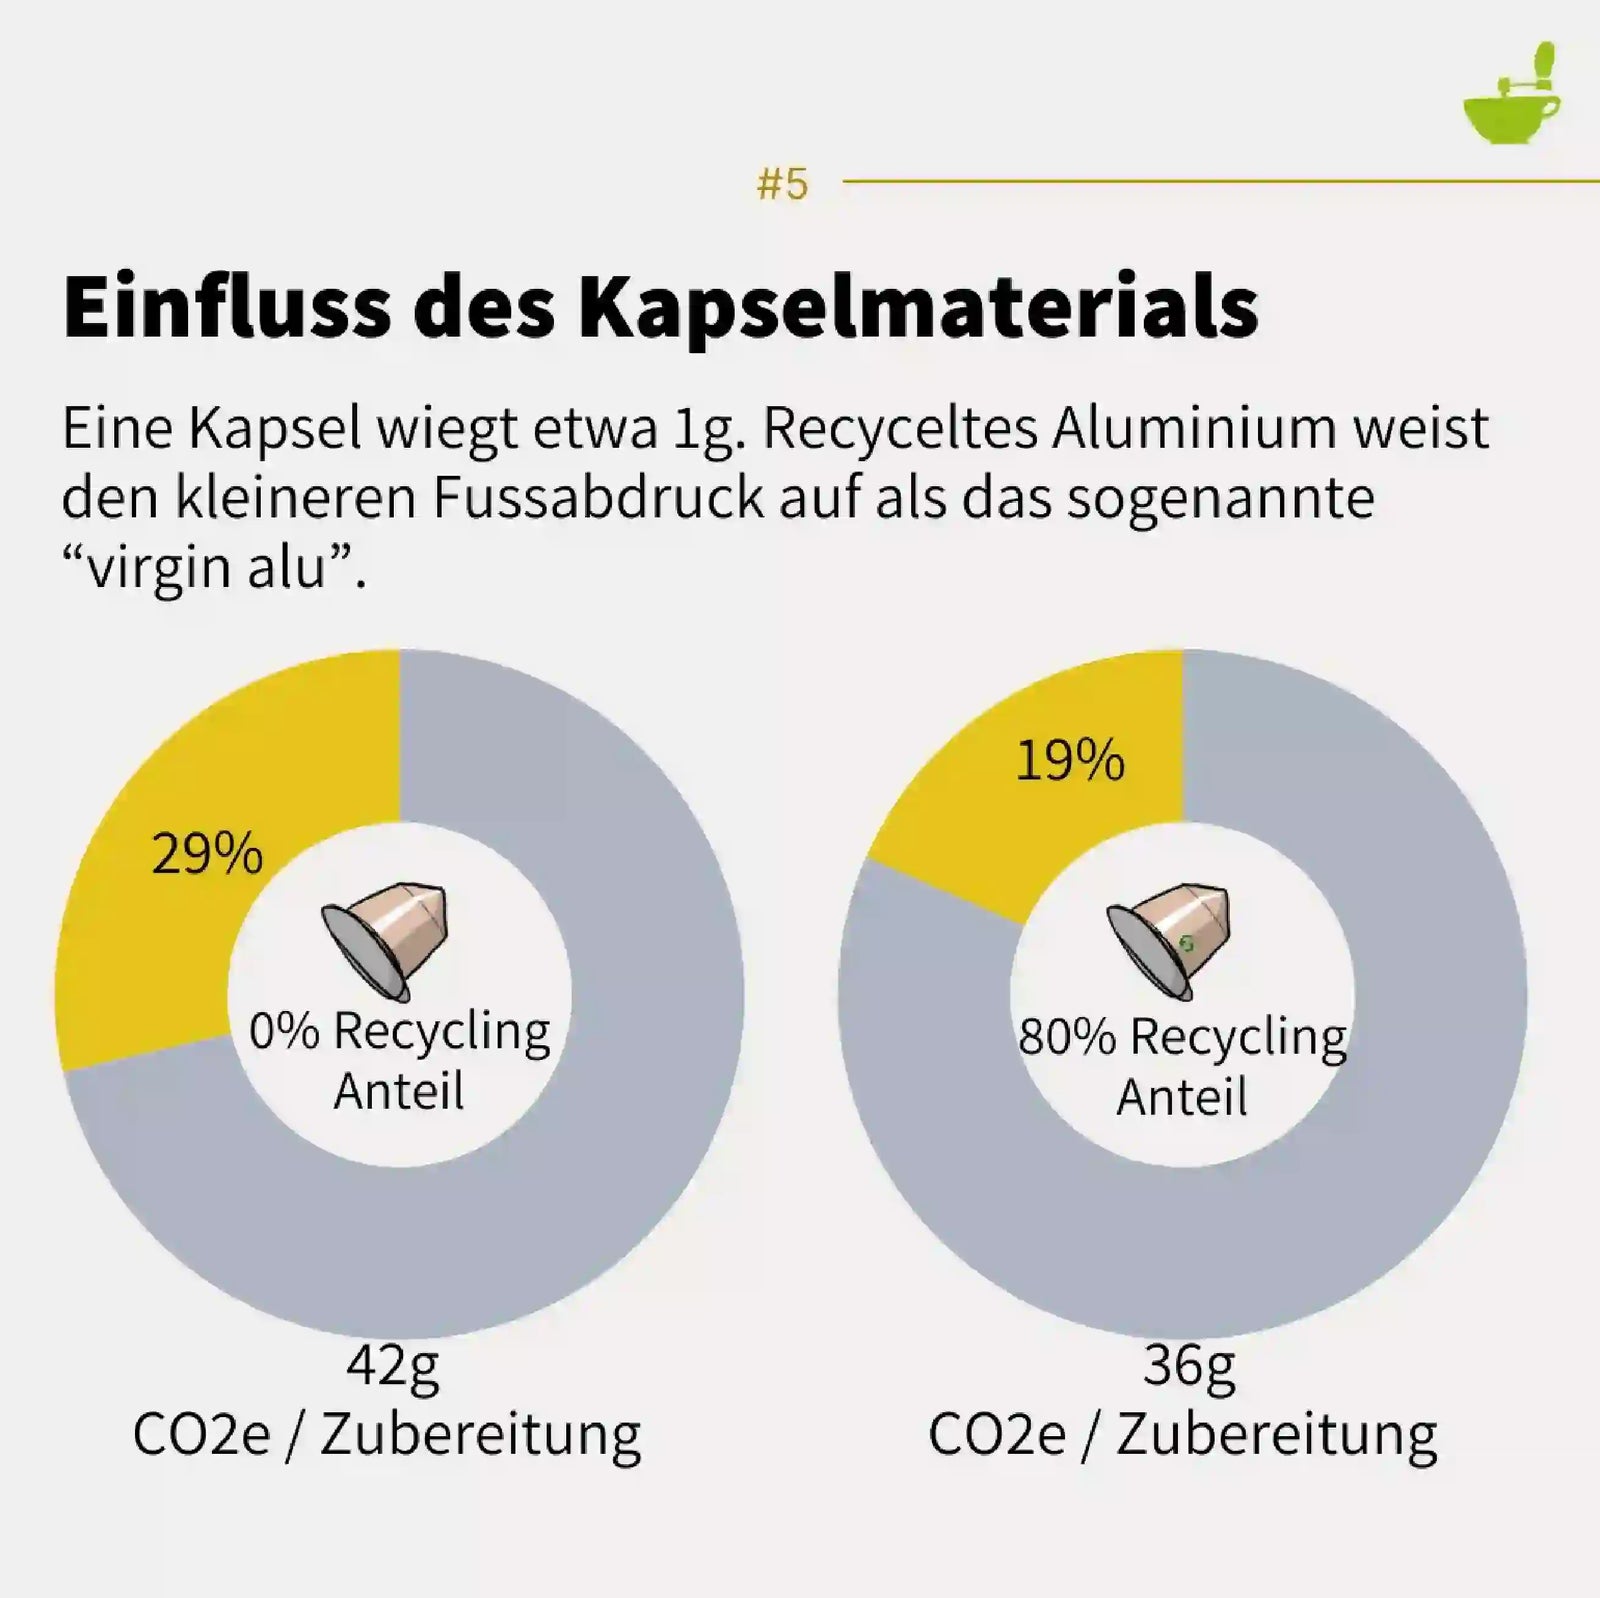
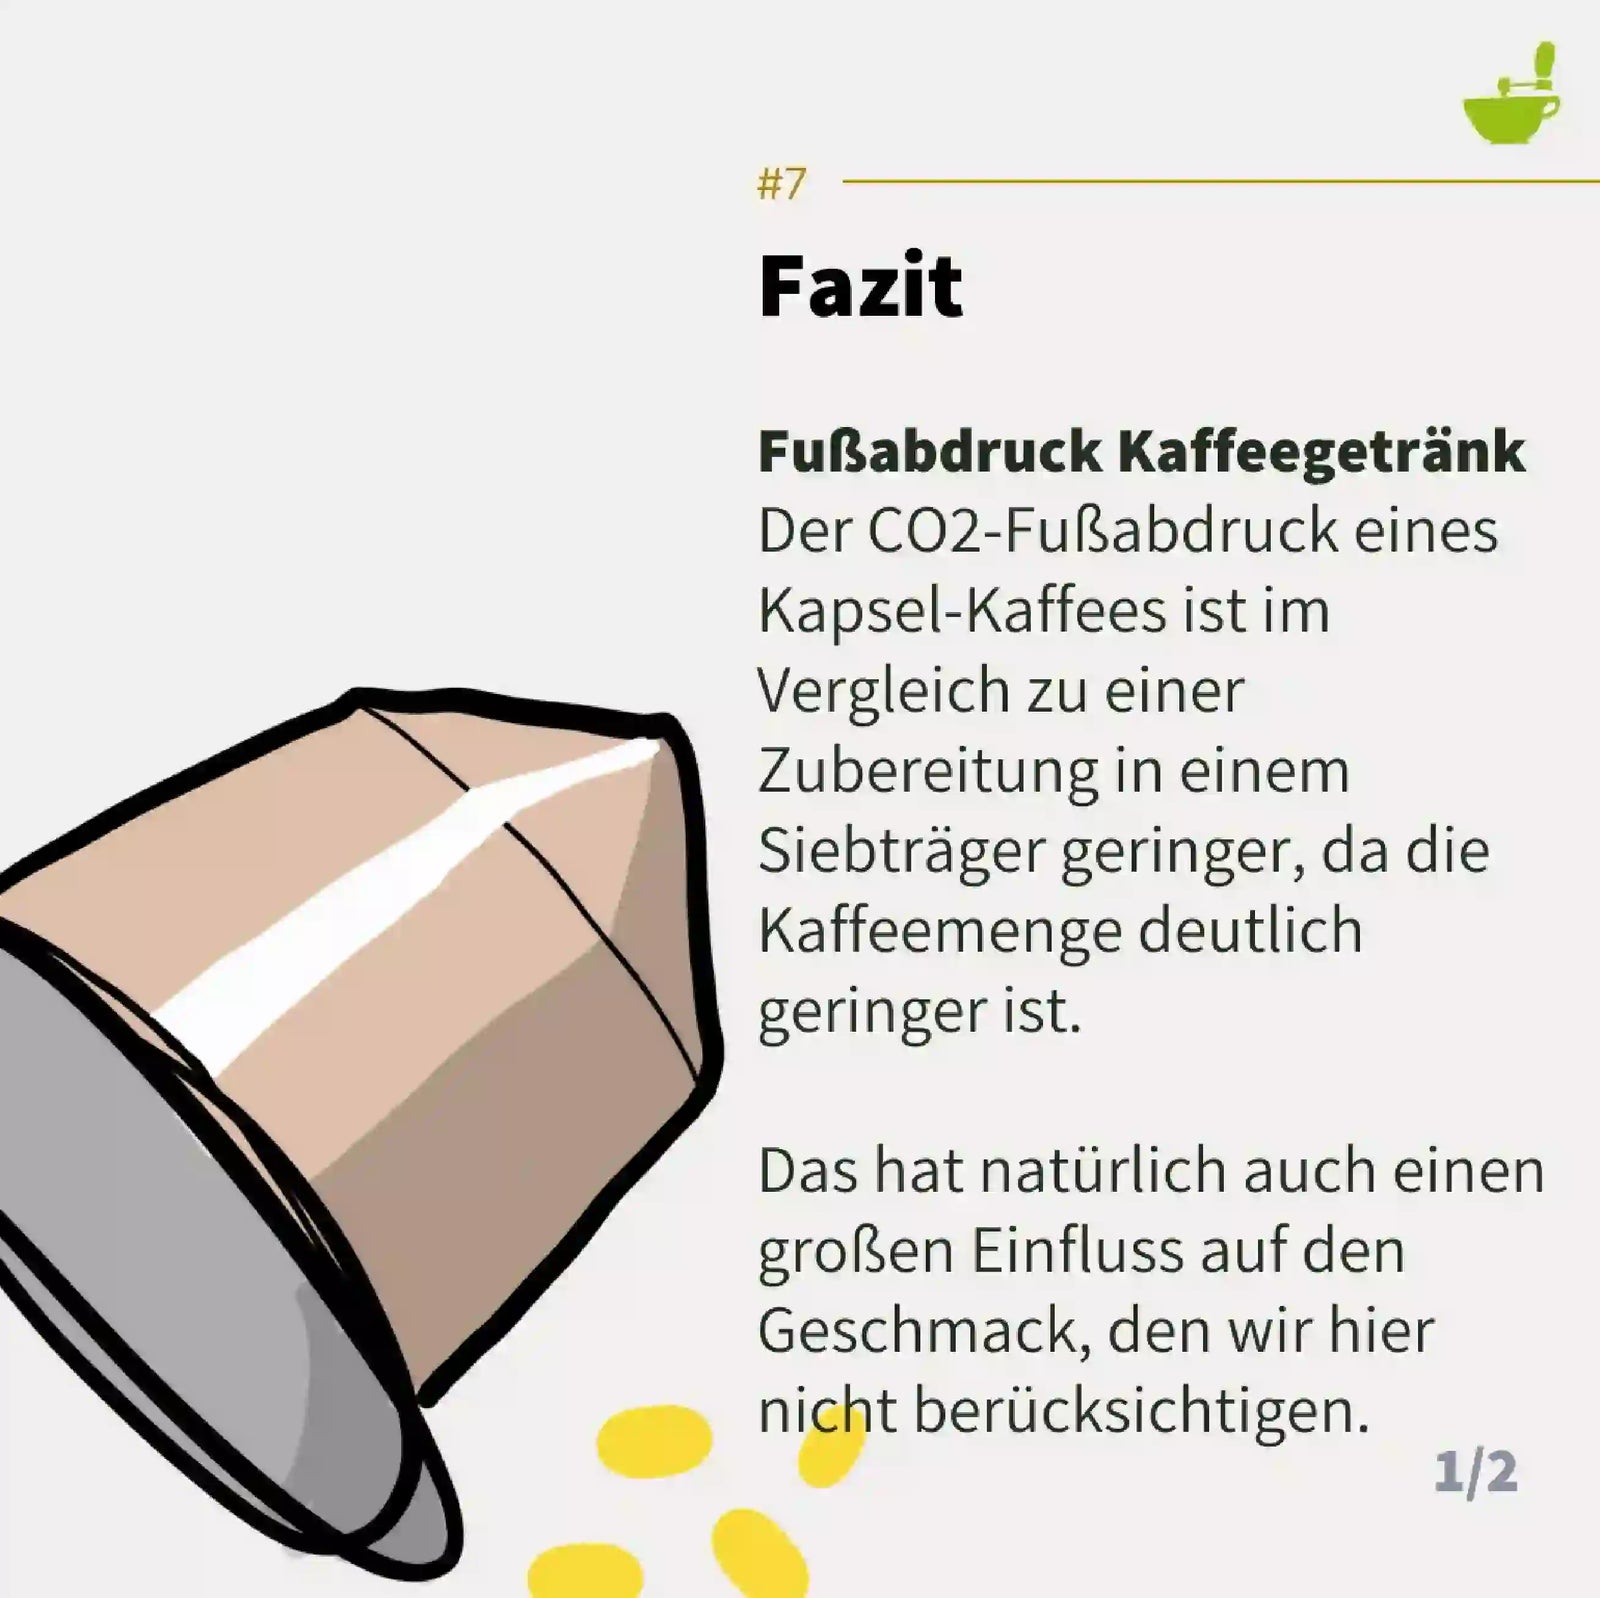
Preparation from a capsule performs better than the other methods. This is because of the small amount of coffee needed for one preparation. This only applies, however, if the same coffee is used for each preparation method.
For capsules too, it's important to pay attention primarily to the coffee in them.
Will there still be coffee in 2050?
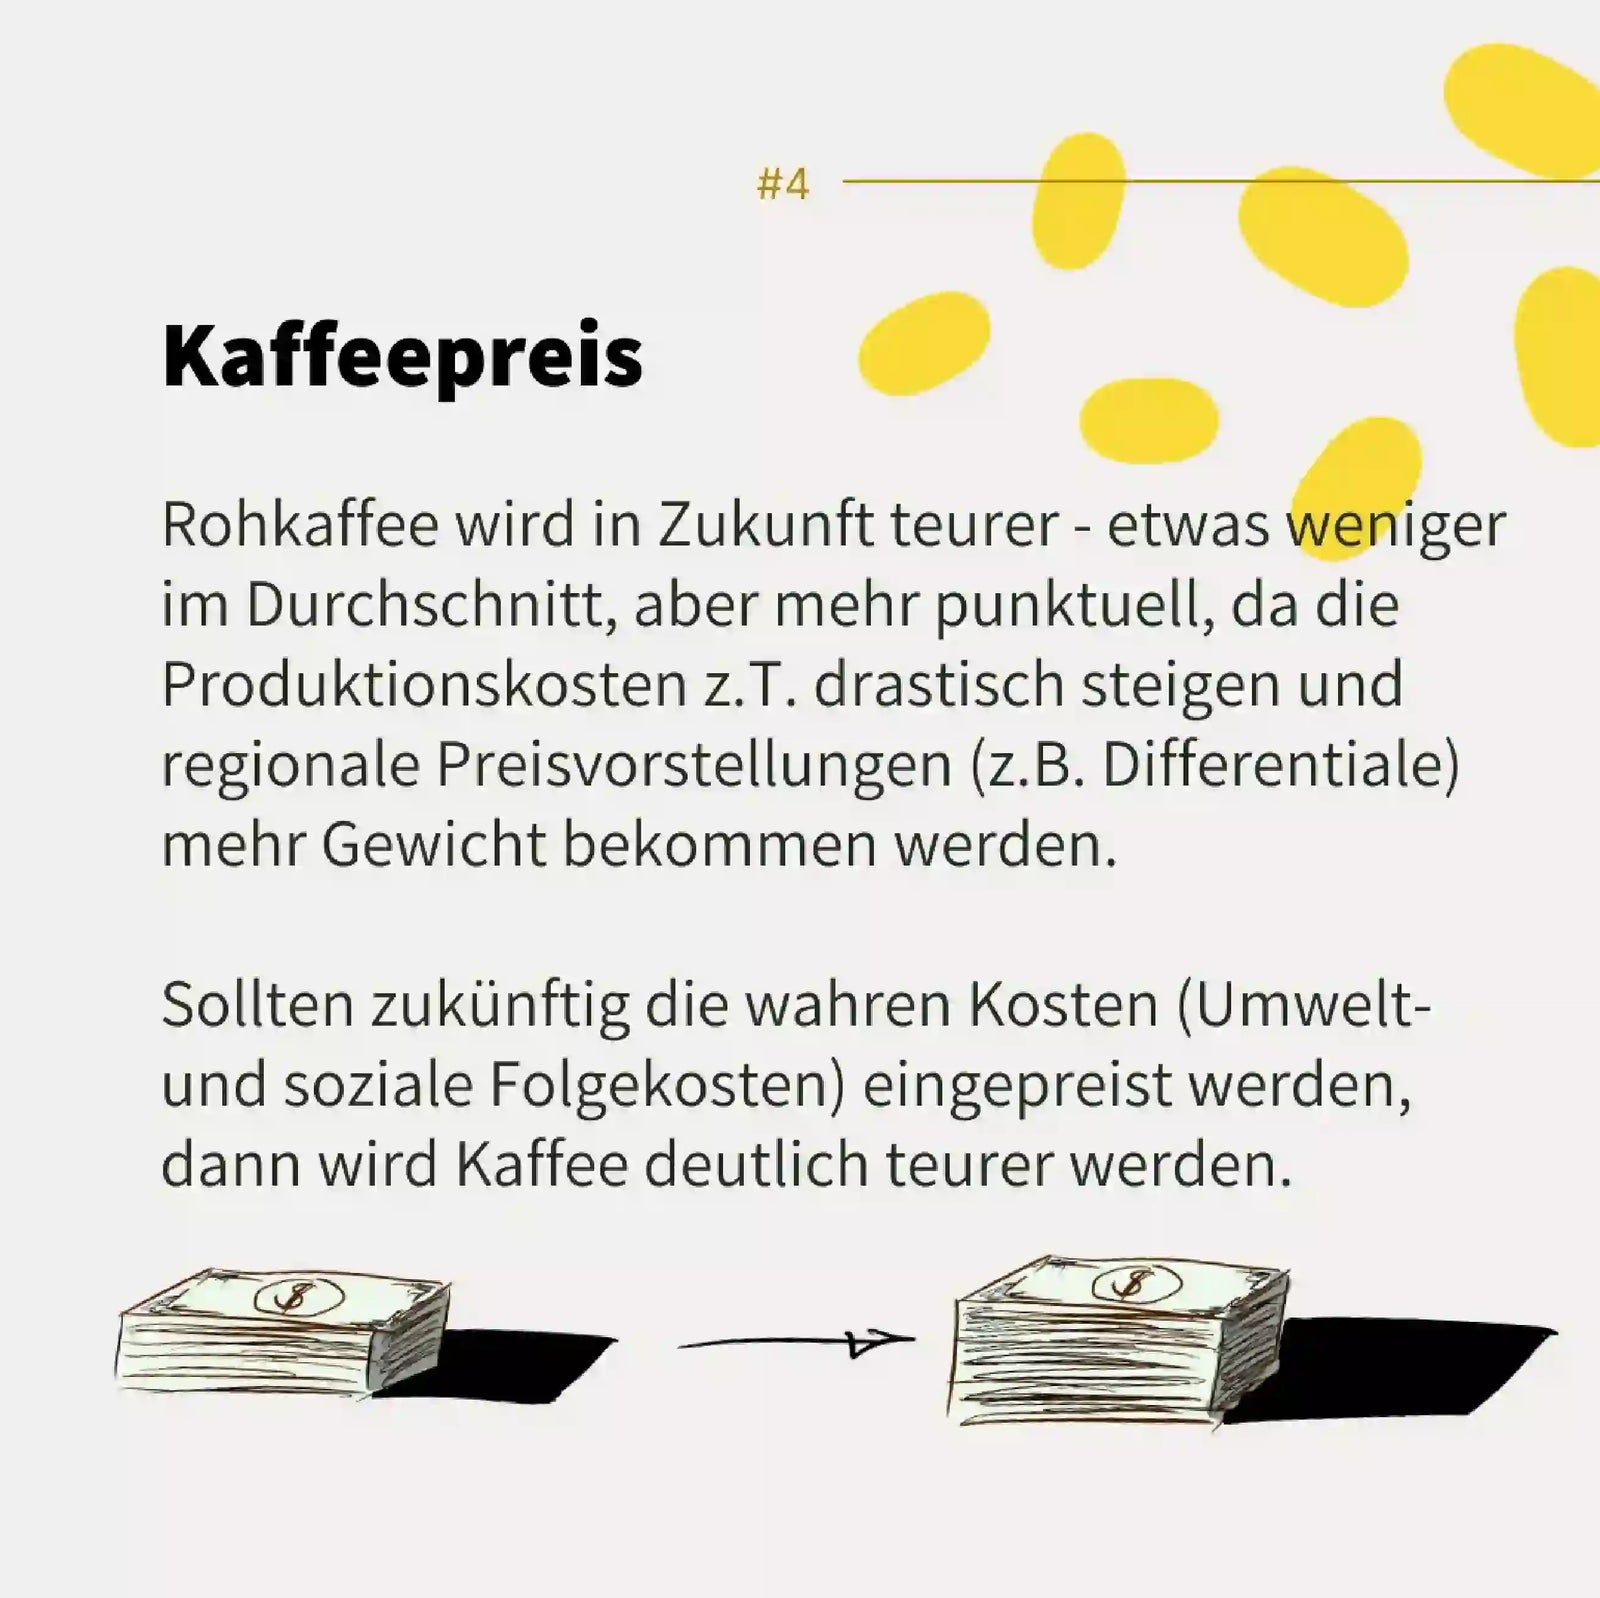
Yes, but: much will change, including taste: extraordinary coffees will be rarer, and more coffees will taste like "coffee".
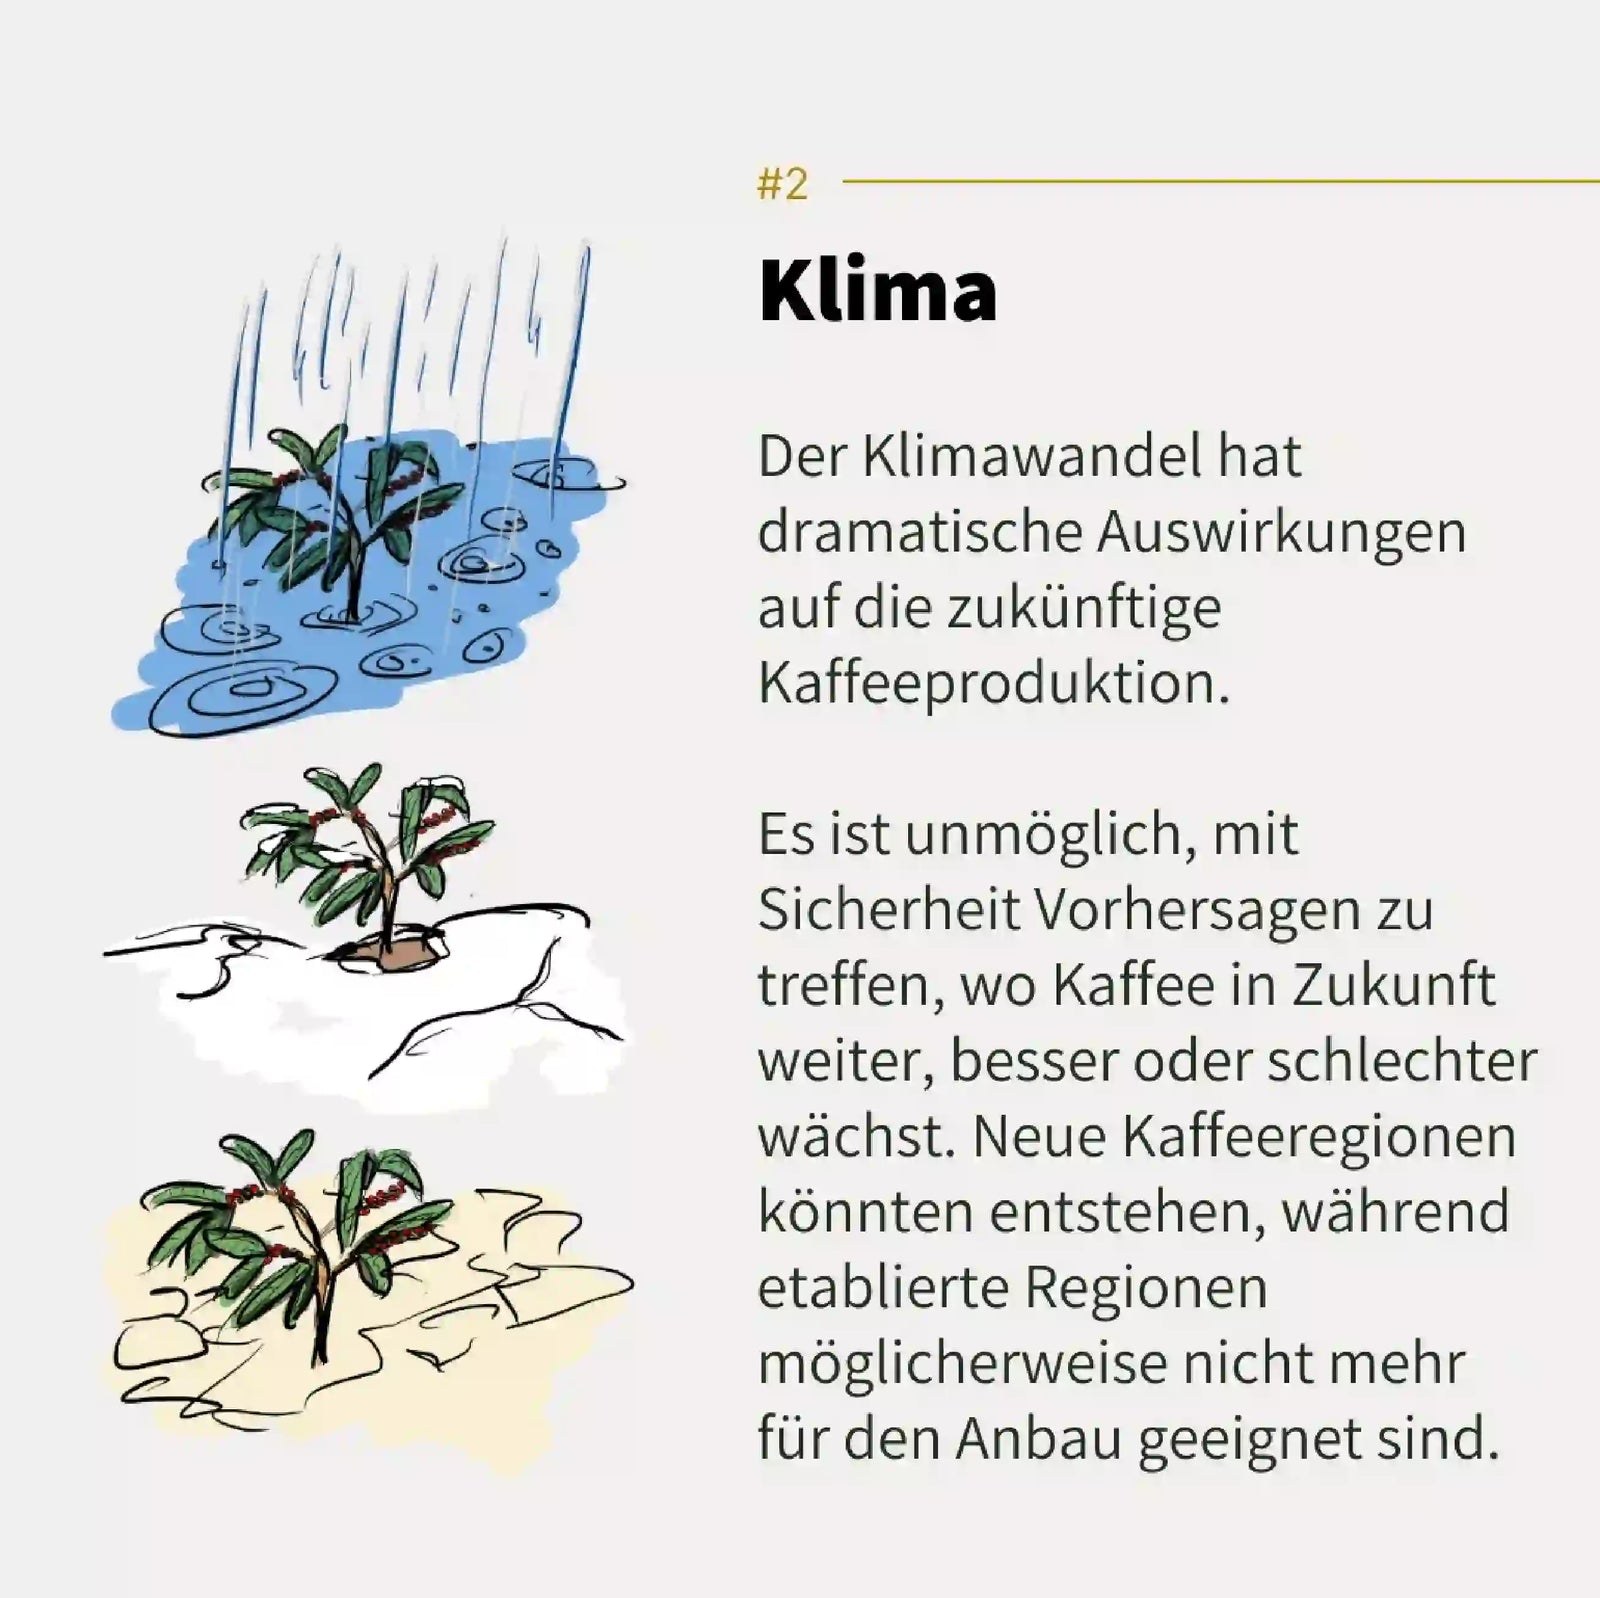
There are major challenges, but also opportunities – only, where and how exactly climate change will have what impact simply cannot be predicted.
And because a coffee plant takes three years before it yields a harvest, the world could look completely different in the meantime.
So: enjoy your coffee consciously.