


Auf der Kaffeekette entstehen natürlicherweise Emissionen. Wir wollten besser verstehen, wo, wie und warum sie entstehen. Wir haben analysiert, gerechnet und kontextualisiert. Auf der Basis unserer eigenen Farm in Nicaragua haben wir eine Berechnungsmethode etabliert, die wir nun auf alle unsere Kaffee-Lieferketten anwenden können.
Vom Baum bis in die Tasse
Now we know exactly how many emissions occur throughout the entire coffee chain
Dieses Wissen hilft uns nun, zusammen mit unseren Partnern, spezifische Lösungen anzudenken und in Projekten umzusetzen.
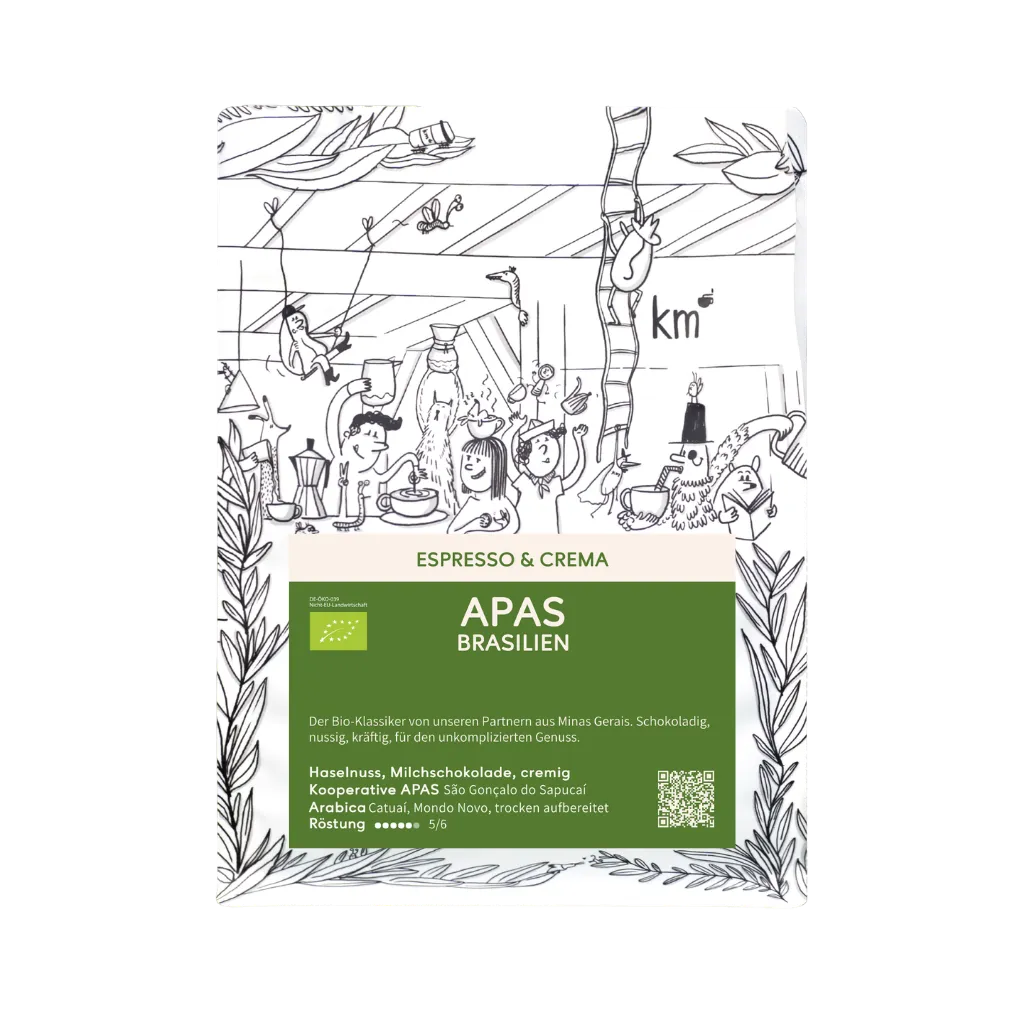
In Brasilien hat die Apas-Kooperative auf biologische Produktion umgestellt, in Nicaragua werden wir unseren eigenen Dünger herstellen, und in Mexiko arbeiten wir mit unseren Partnern daran, dass sich die Agroforstwirtschaft für Kleinstproduzenten positiv auf deren Haushaltseinkommen auswirken soll.
Zu den Postings: im Januar 2024 haben wir diese Reihe an Grafiken auf den sozialen Medien publiziert. Die Postings haben einen starken CO₂-Fokus. Dieser repräsentiert „nur“ das Erderwärmungspotenzial (GWP-100). Bei einer ganzheitlichen Betrachtung dürfen Landnutzungsänderung, Versauerung von Gewässern und vor allem auch soziale Faktoren nicht außer Acht gelassen werden.
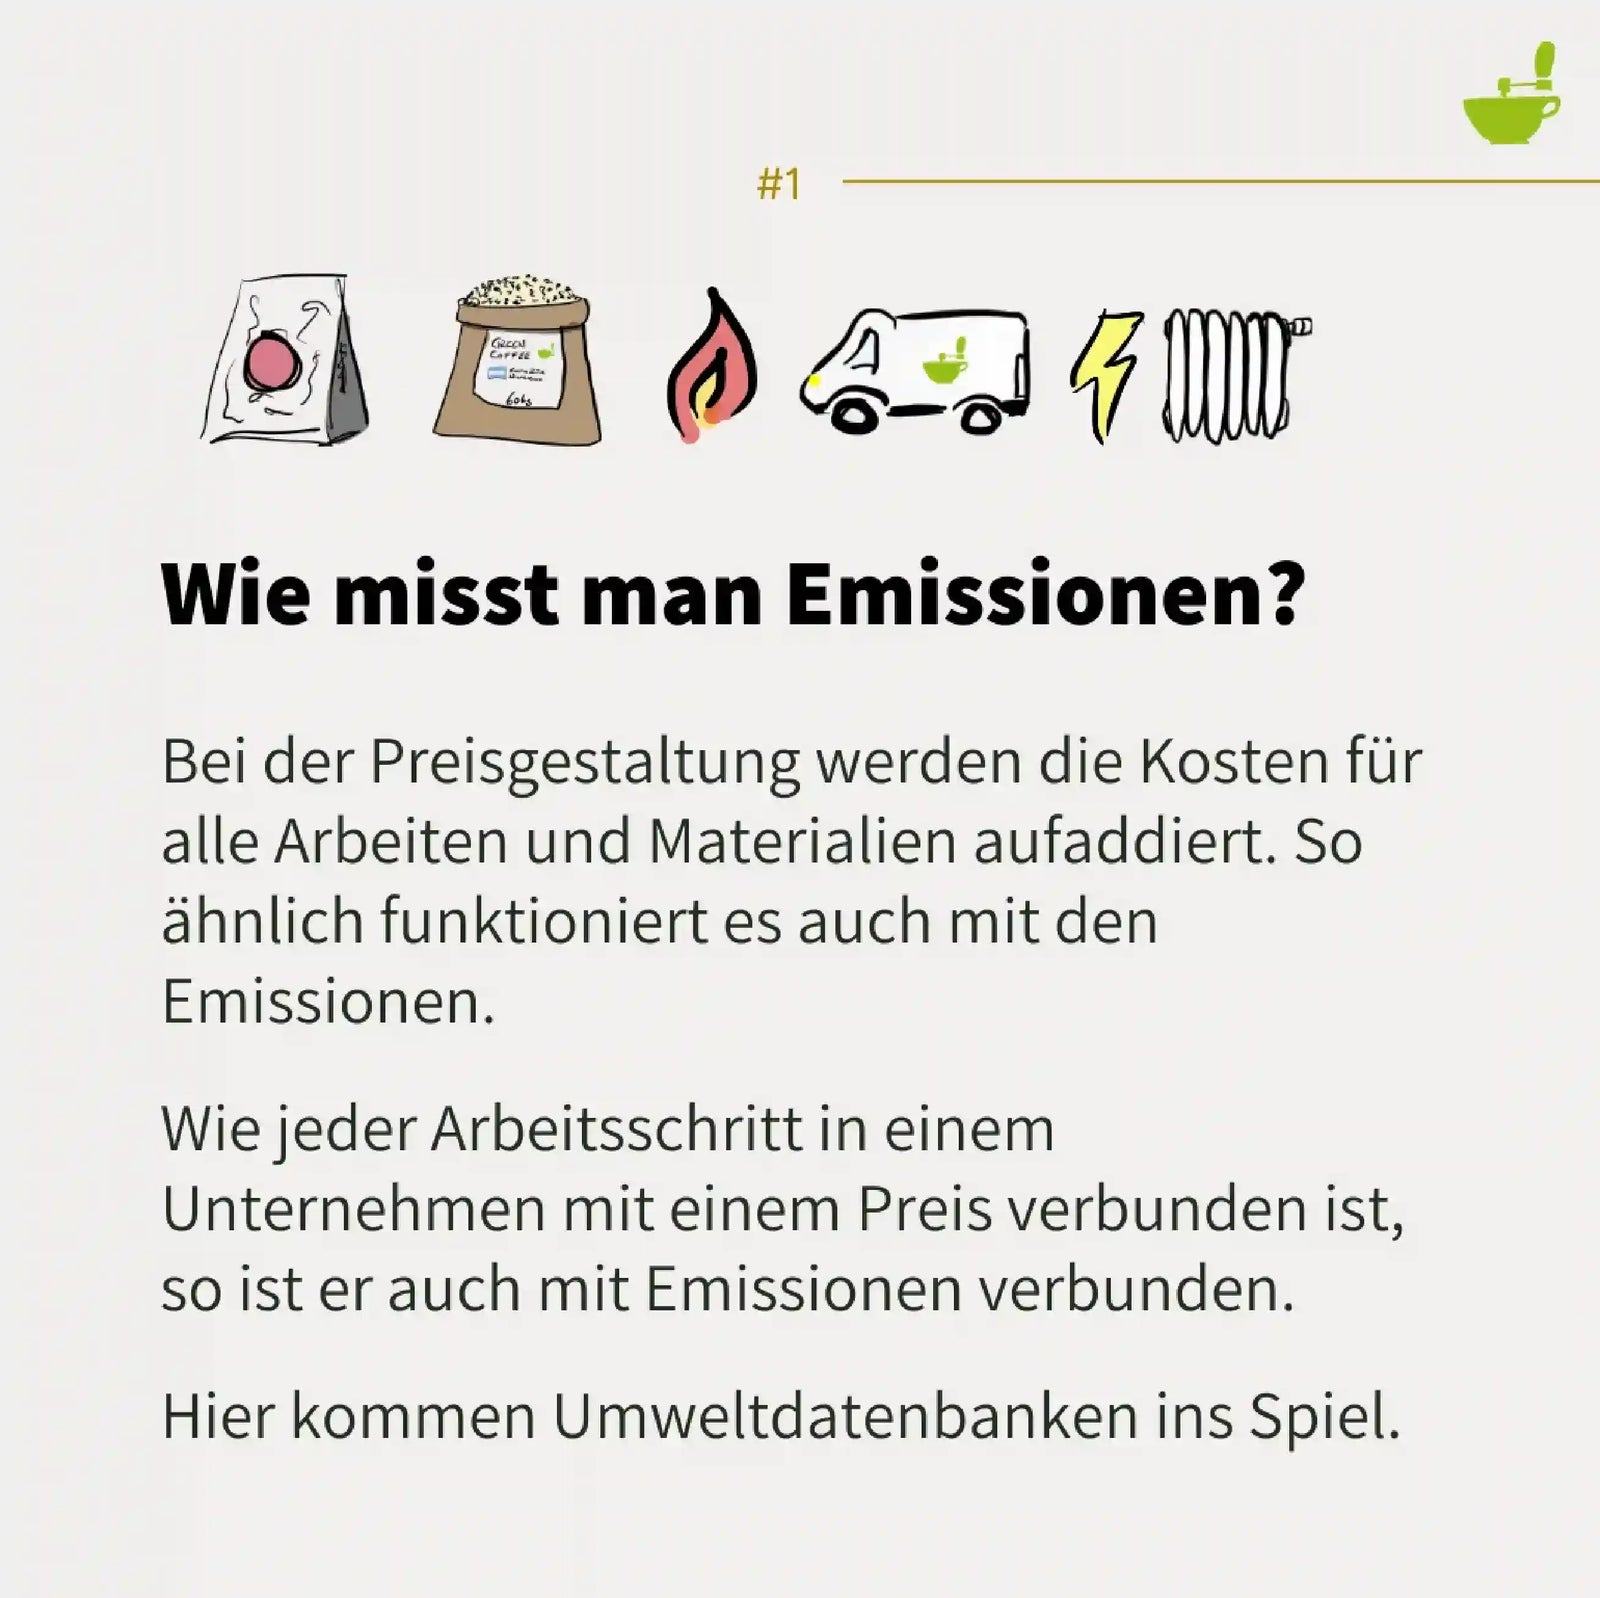
Wie misst man Emissionen?
Das Greenhouse Gas Protocol ist der Standard zur Messung von zur Bilanzierung von Treibhausgasemissionen, an den wir uns halten. Man nenn die Berechnung auch Life Cycle Assessment oder Lebenszyklusanalyse. Zum Stand Januar 2024 haben wir den CO₂-Fußabdruck unseres Kaffees von Santa Rita für die Ernte 21/22, den Transport von Nicaragua zu uns nach Basel und die Emissionen der Rösterei für 2022 berechnet.
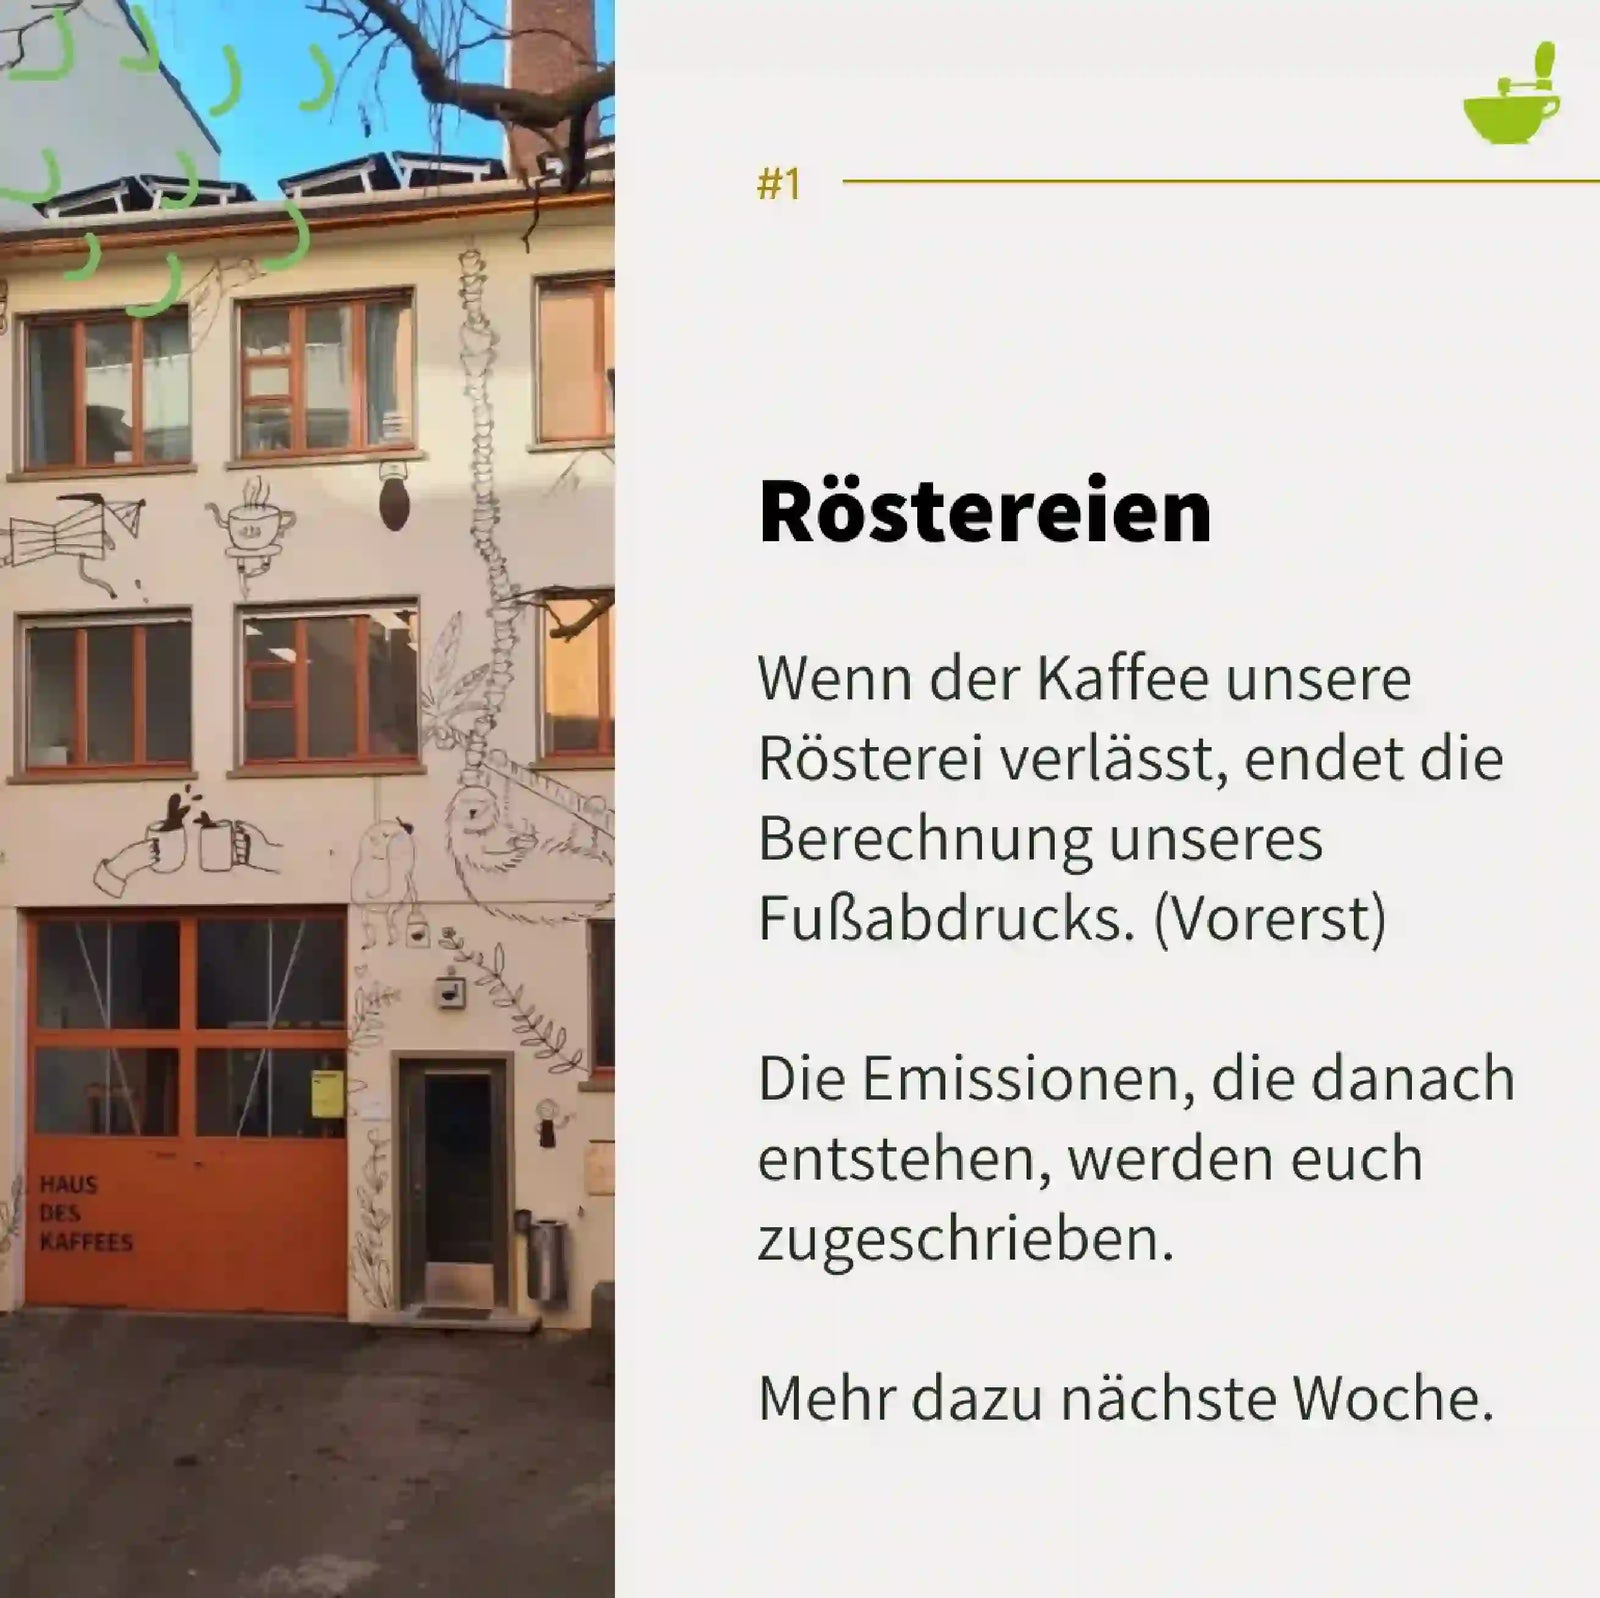
Es handelt sich somit um eine Cradle-to-Gate-Analyse. Das bedeutet, wir berücksichtigen alle Emissionen, die entstehen, bis der Kaffee unsere Rösterei verlässt.
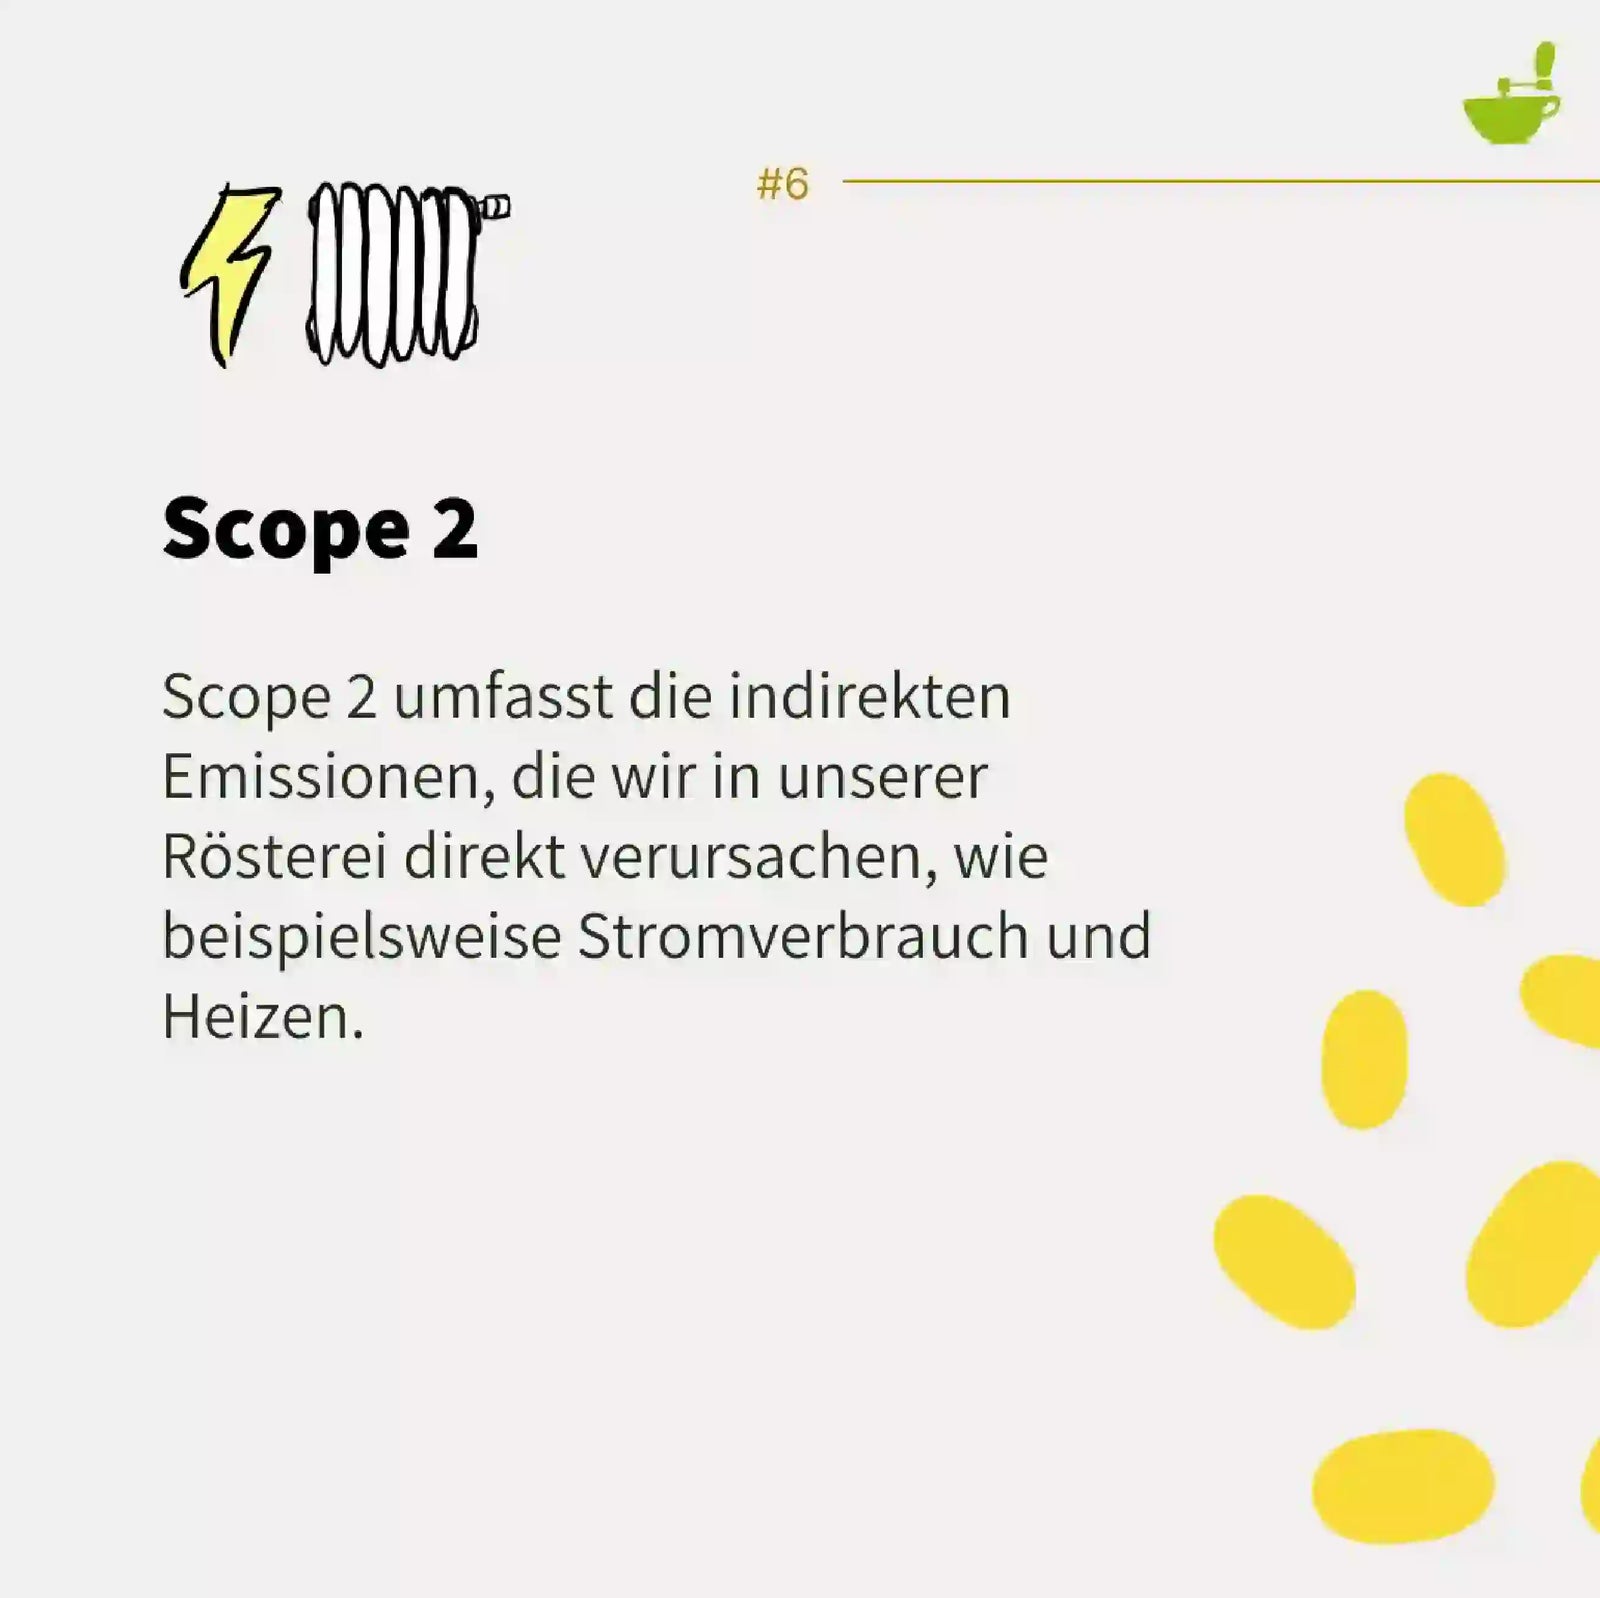
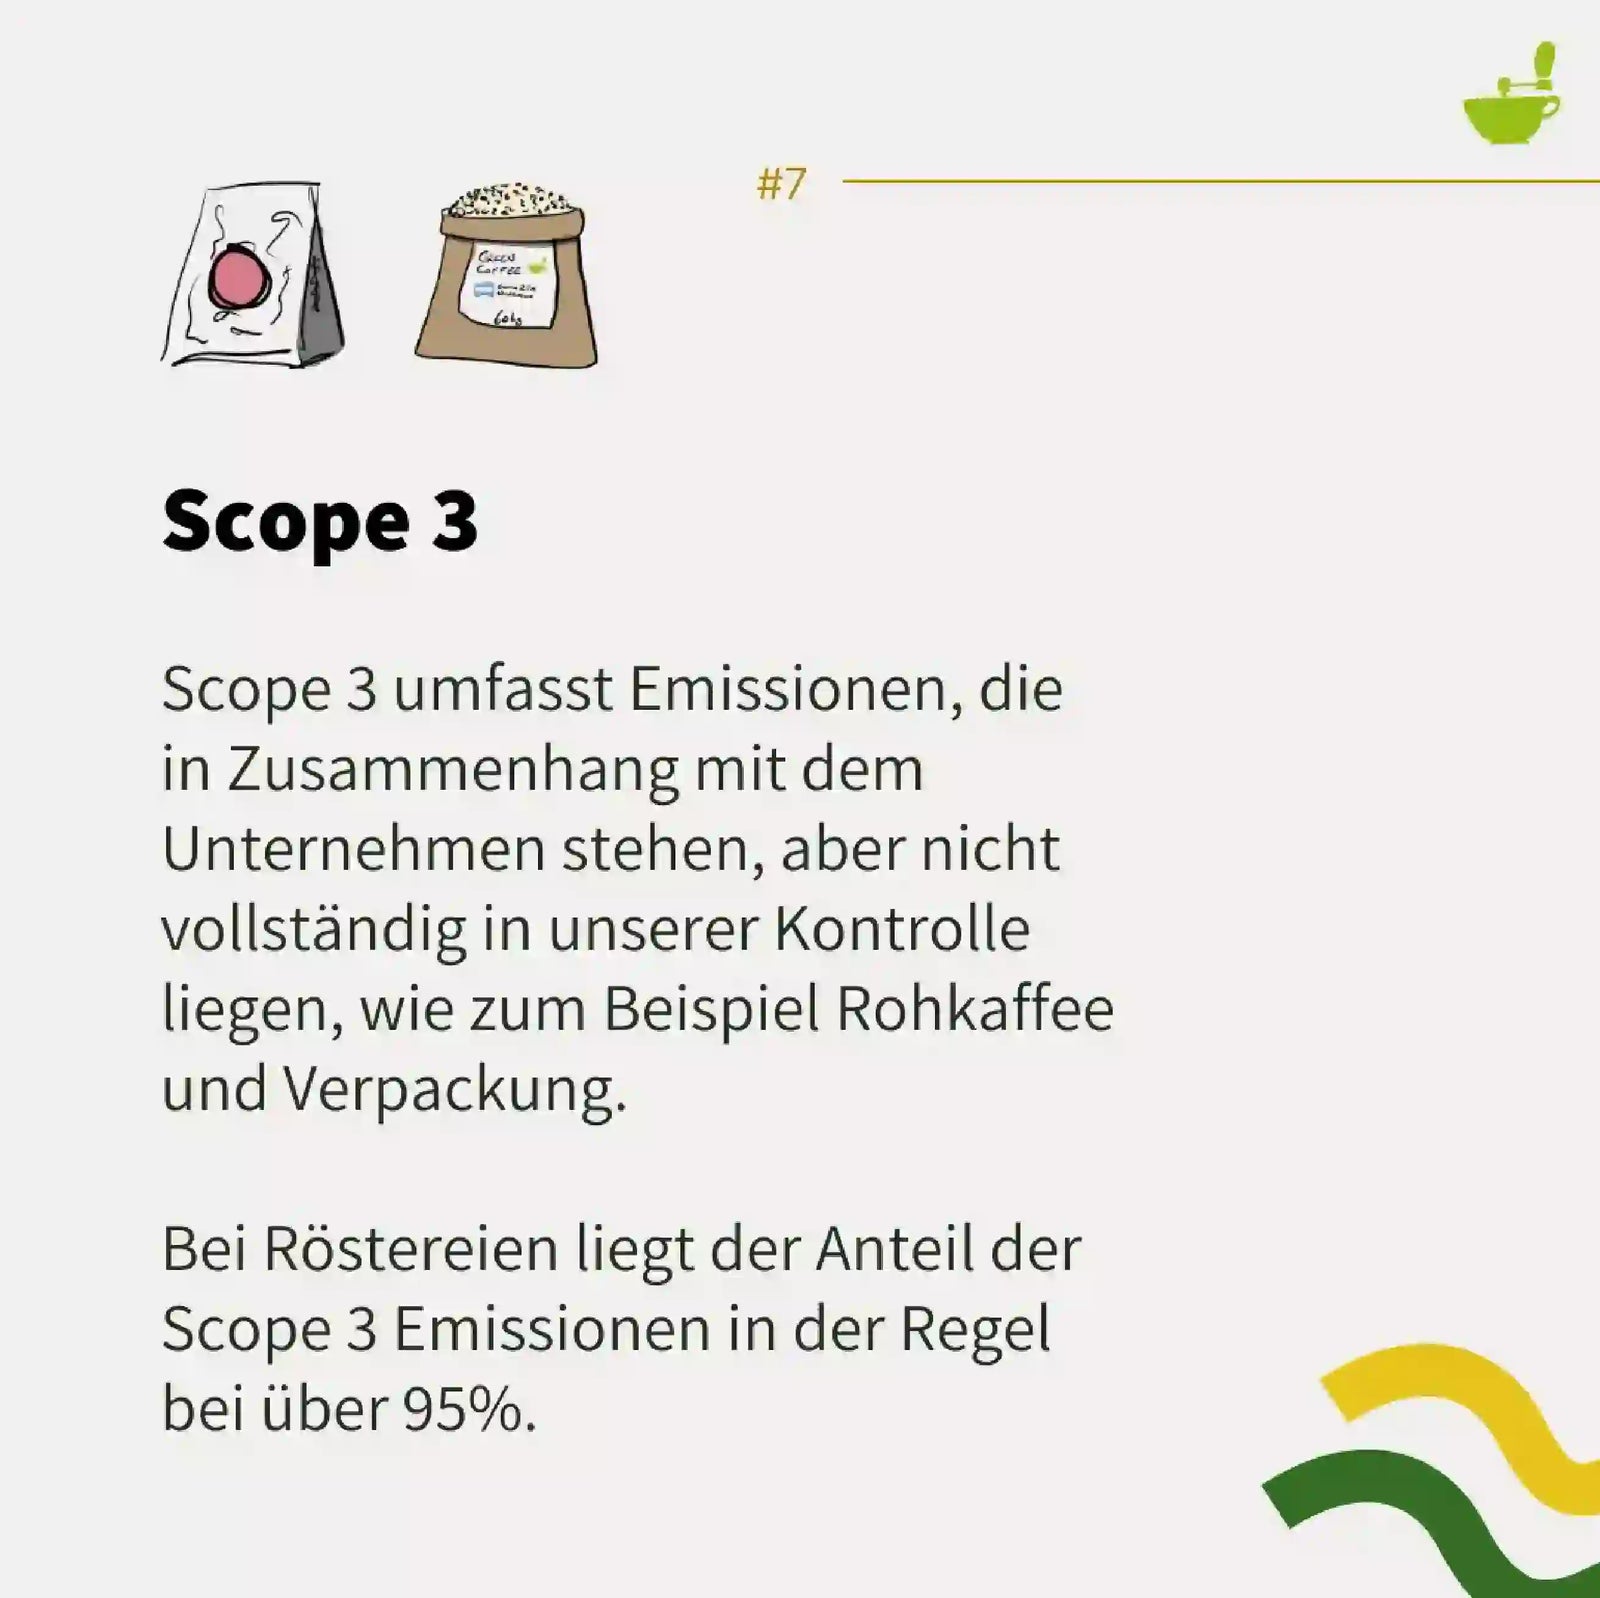
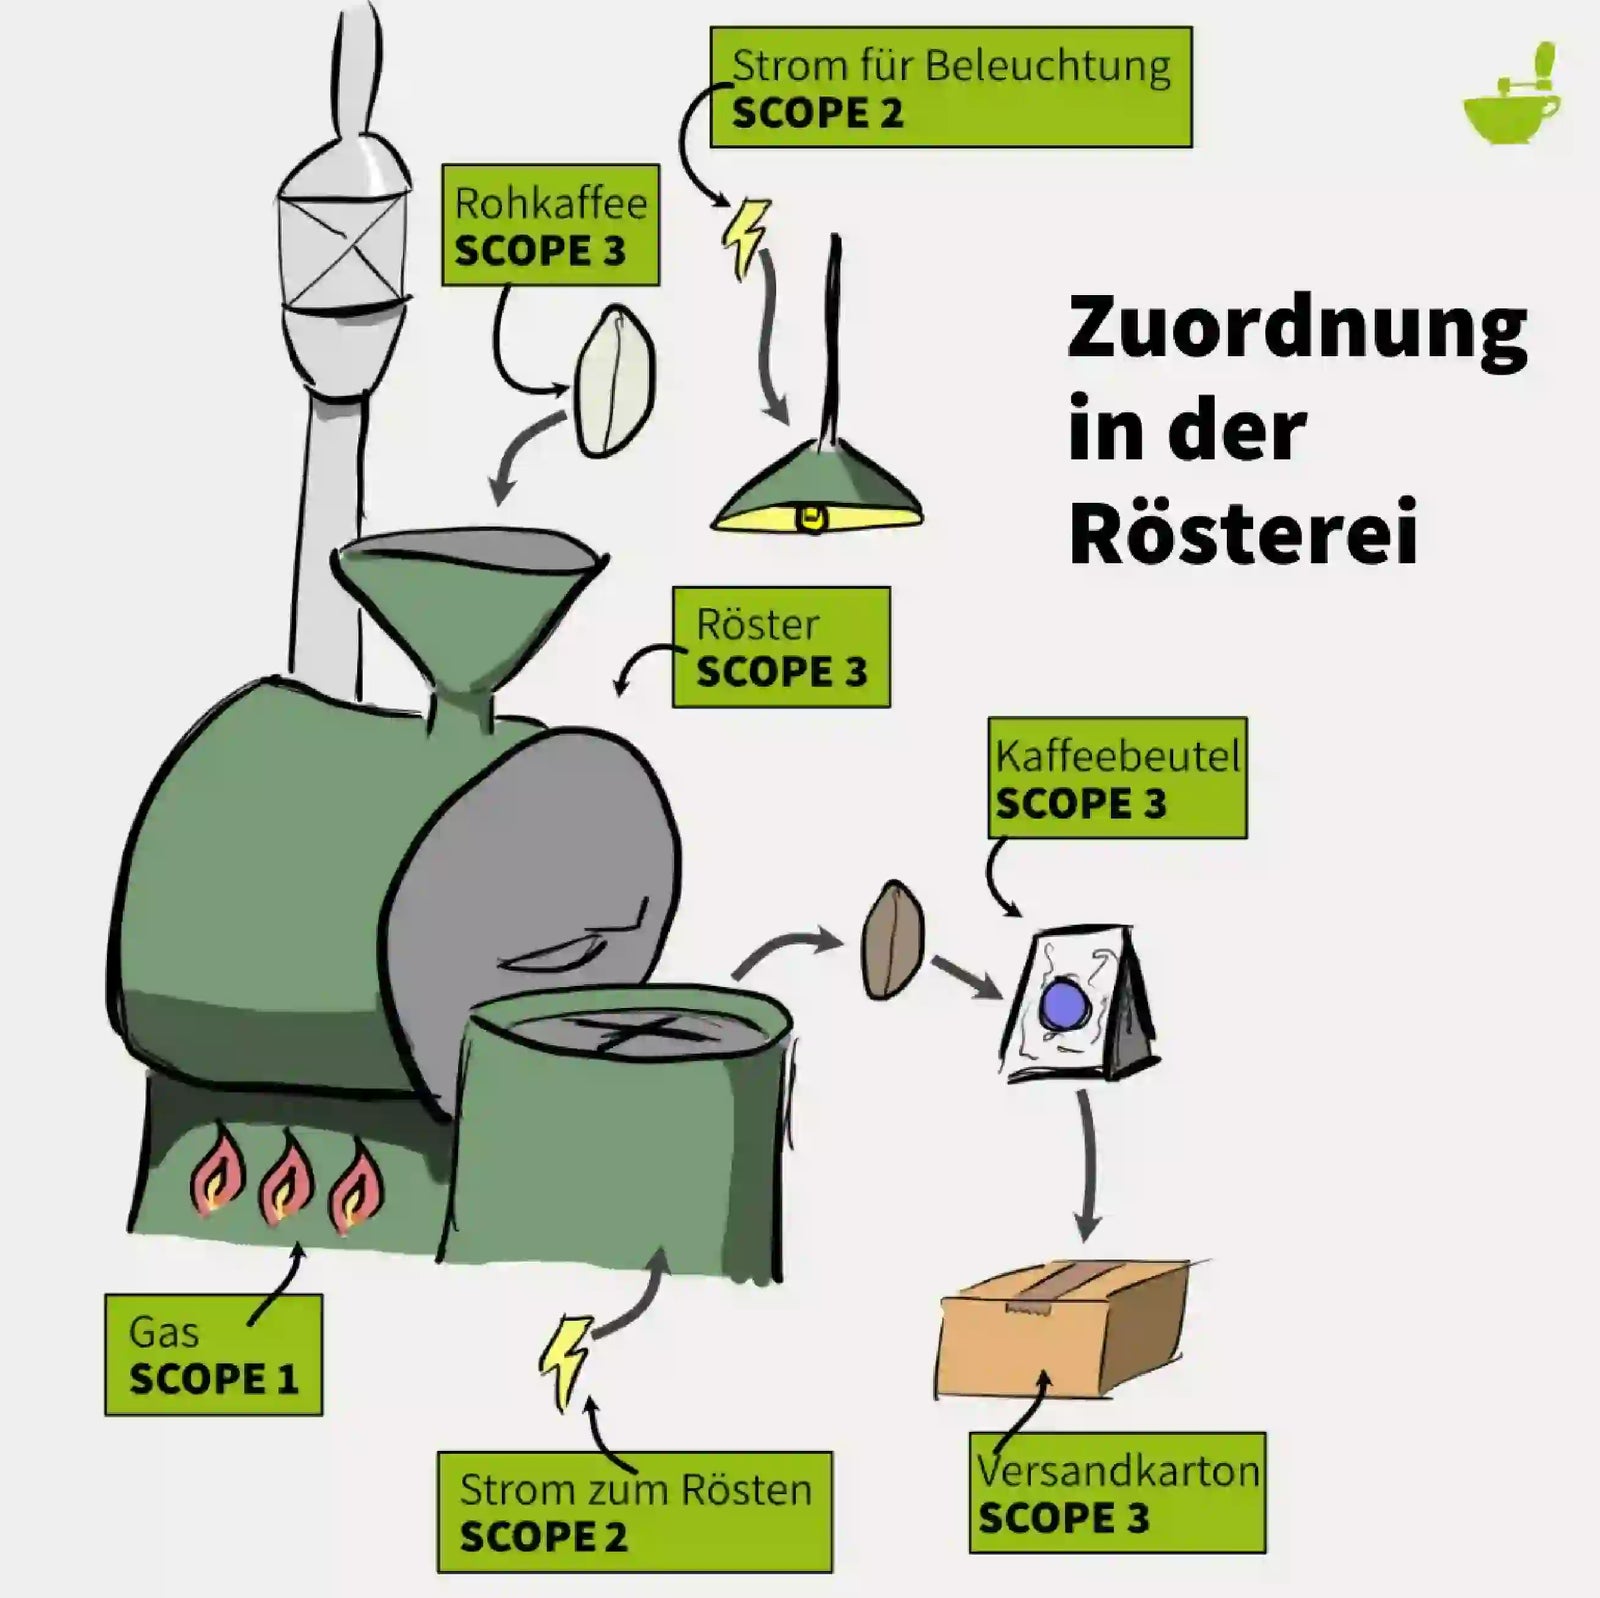
Bei Röstereien fallen die meisten Emissionen in Scope 3 an. Auch bei uns macht Scope 3 95,8 % aus. Dabei basiert diese Berechnung nur auf dem Kaffee von Santa Rita. Weitere Kaffees, haben sicherlich einen anderen CO₂-Fußabdruck. Unser Kaffeesortiment hat somit den größten Einfluss auf unsere Emissionen. Doch weitere Faktoren spielen bei der Auswahl eine Rolle. Mehr dazu findet ihr hier.
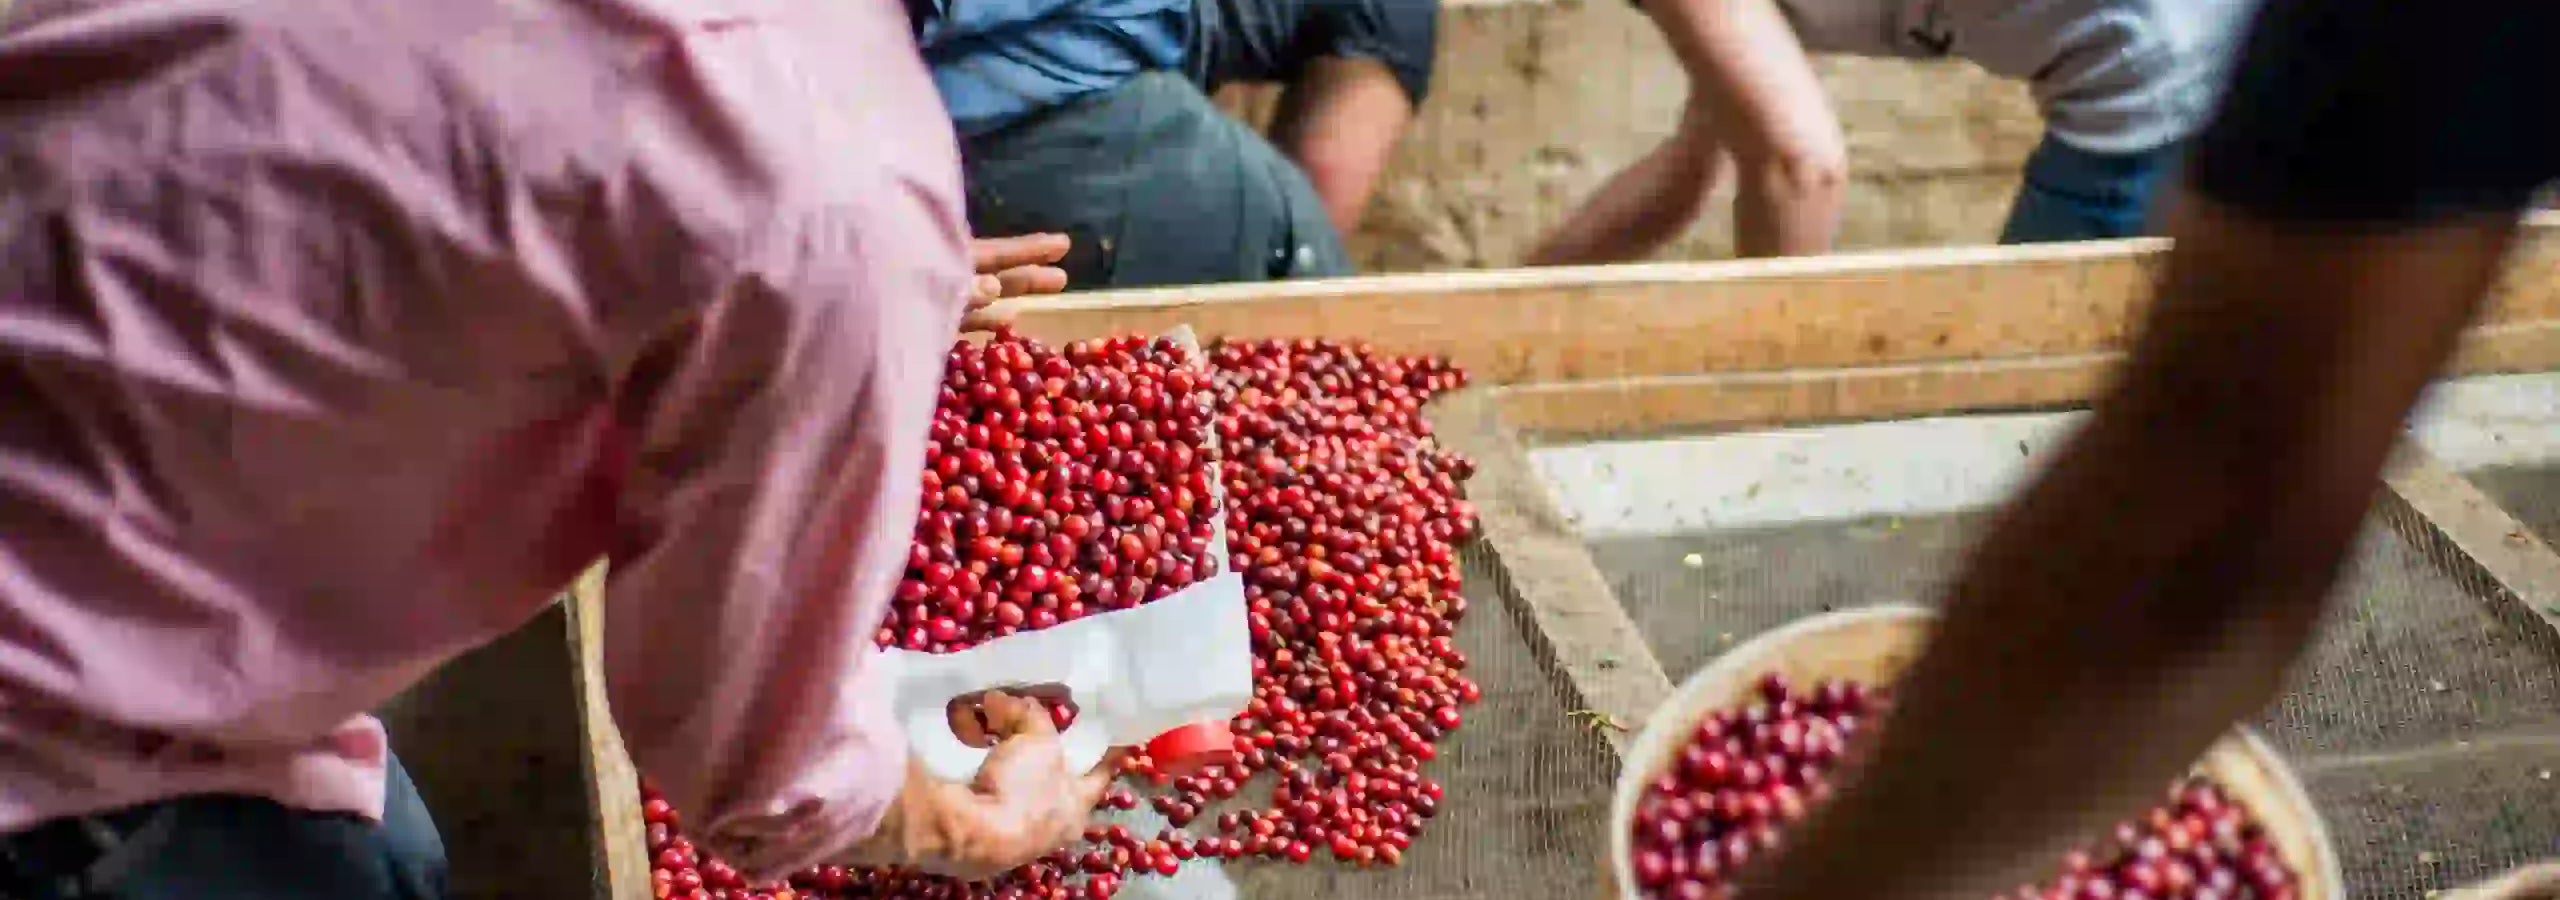
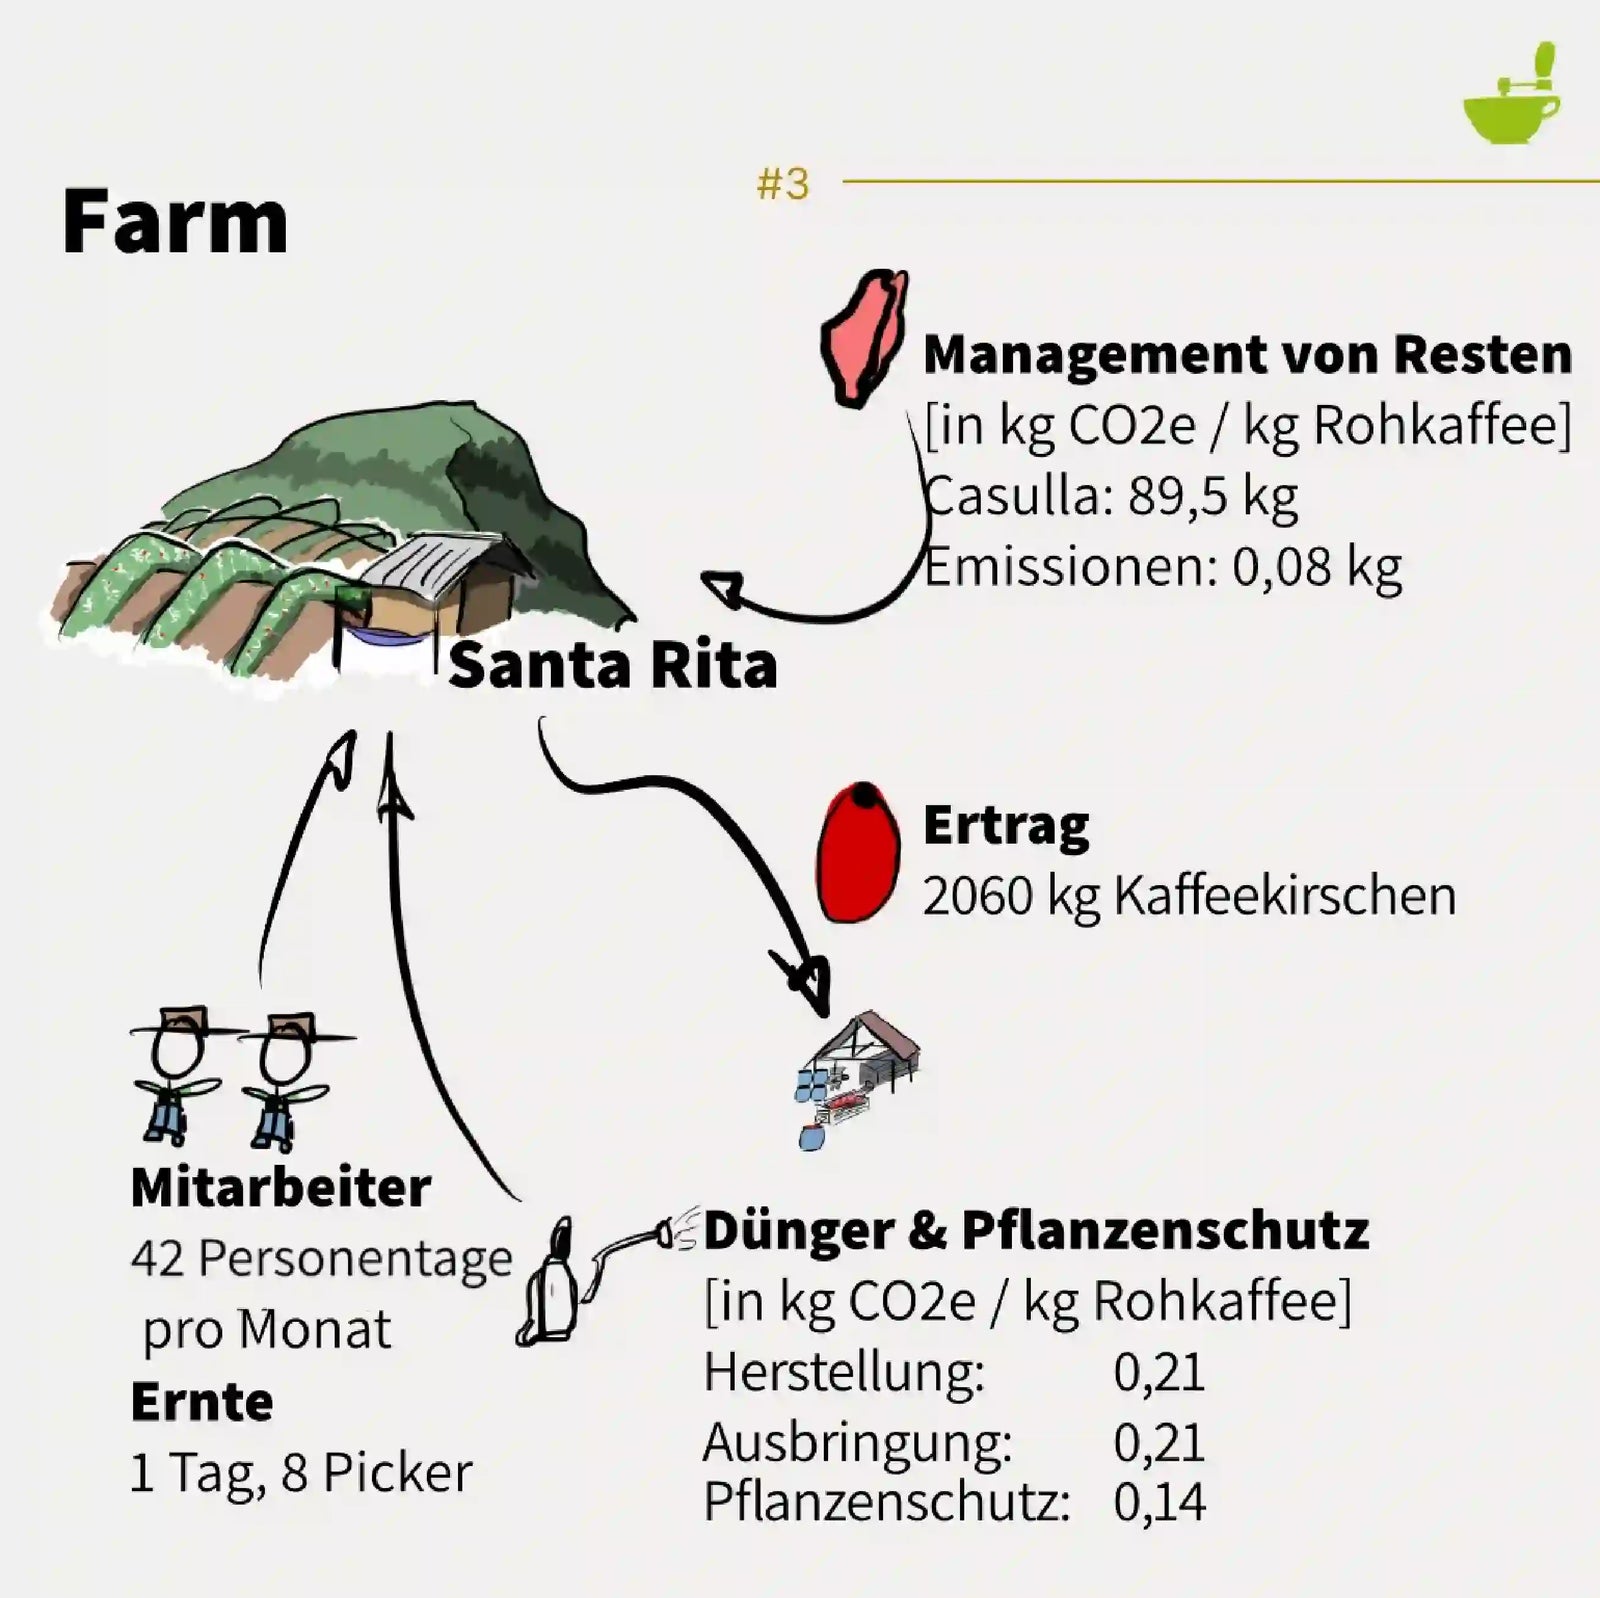
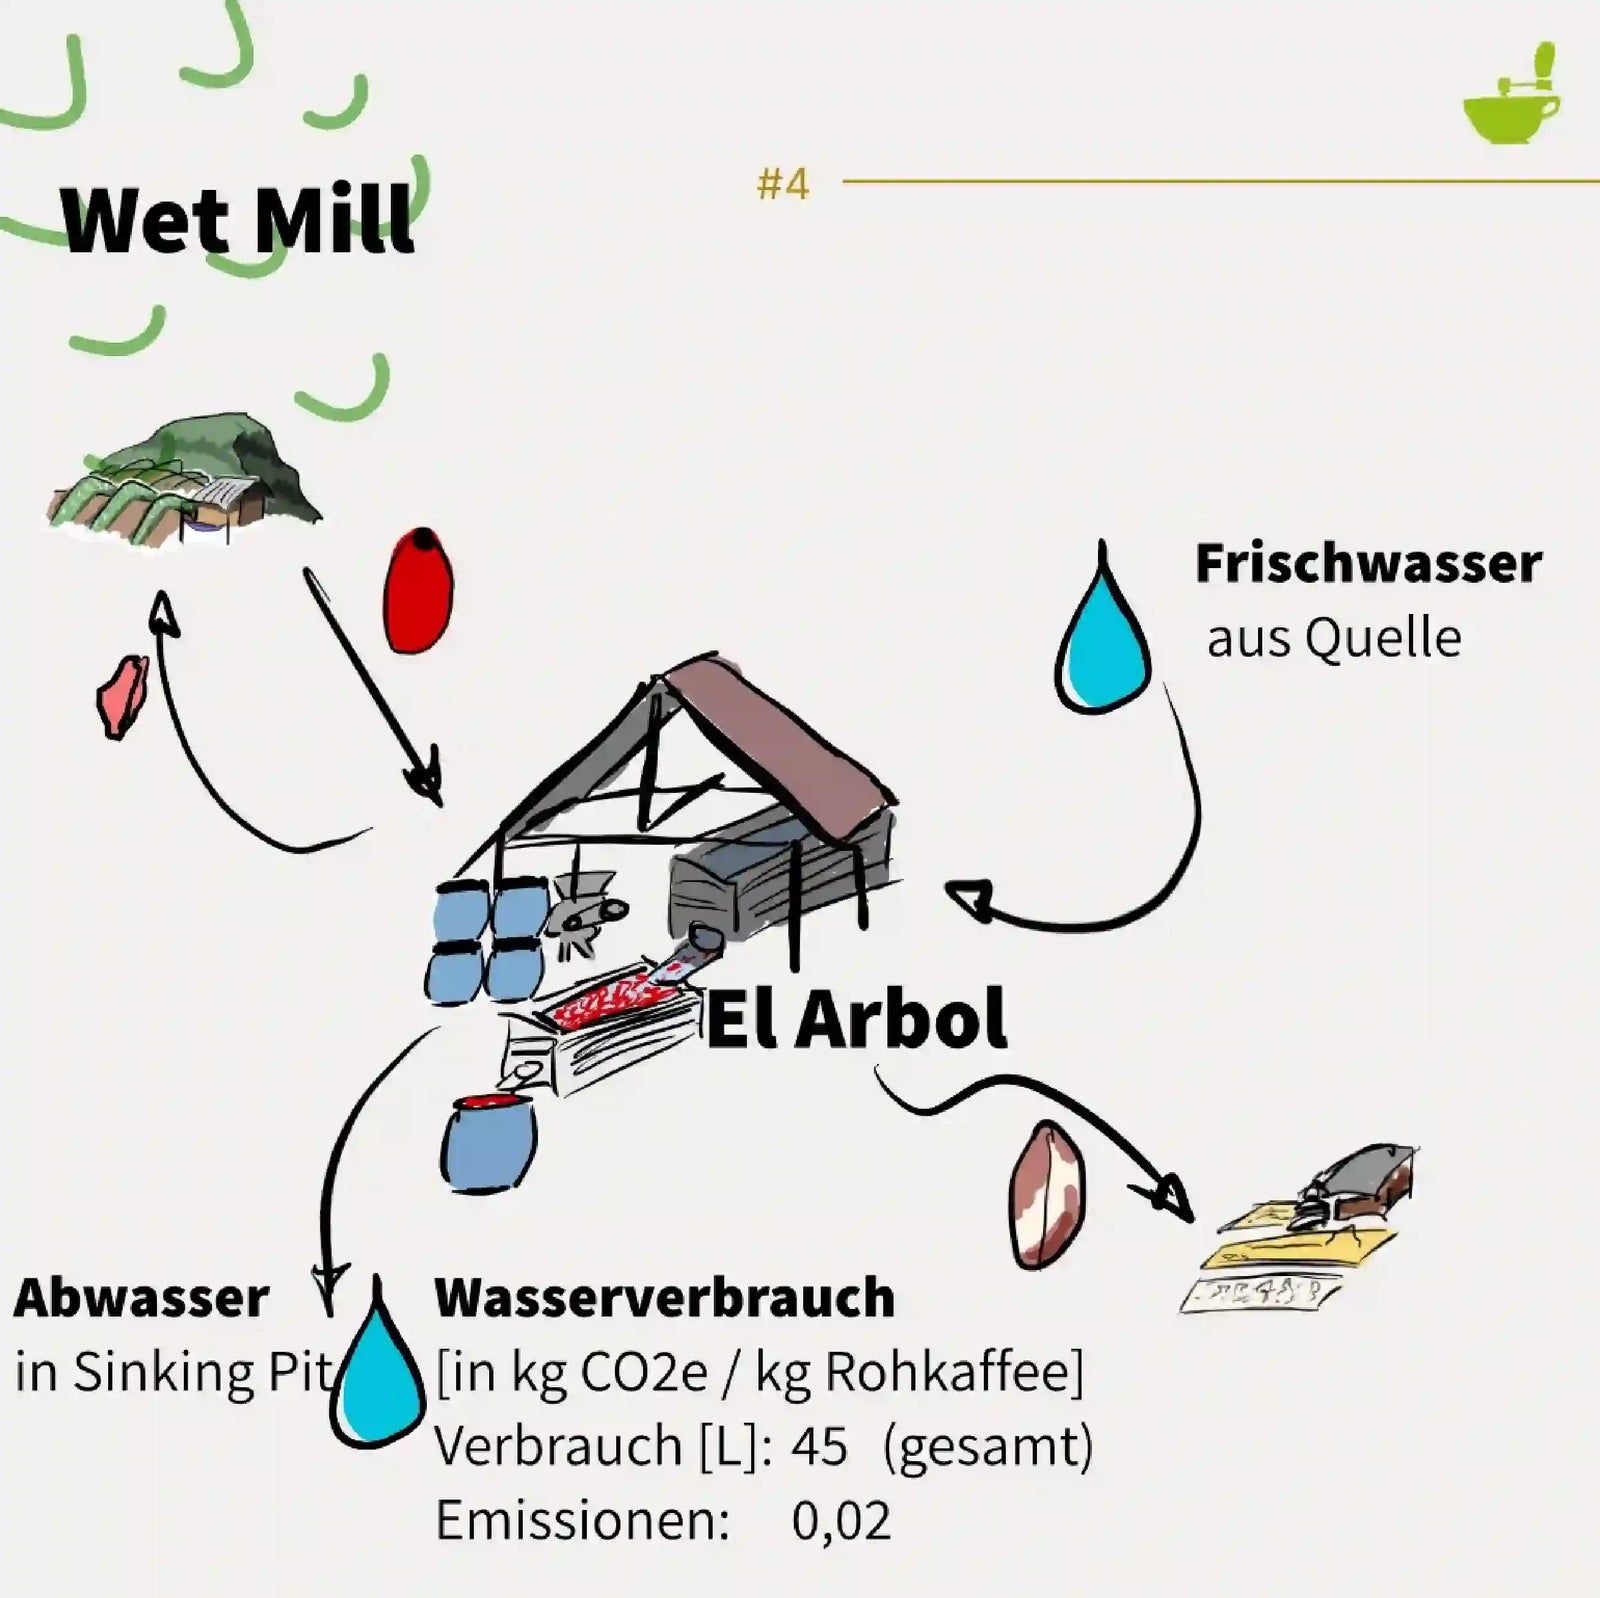
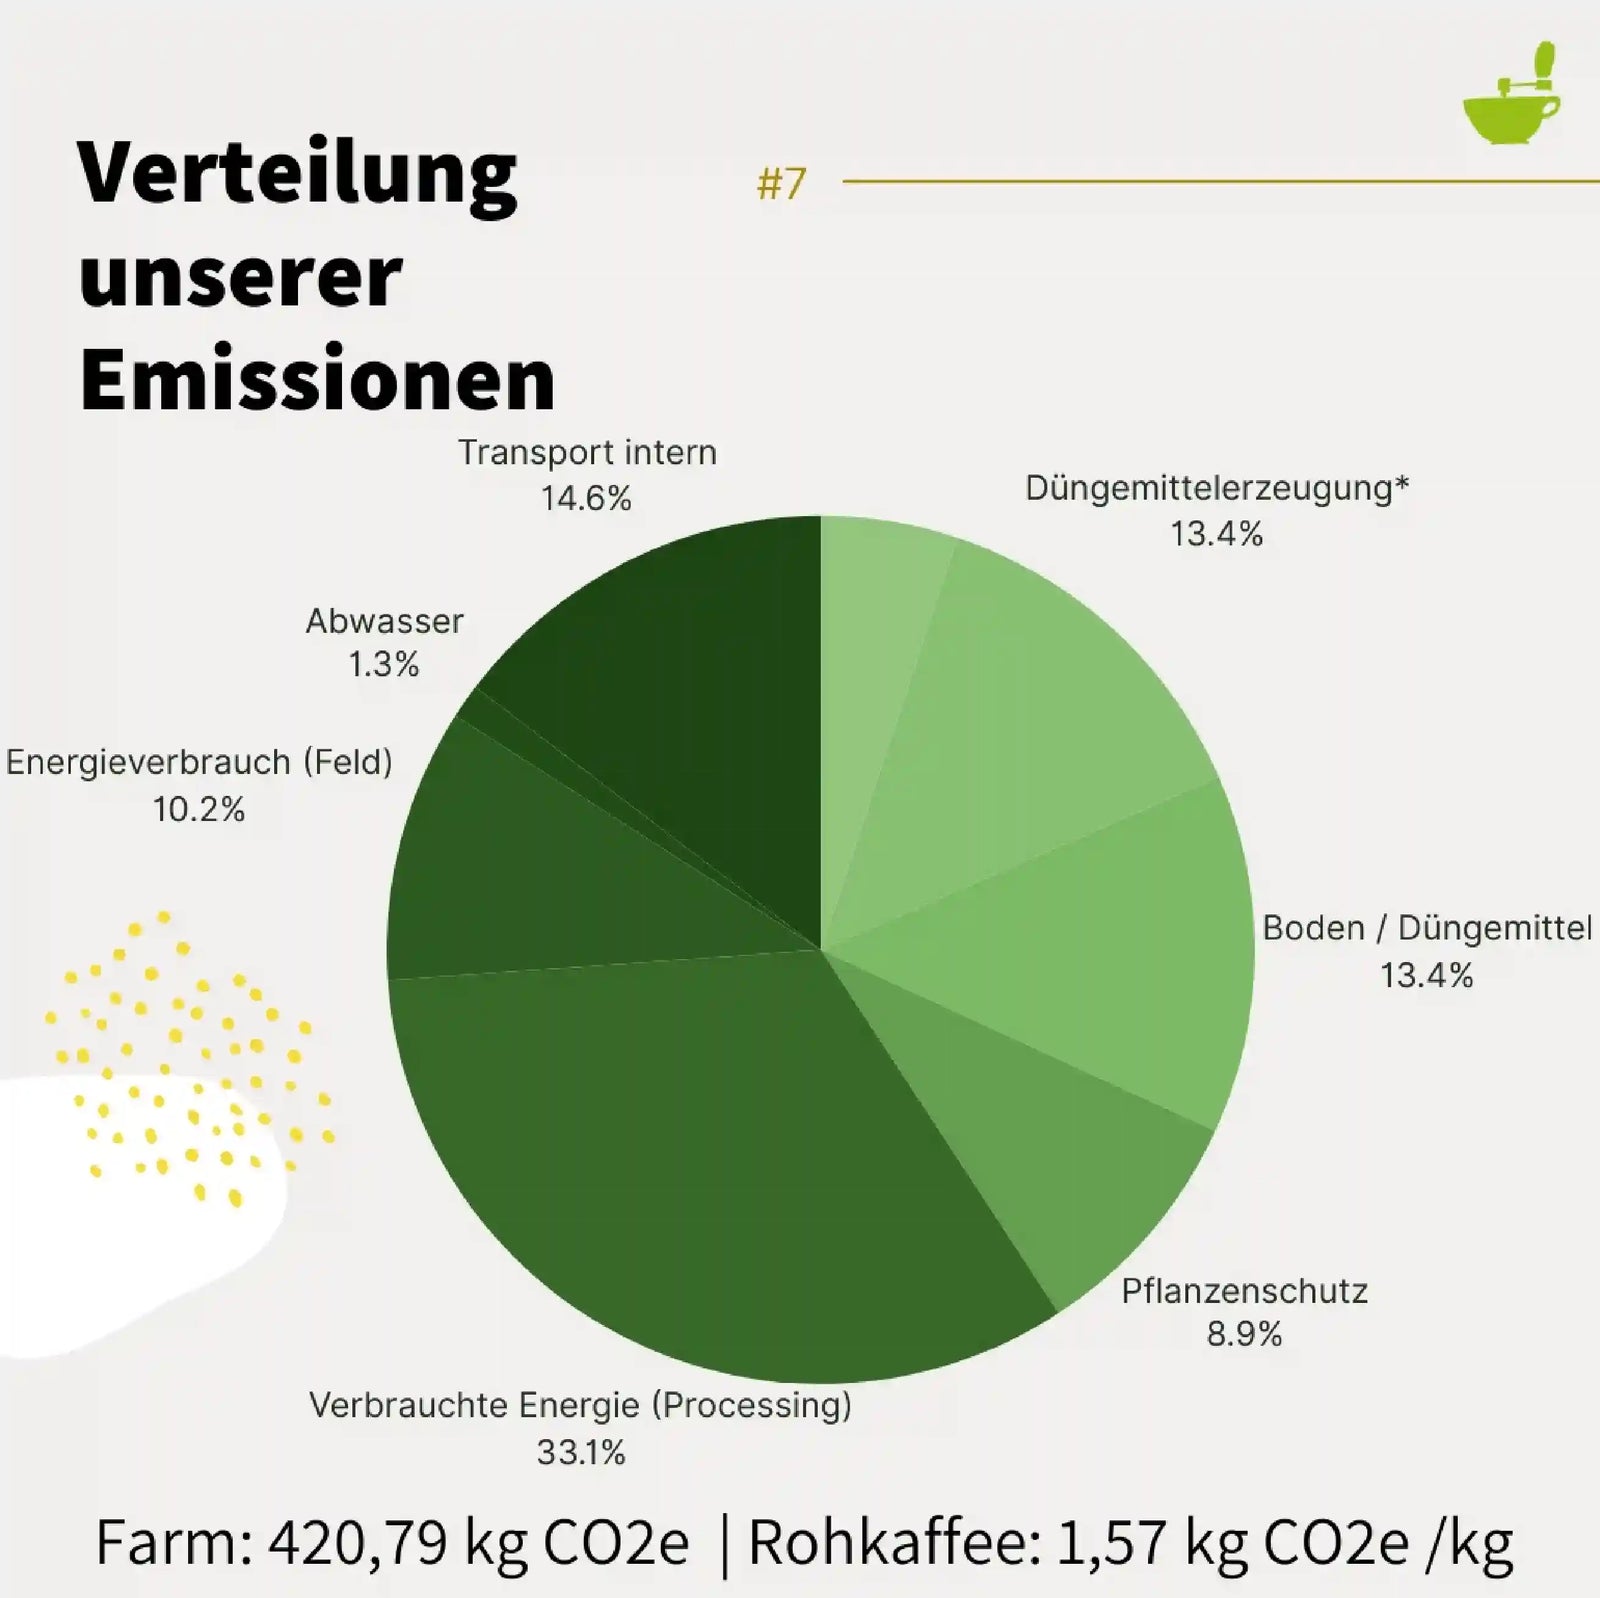
Umwelteinflüsse im Kaffeeanbau
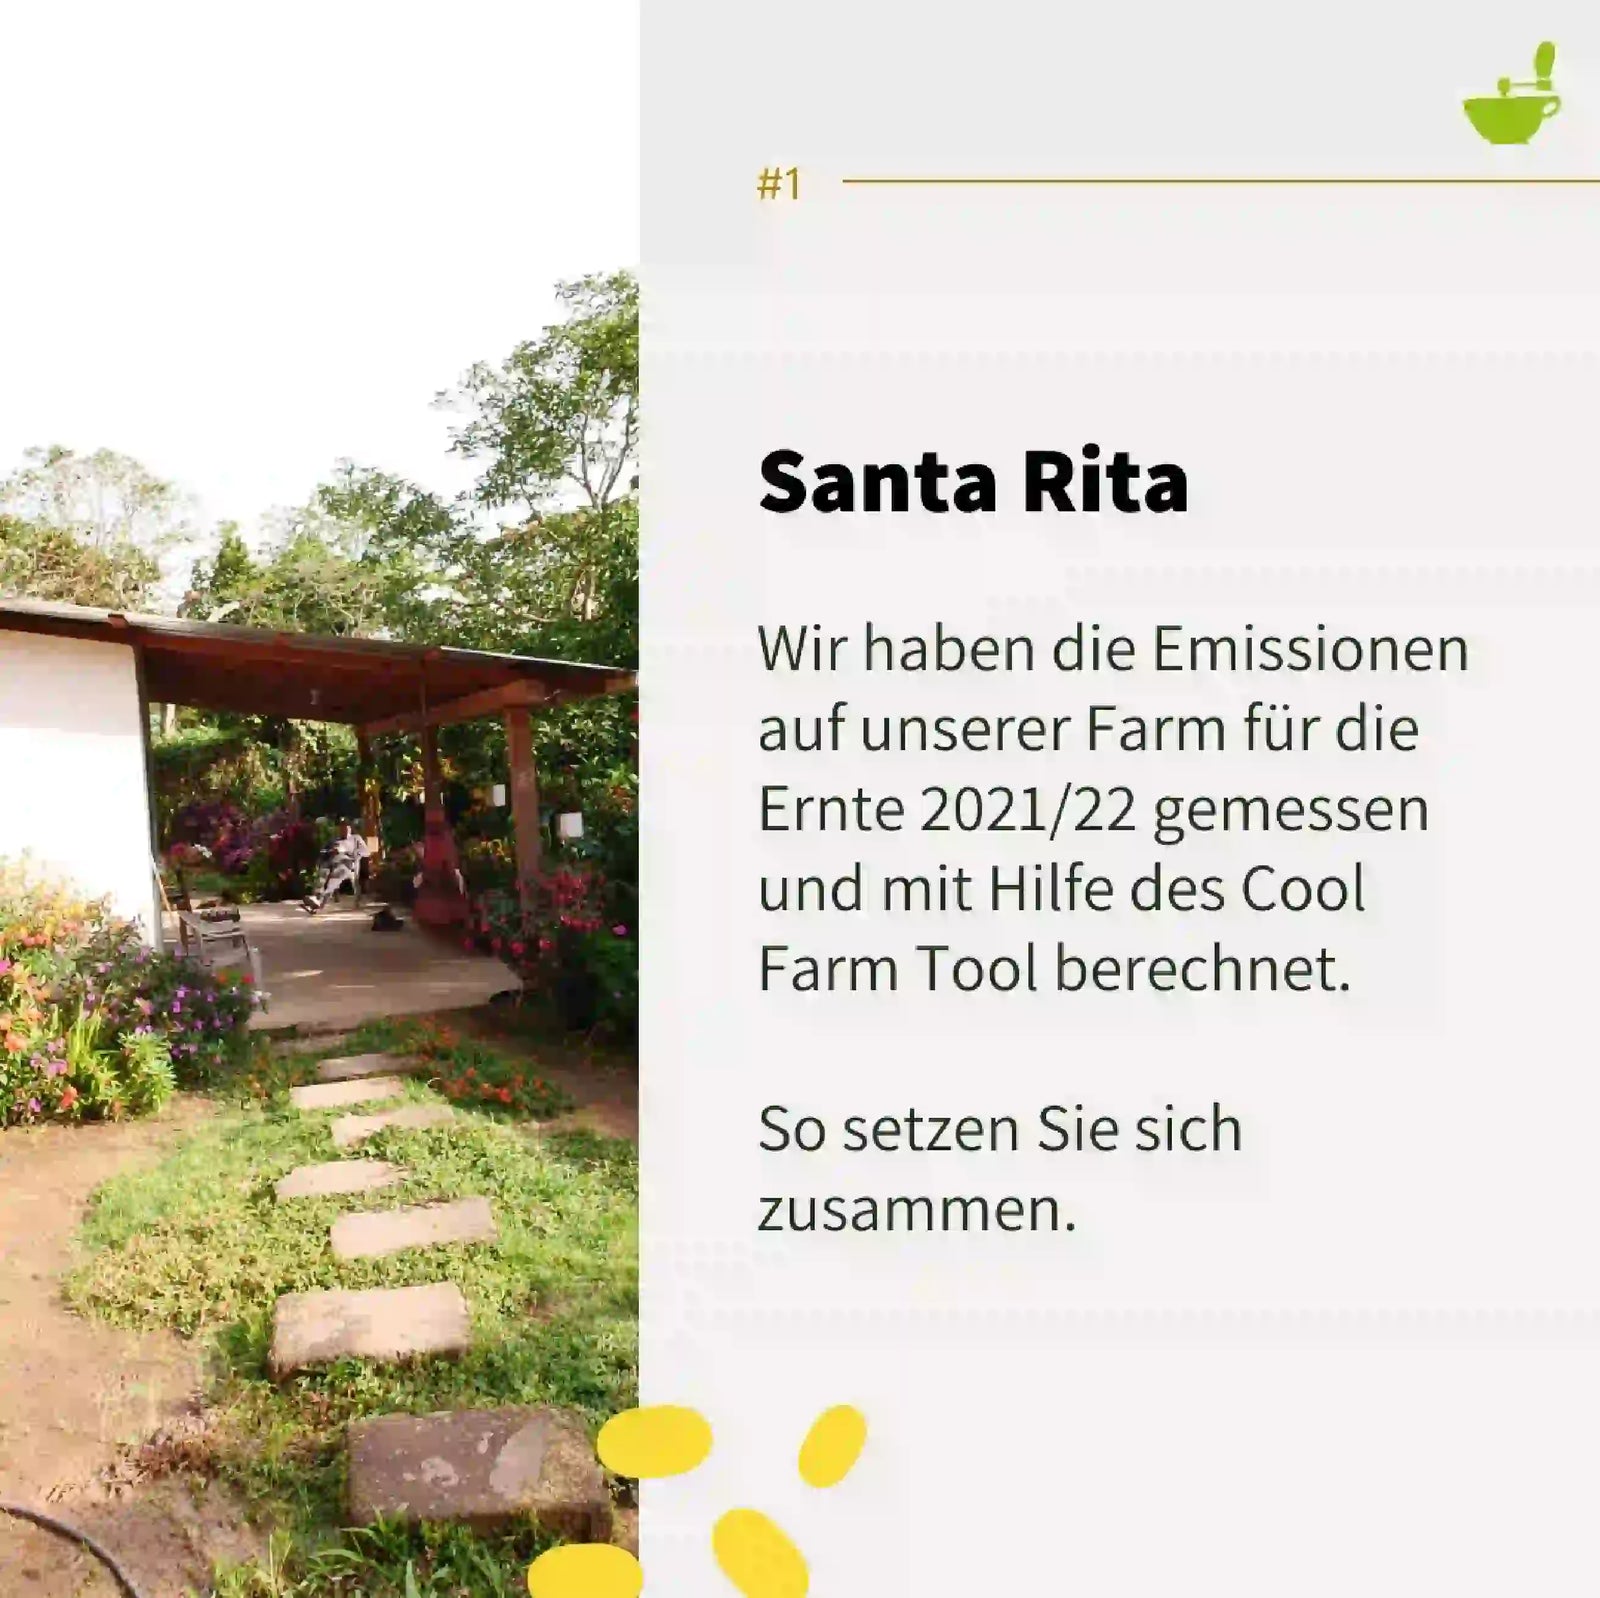
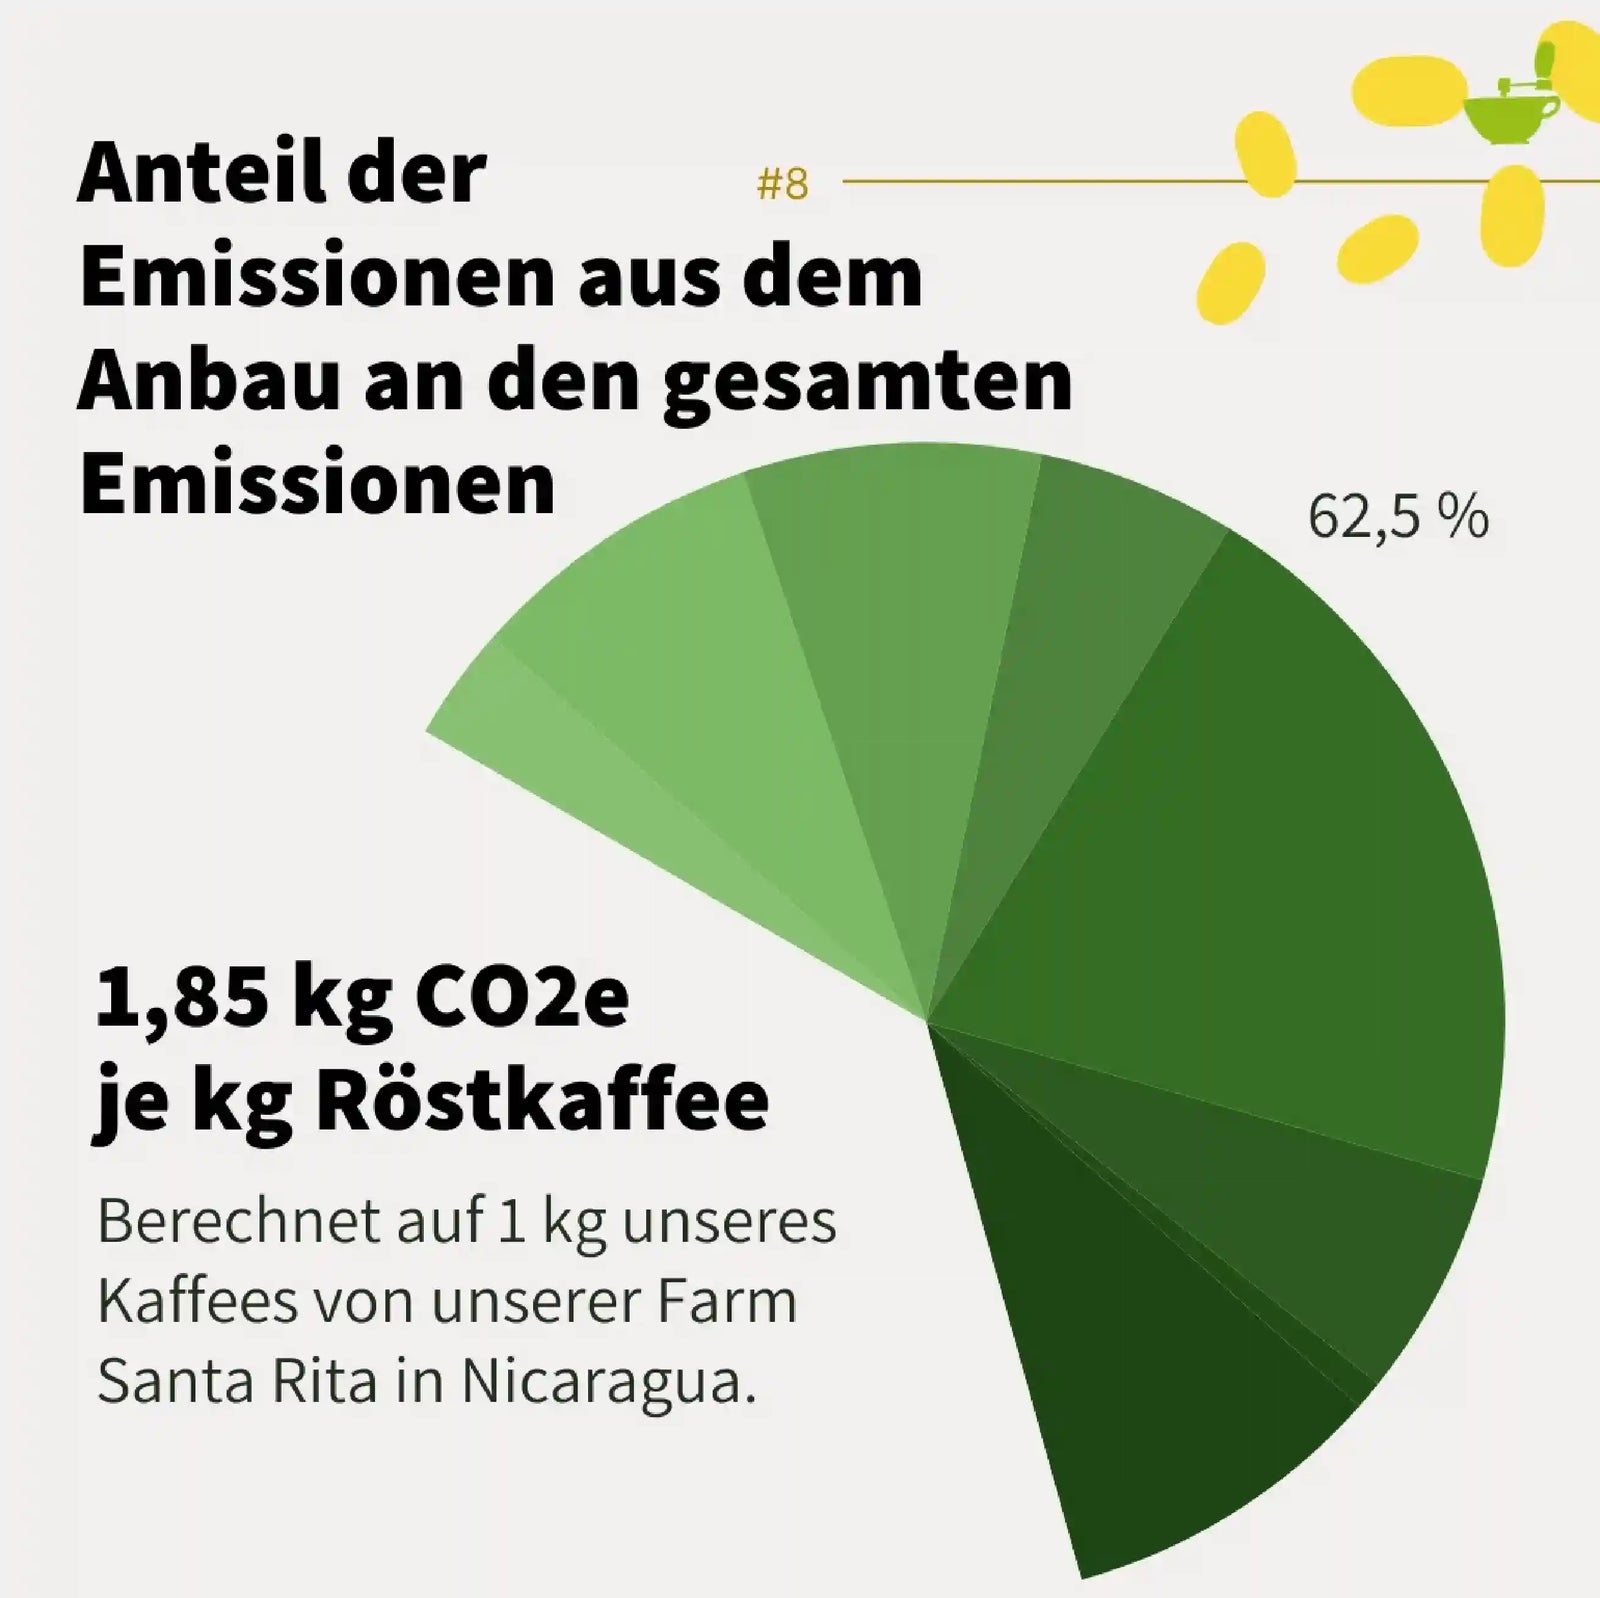
Wir haben die CO₂-Emissionen auf Santa Rita mit dem Cool Farm Tool berechnet. Mit 1,57 kg CO₂-Äquivalent je kg Rohkaffee schneidet die Farm gut ab. Ein Vergleichswert von Carbon Cloud liegt bei 3,96 kg CO₂-Äquivalent je kg Rohkaffee. Unsere Berechnung berücksichtigt bewusst nicht die Kohlenstoffsenke der Farm. Da wir, auch wenn es diese gibt, nicht garantieren können, dass der Wald so für die nächsten 50 - 100 Jahre stehen bleibt.
The share of transport in coffee emissions
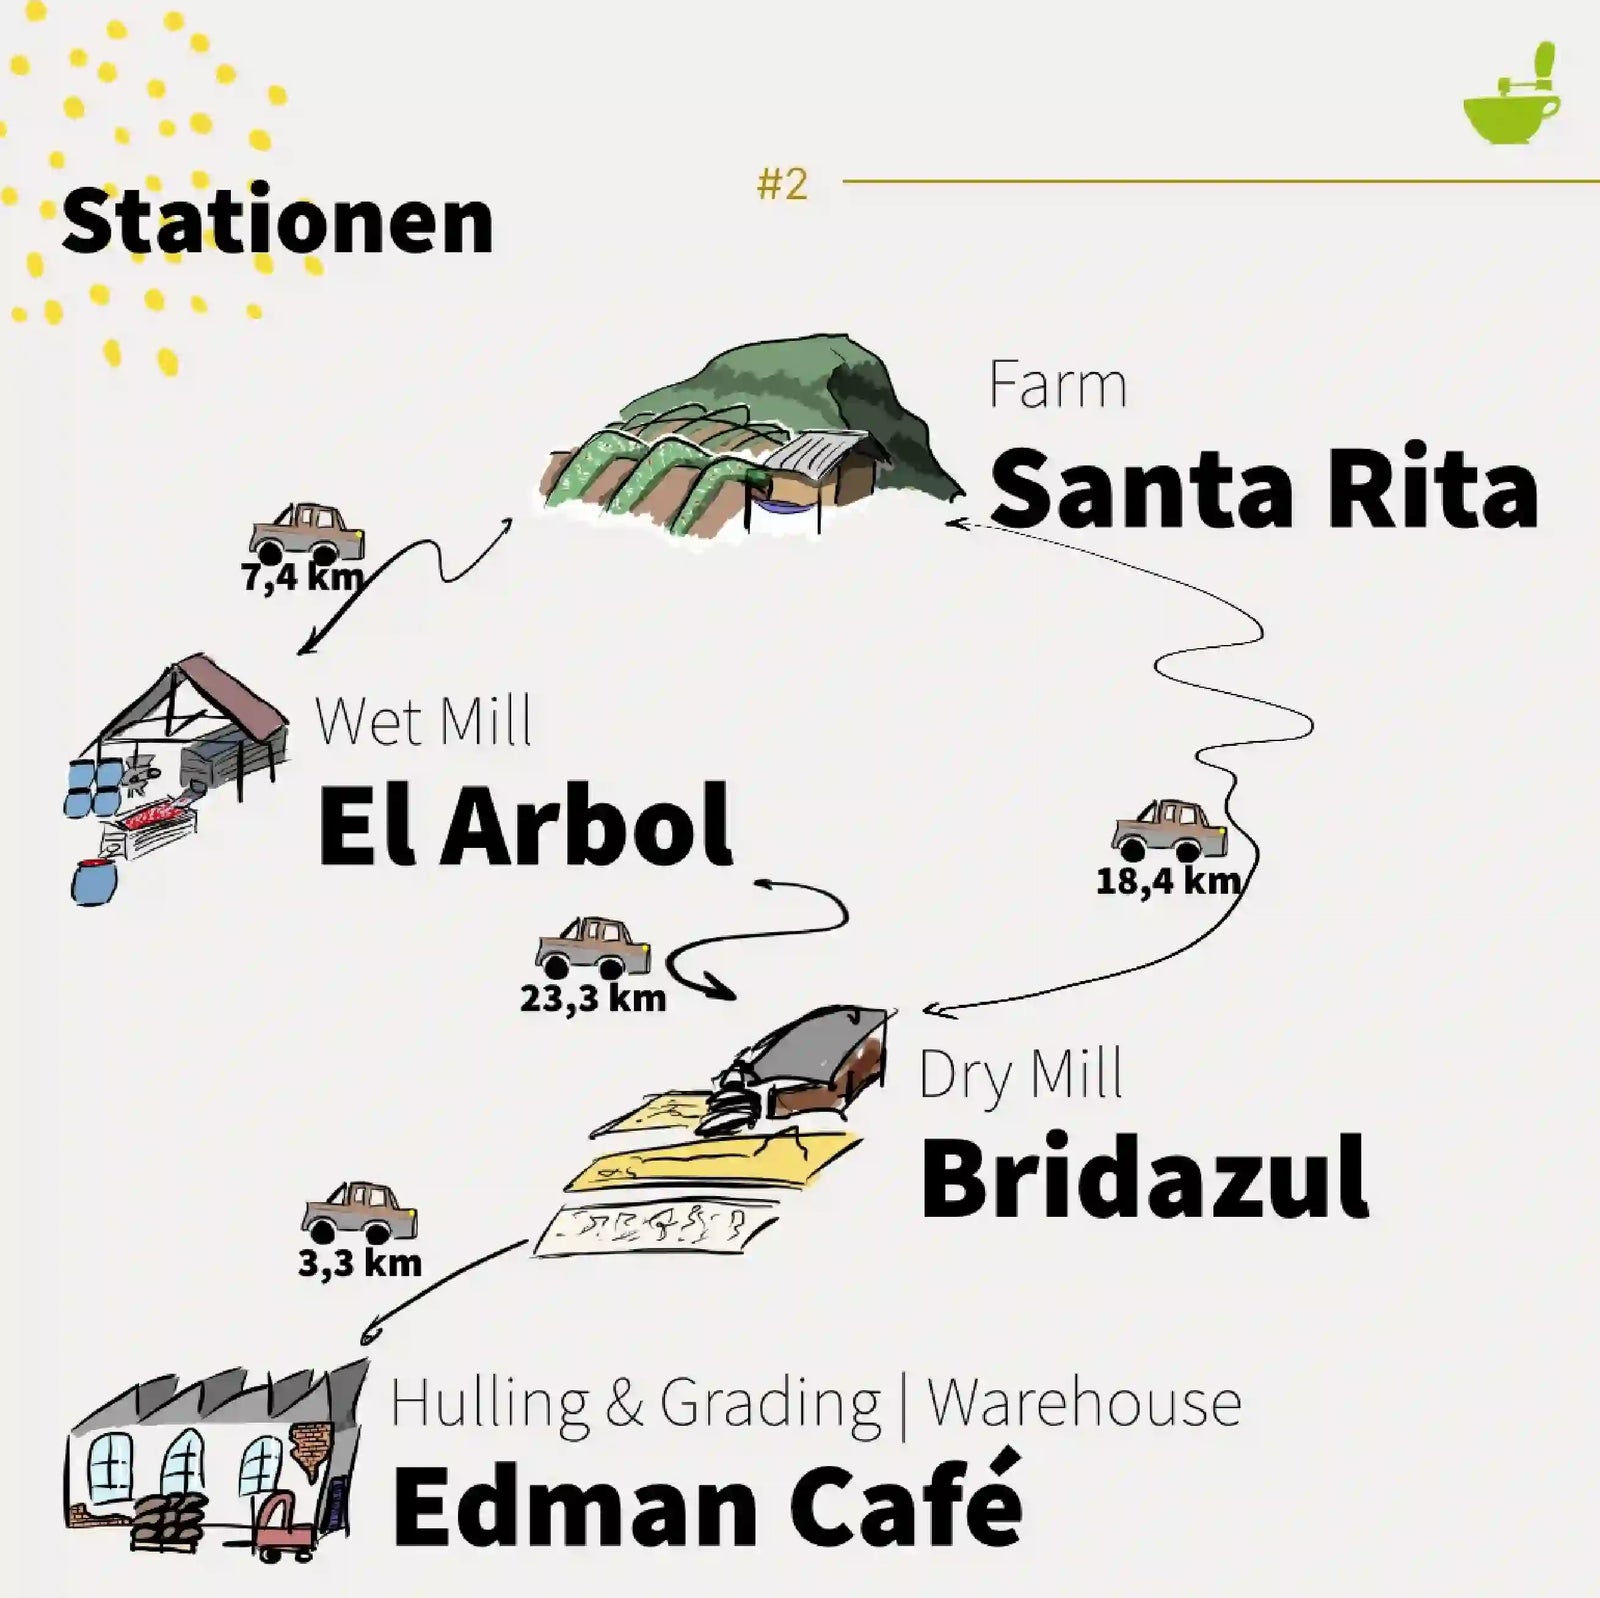
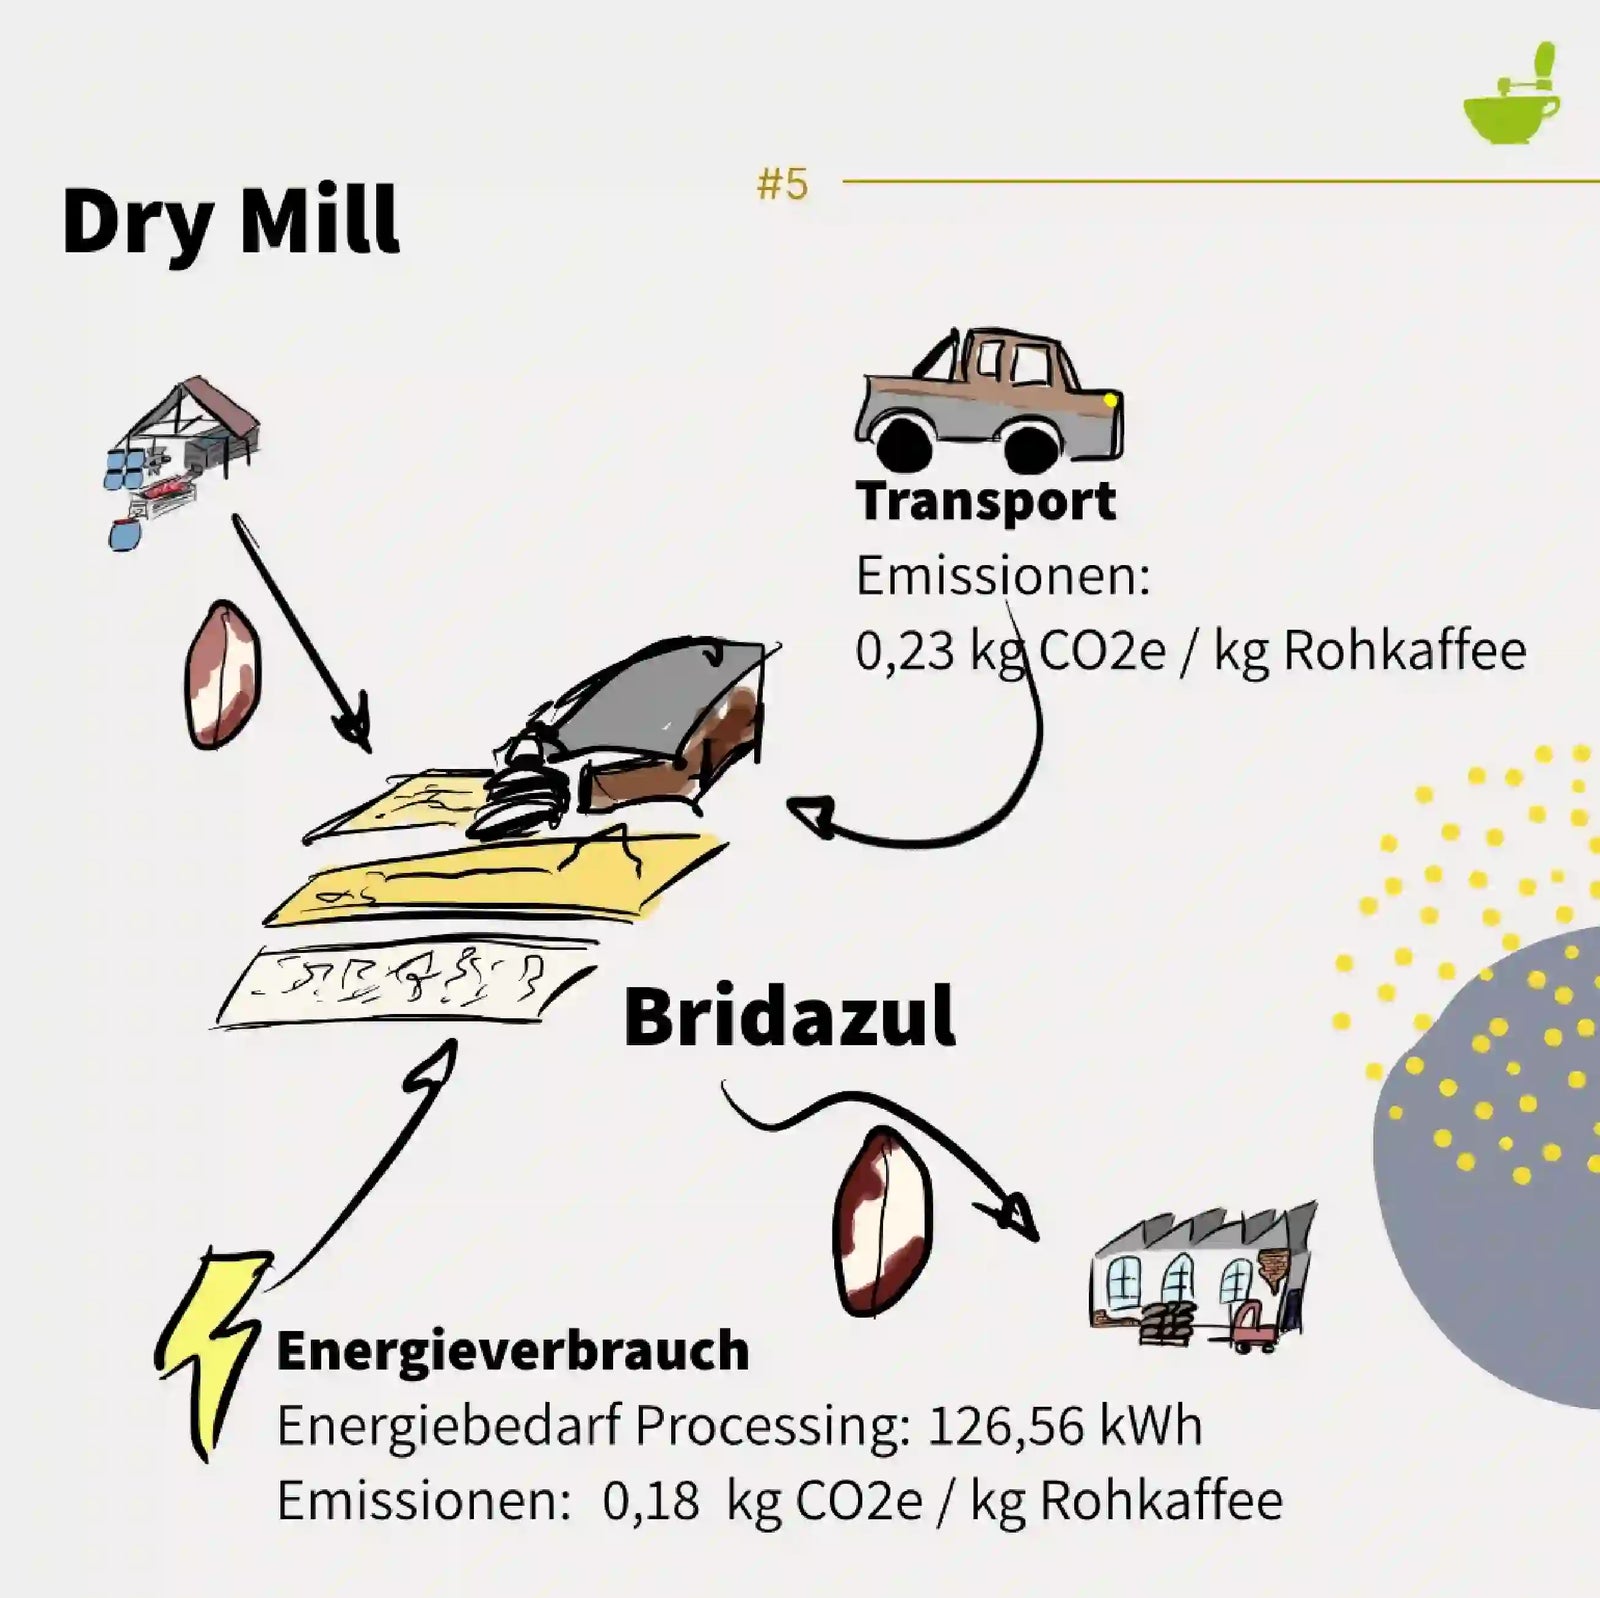
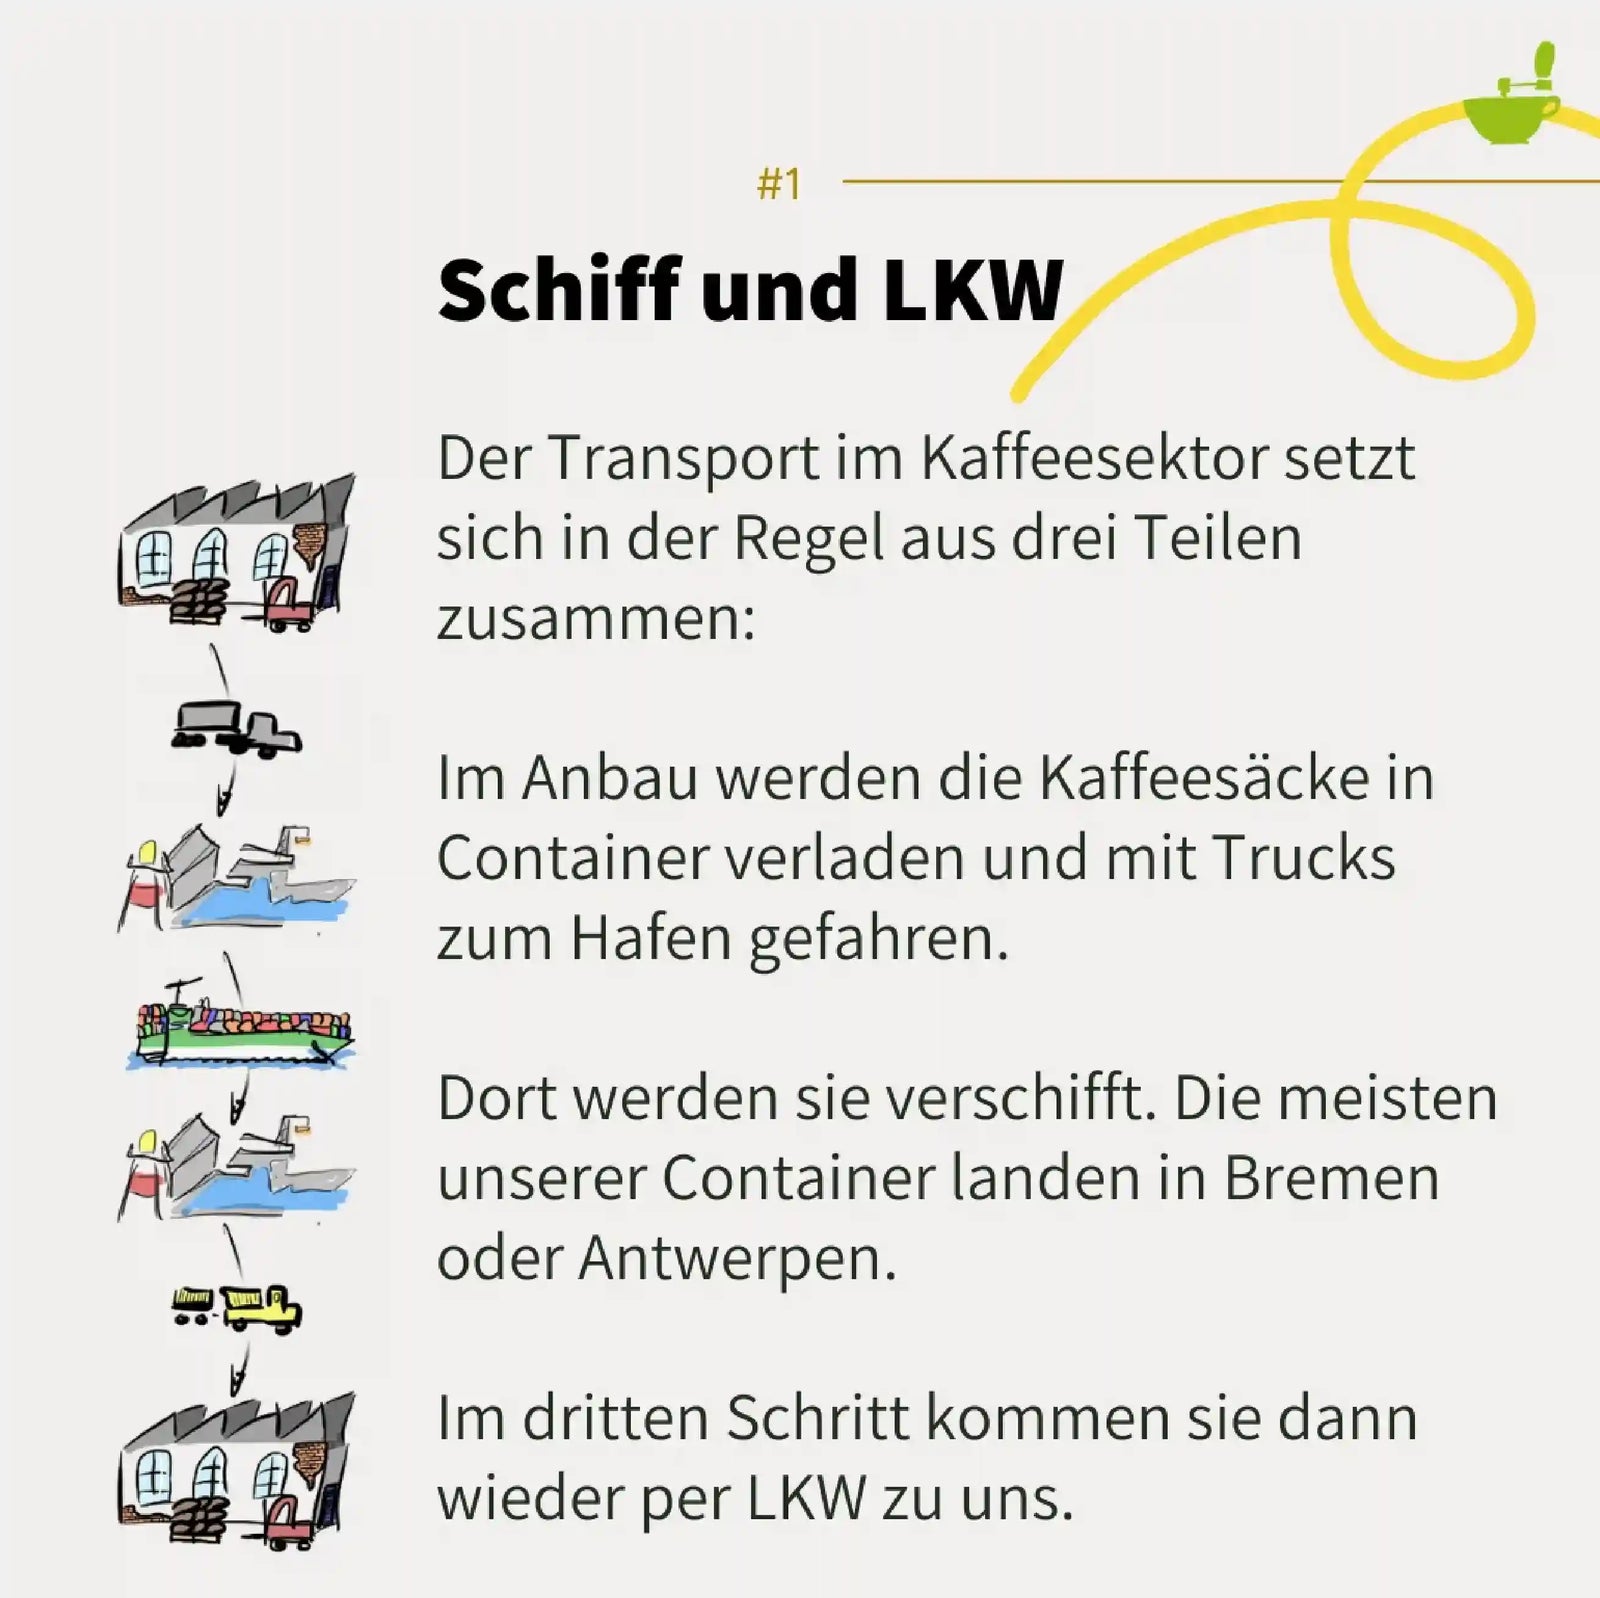
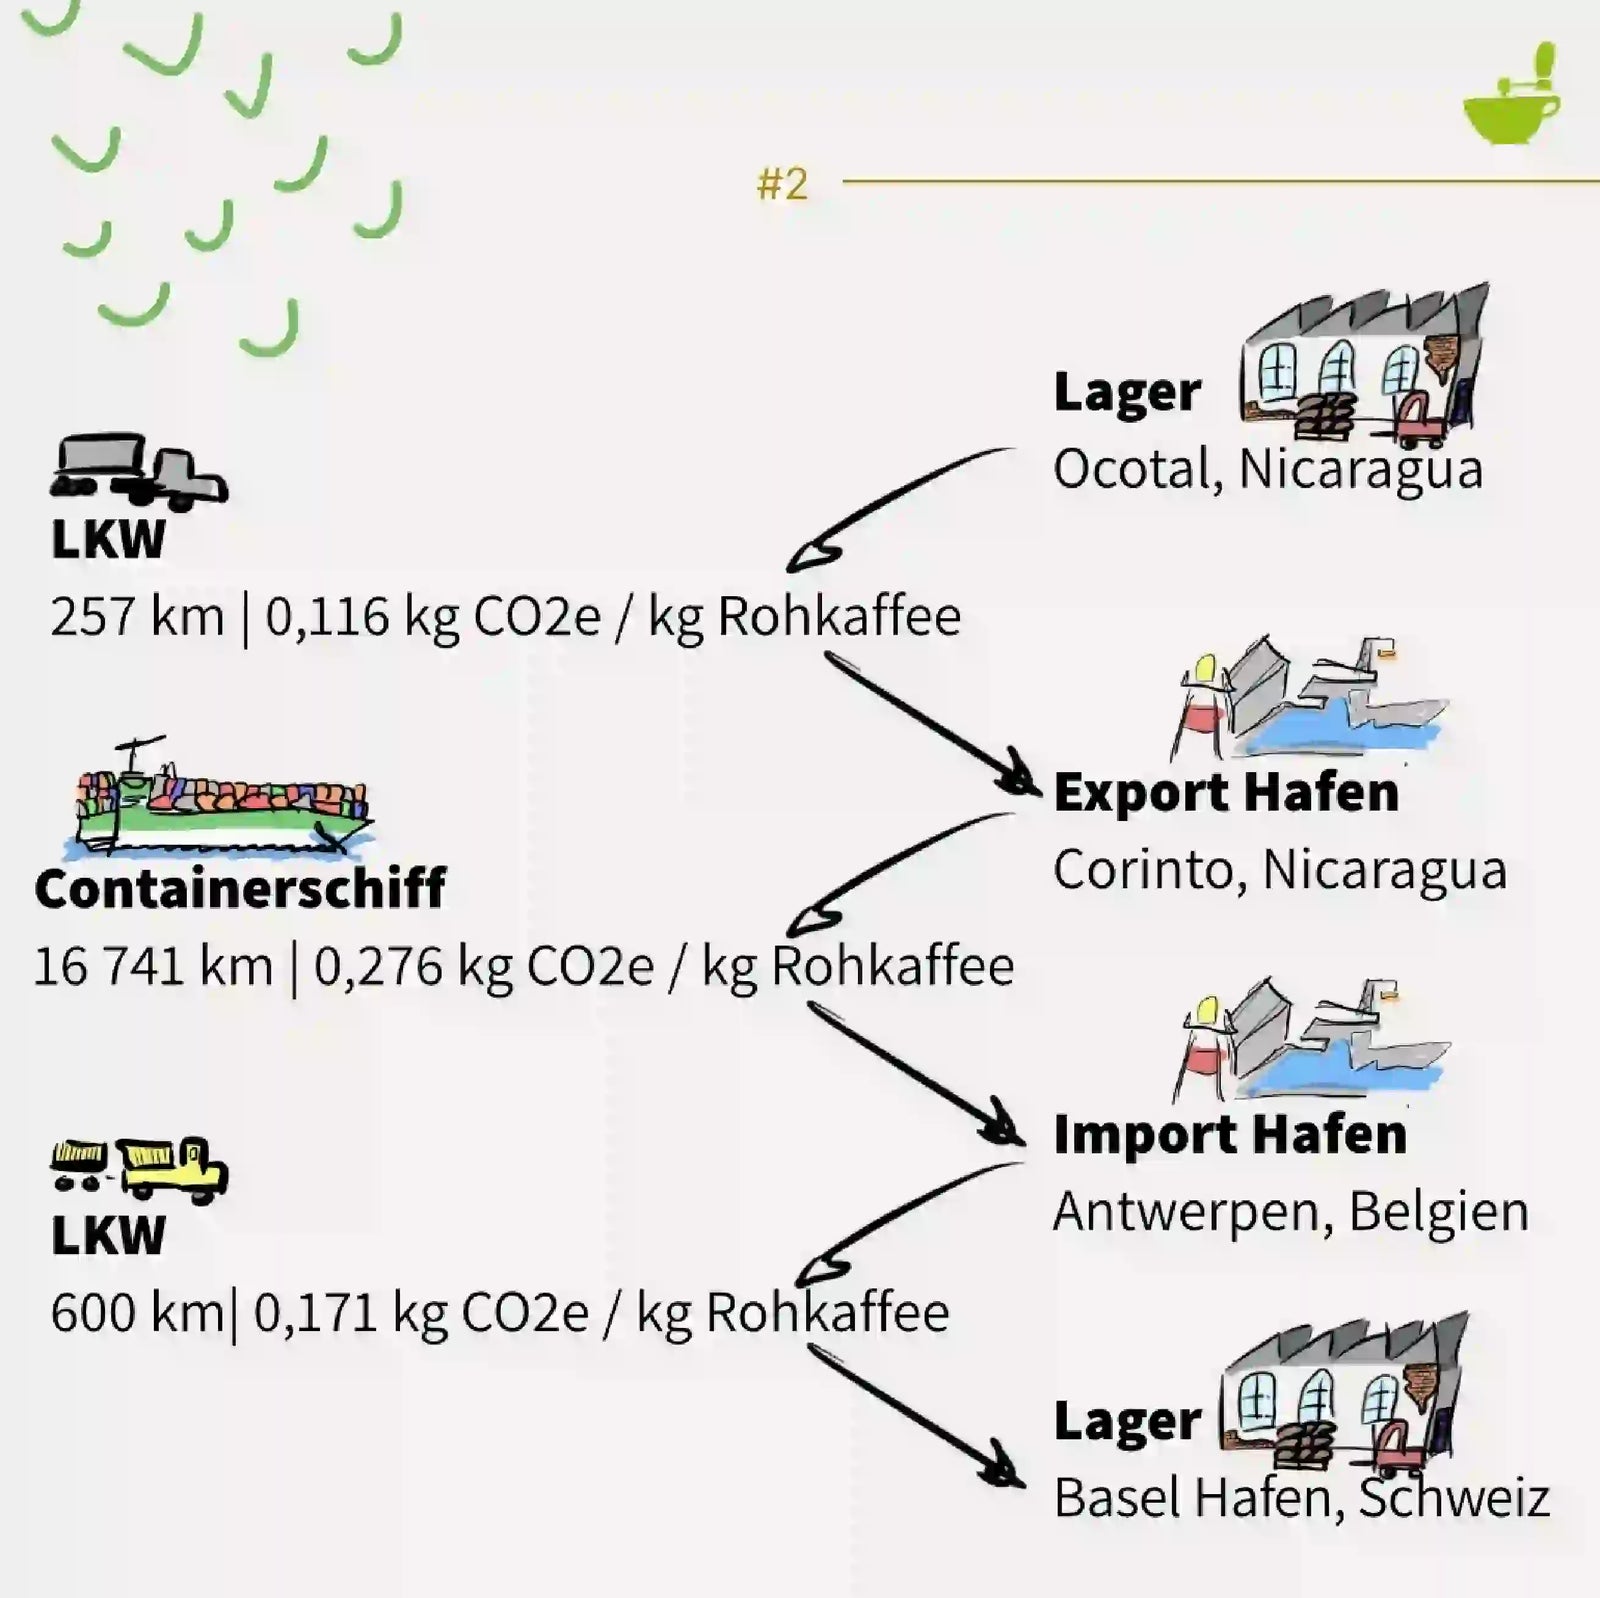
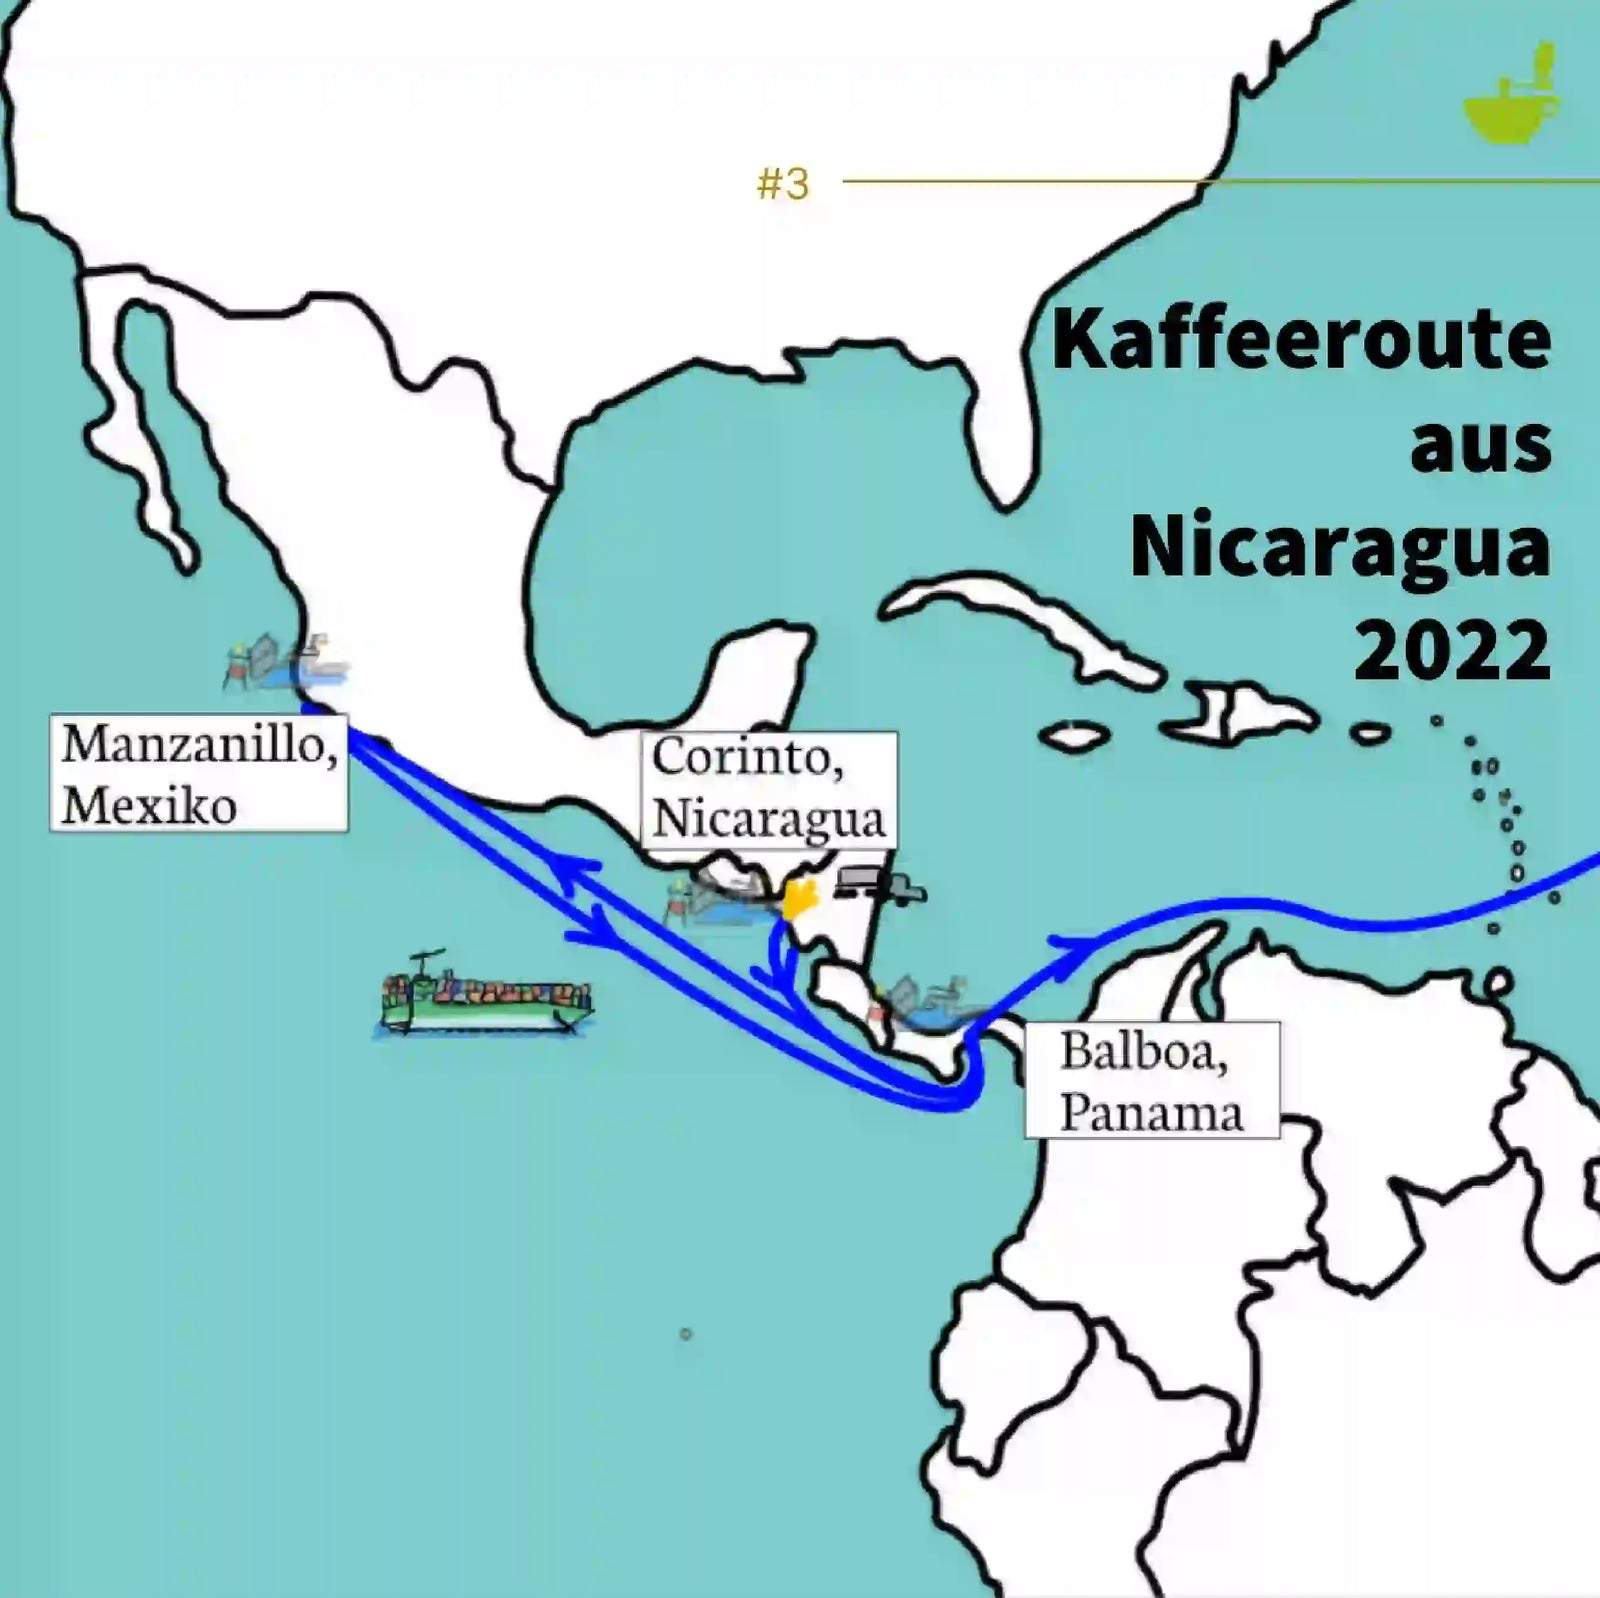
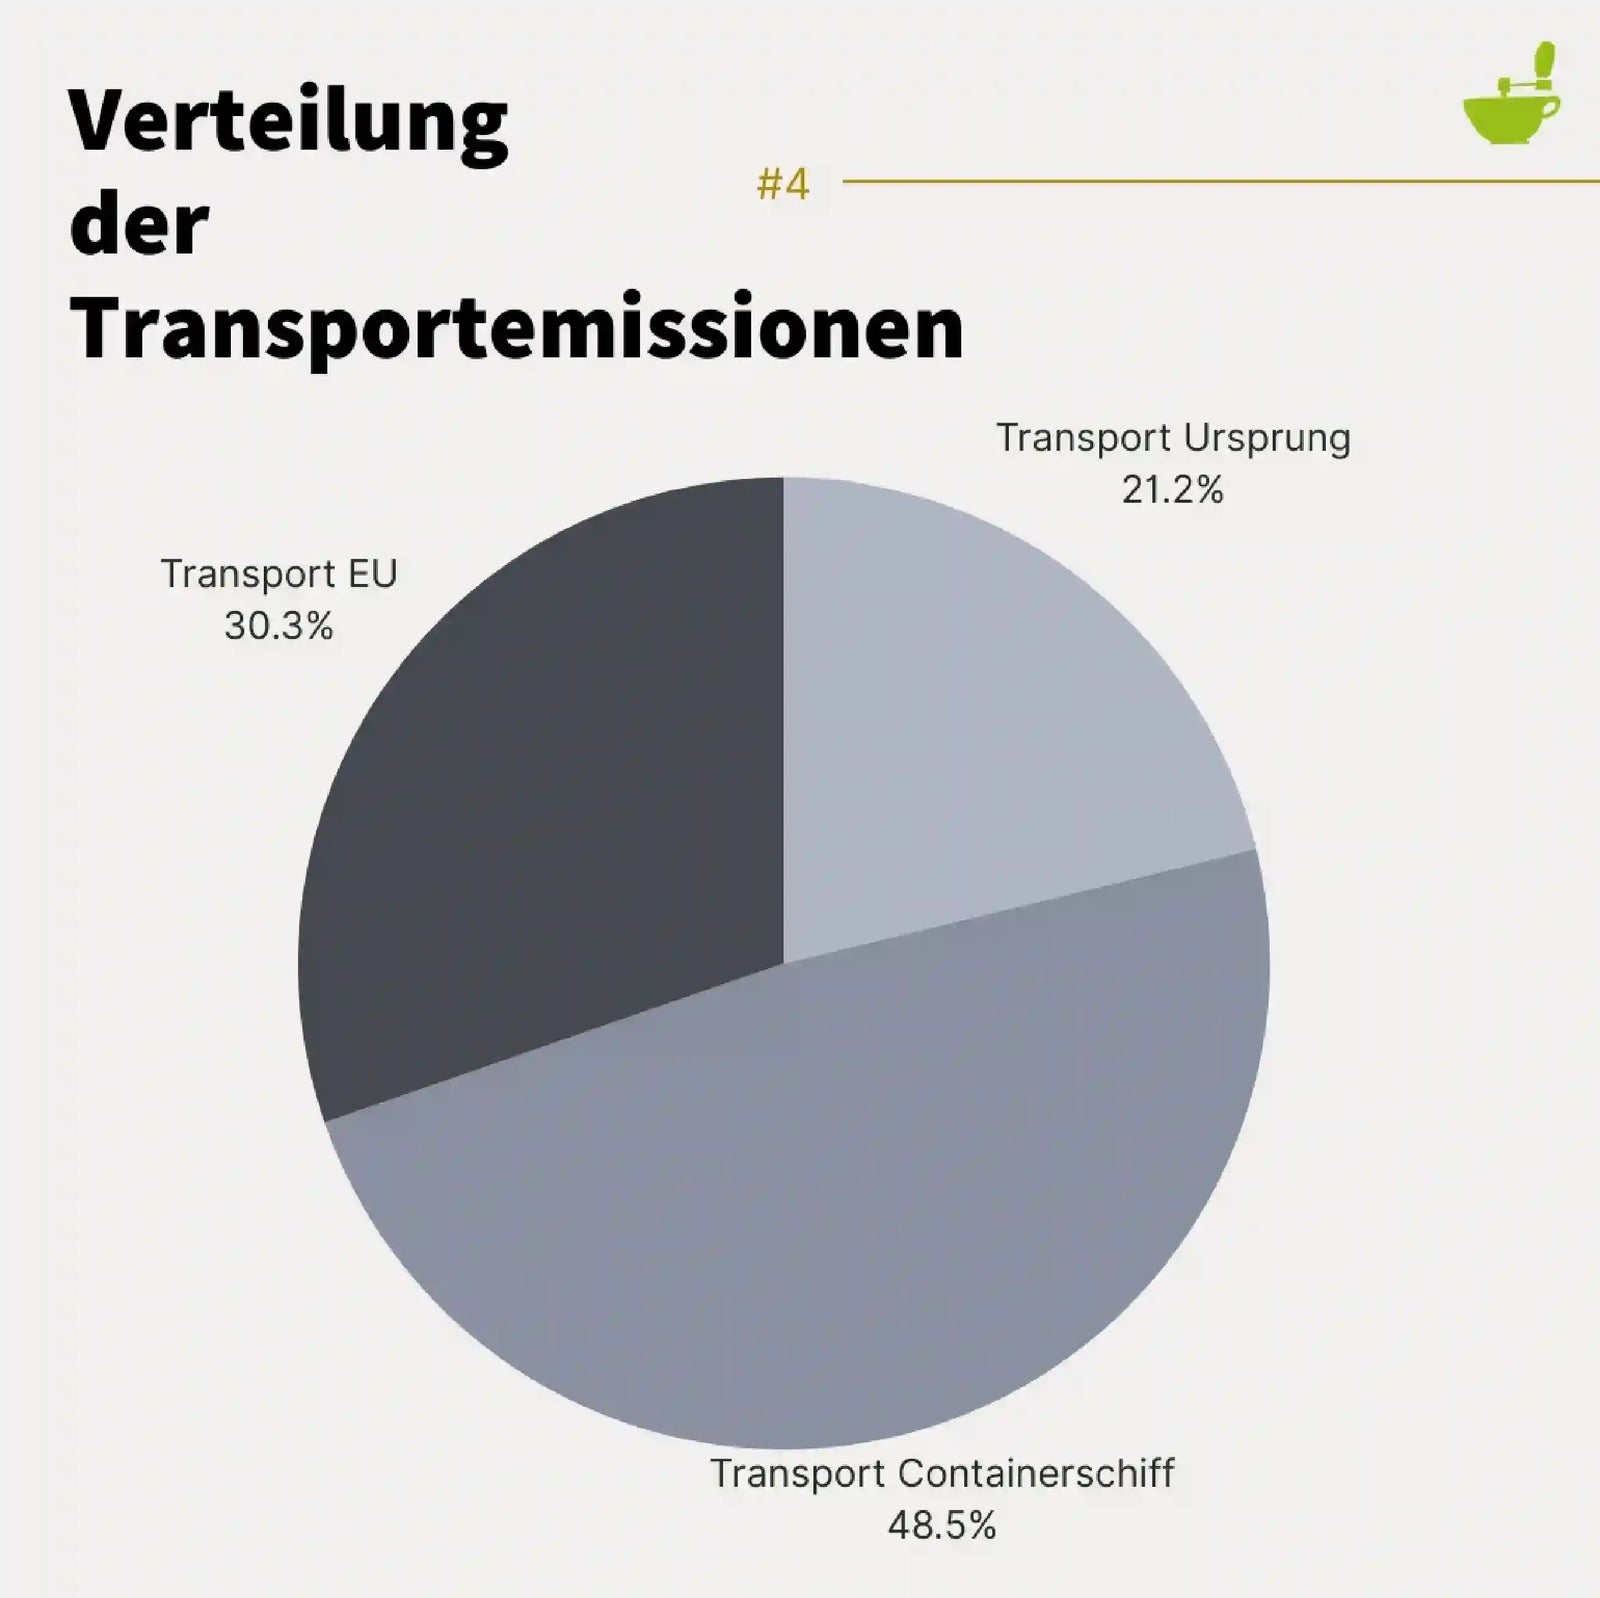
In unserer Betrachtung teilt sich der Transport in „Anbau zu Hafen“, „Hafen zu Hafen“ (Schiff- oder Flugtransport) und in „Hafen zu Rösterei“ auf.
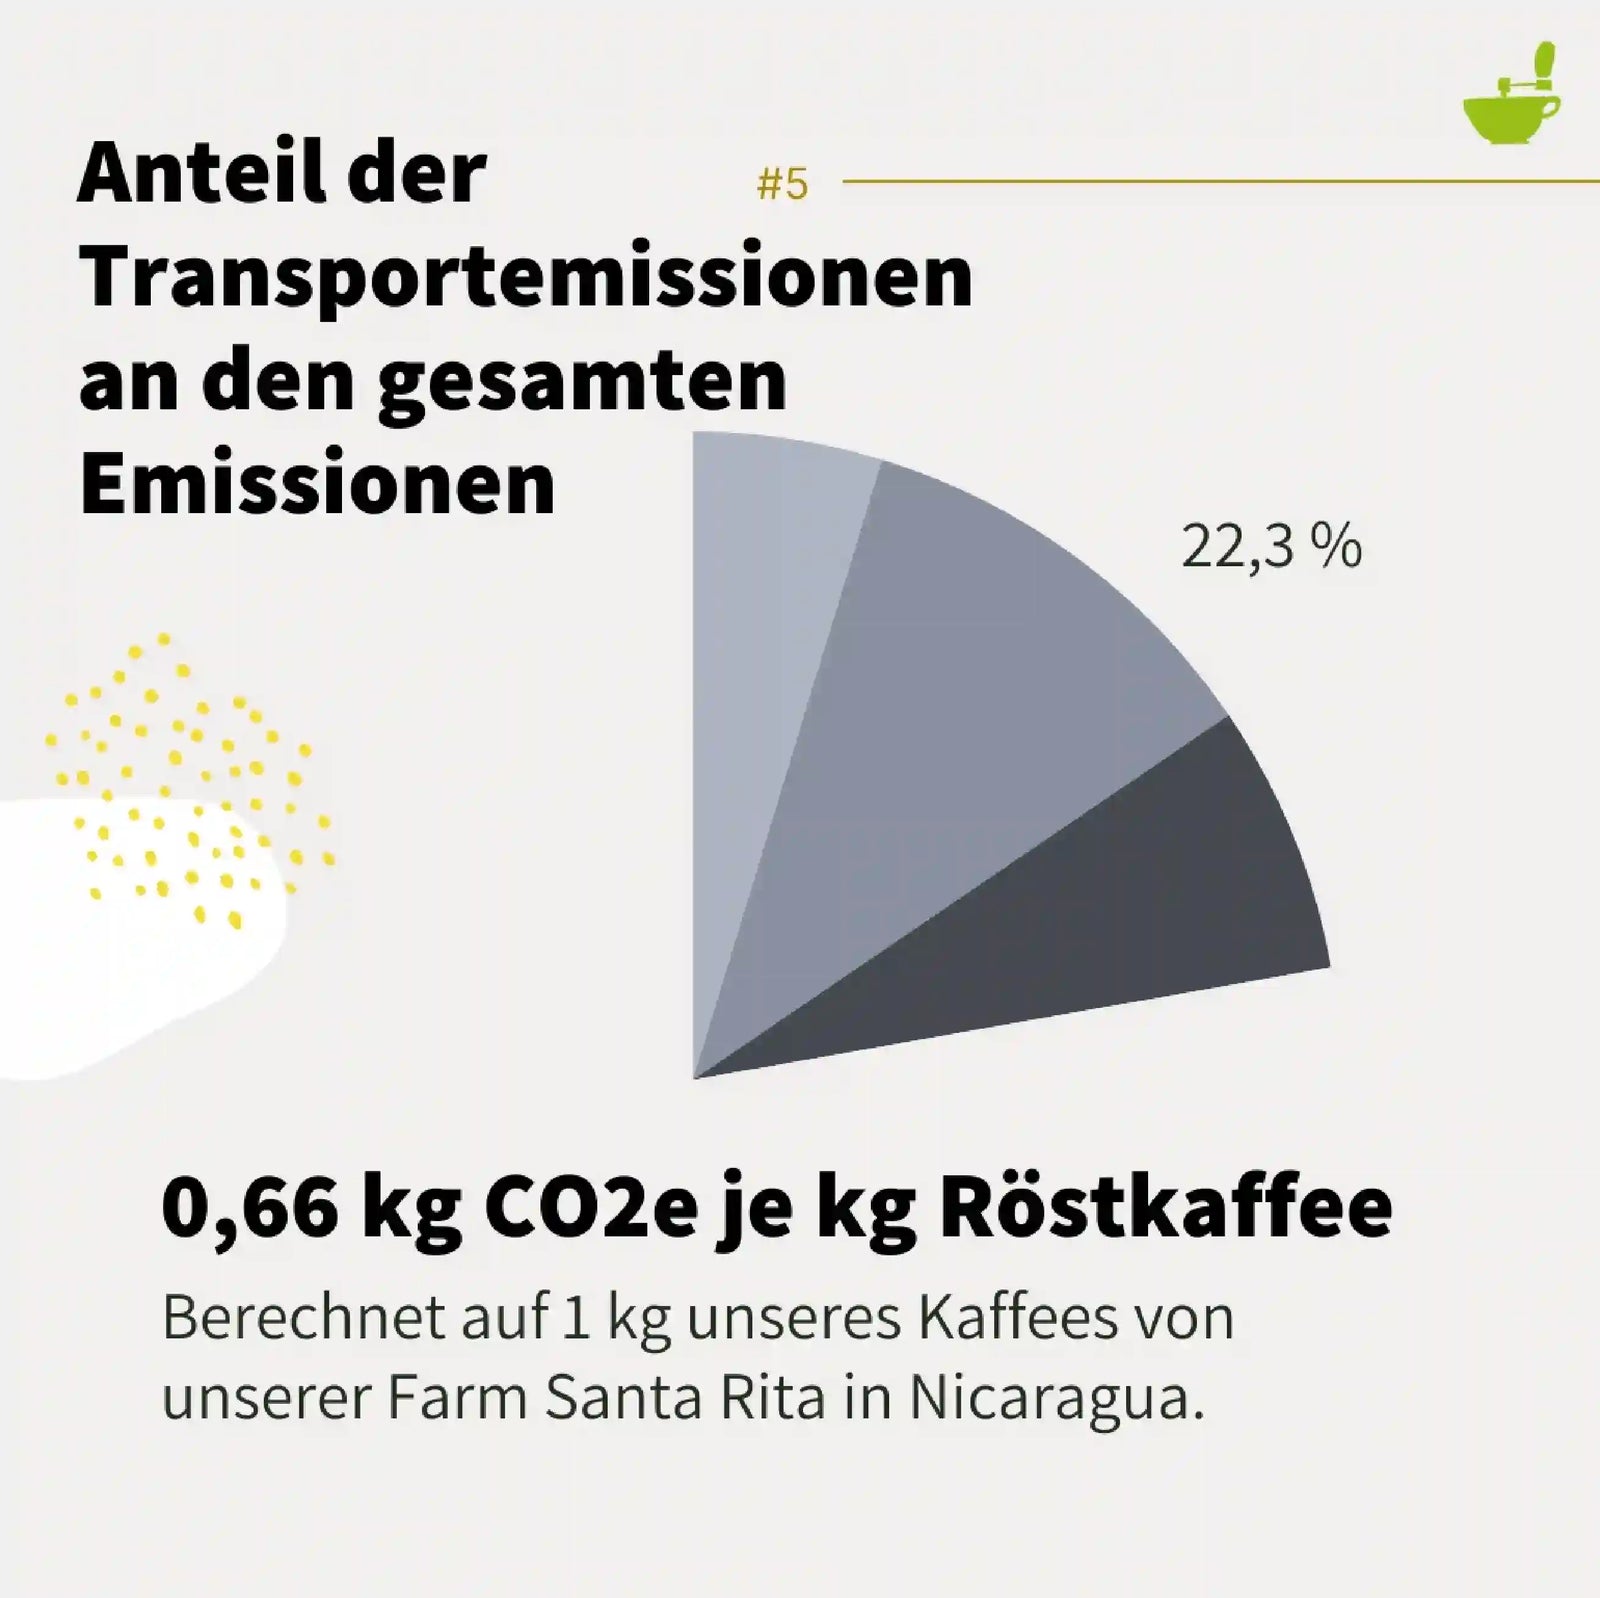
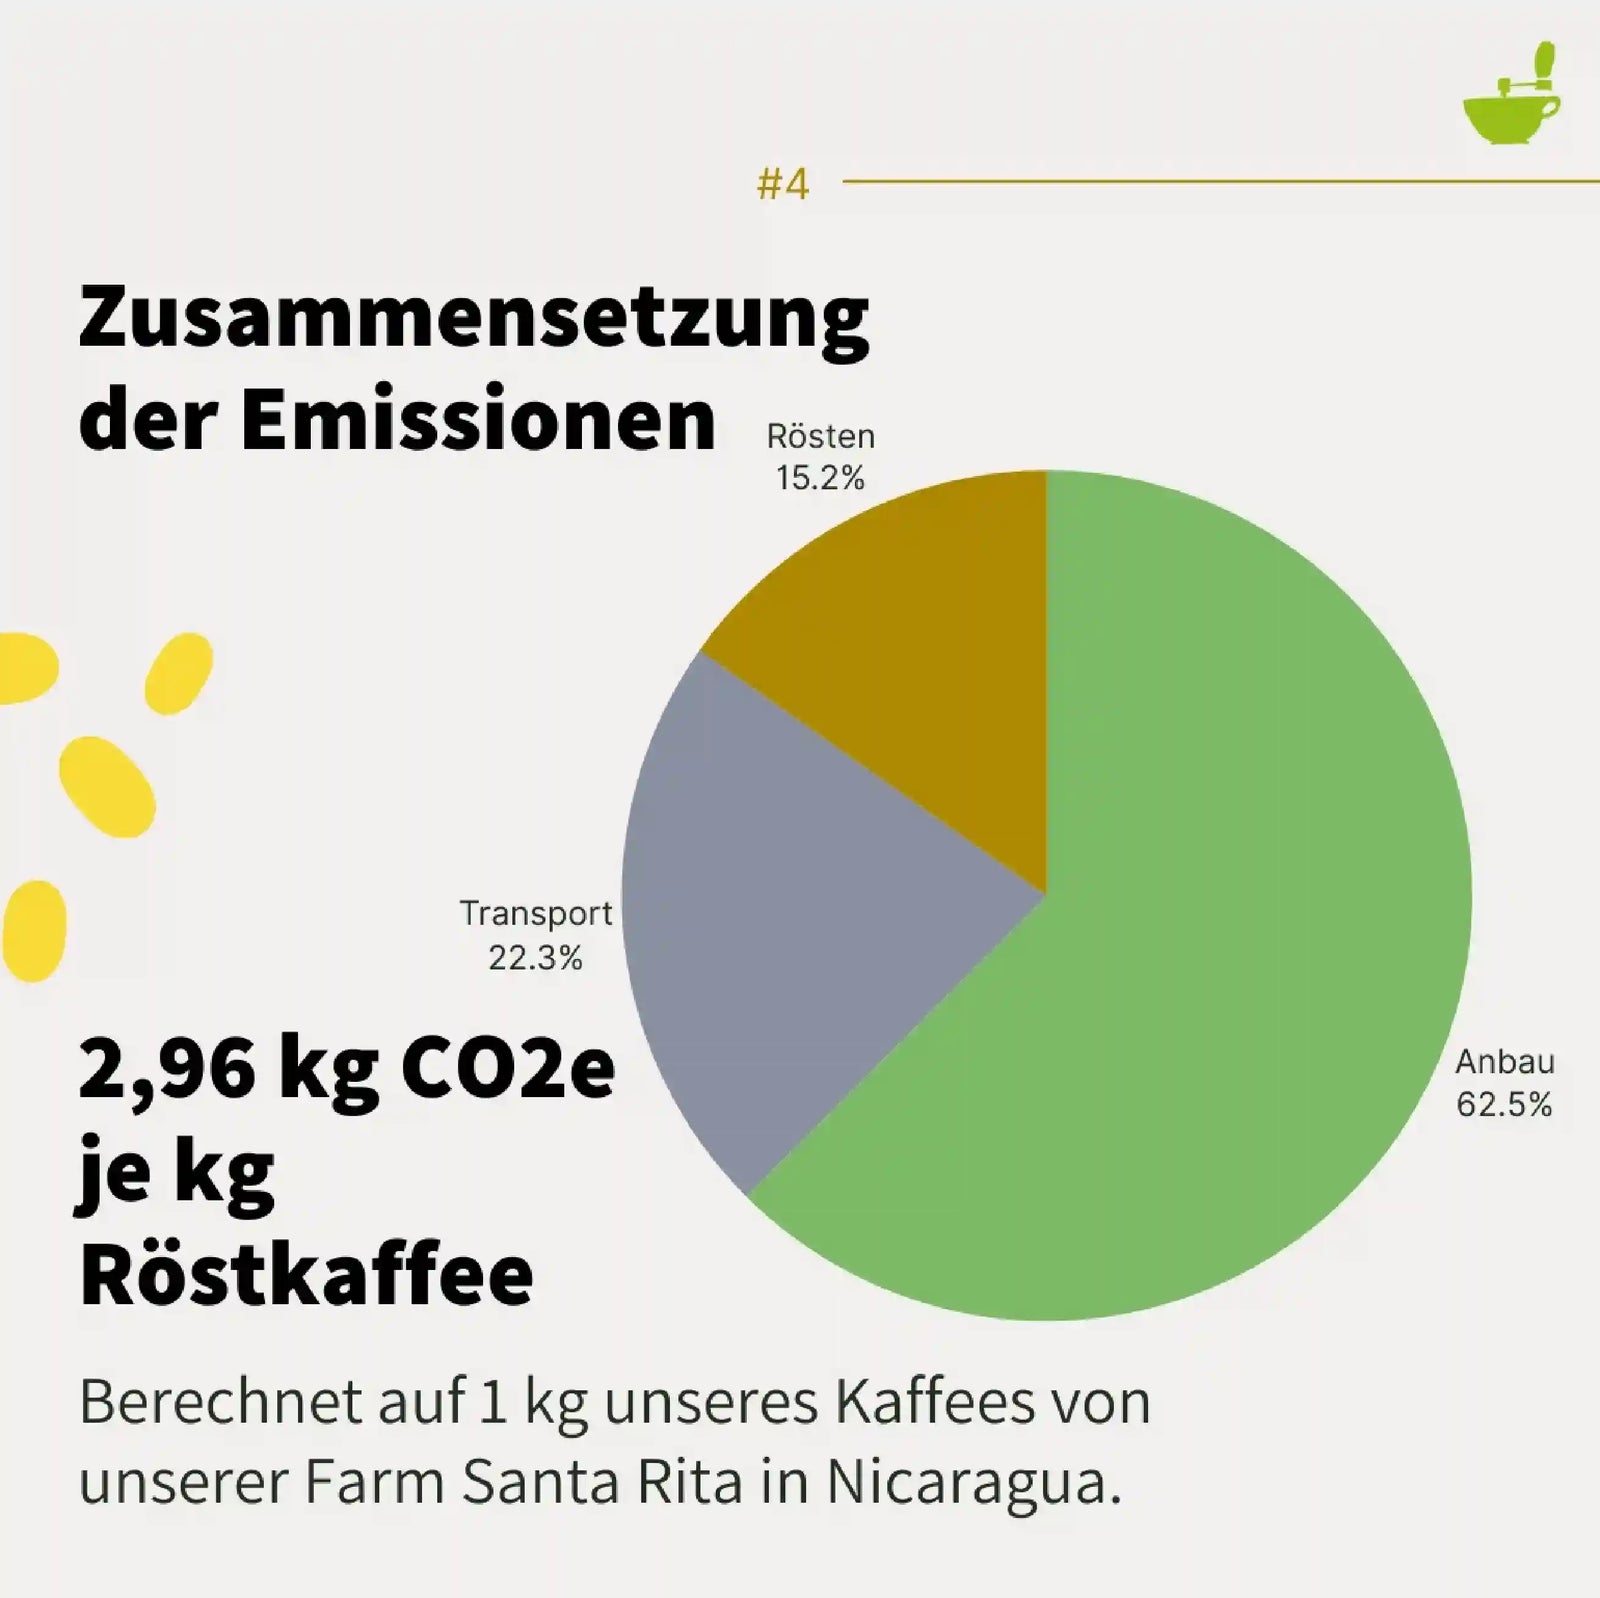
Diese drei Bereiche machen für unsere Kaffees ca. jeweils ein Drittel der Transport-Emissionen aus. Die wiederum bei dem Kaffee aus Nicaragua 22,3 % der gesamten Emissionen ausmachen.
Für die Berechnung haben wir einen einfachen CO₂-Rechner erstellt. Er basiert auf den Daten des Mobitool und kann für jeglichen Versand angewendet. Ob Kaffee, Kakao oder Avocado, Tomaten. Die Berechnung basiert immer auf dem Gewicht des Versandguts.
Der Fußabdruck unserer Rösterei
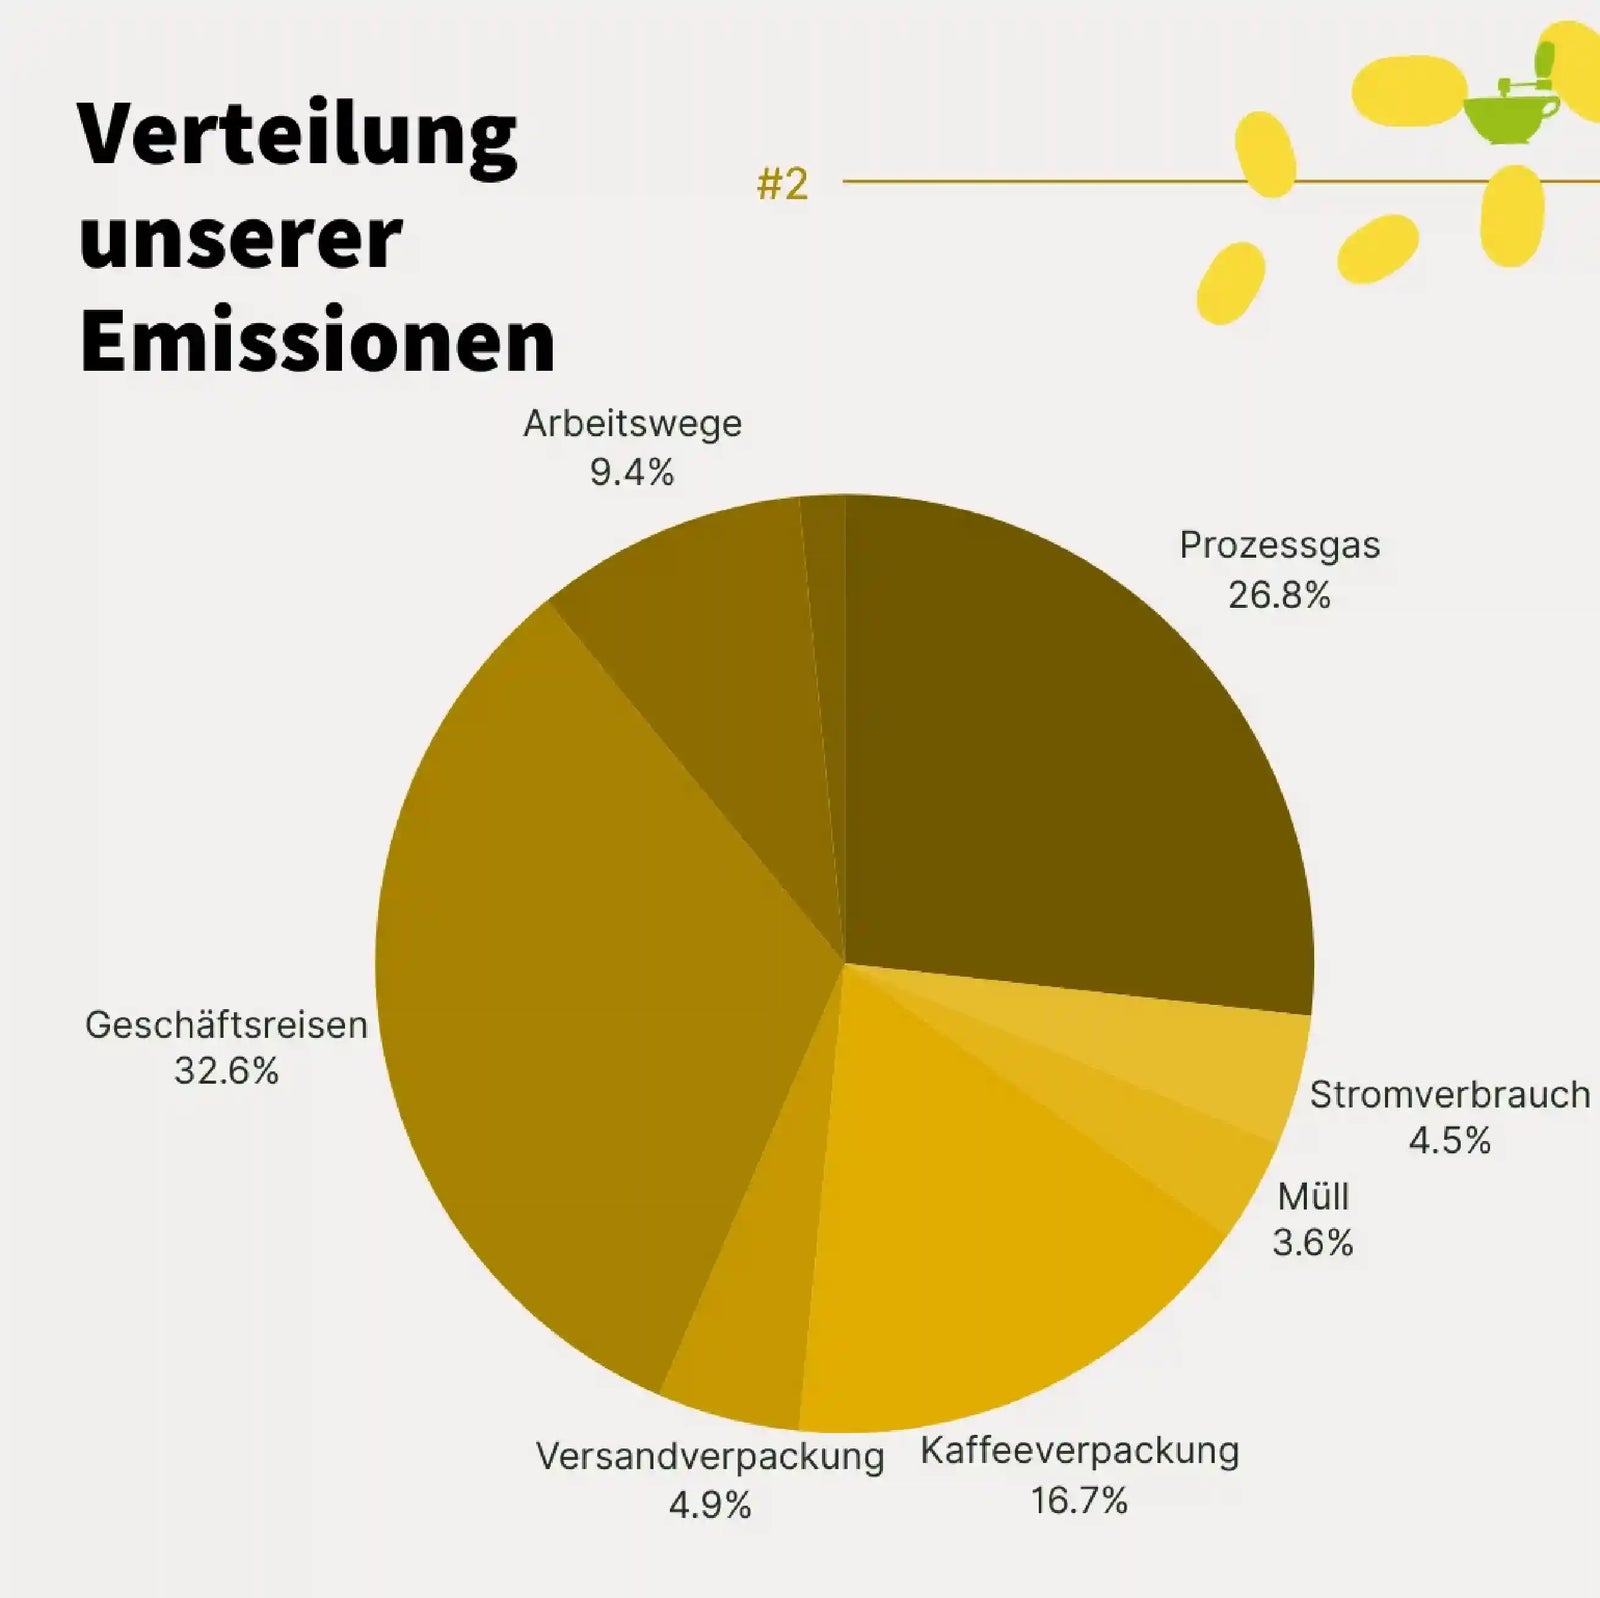
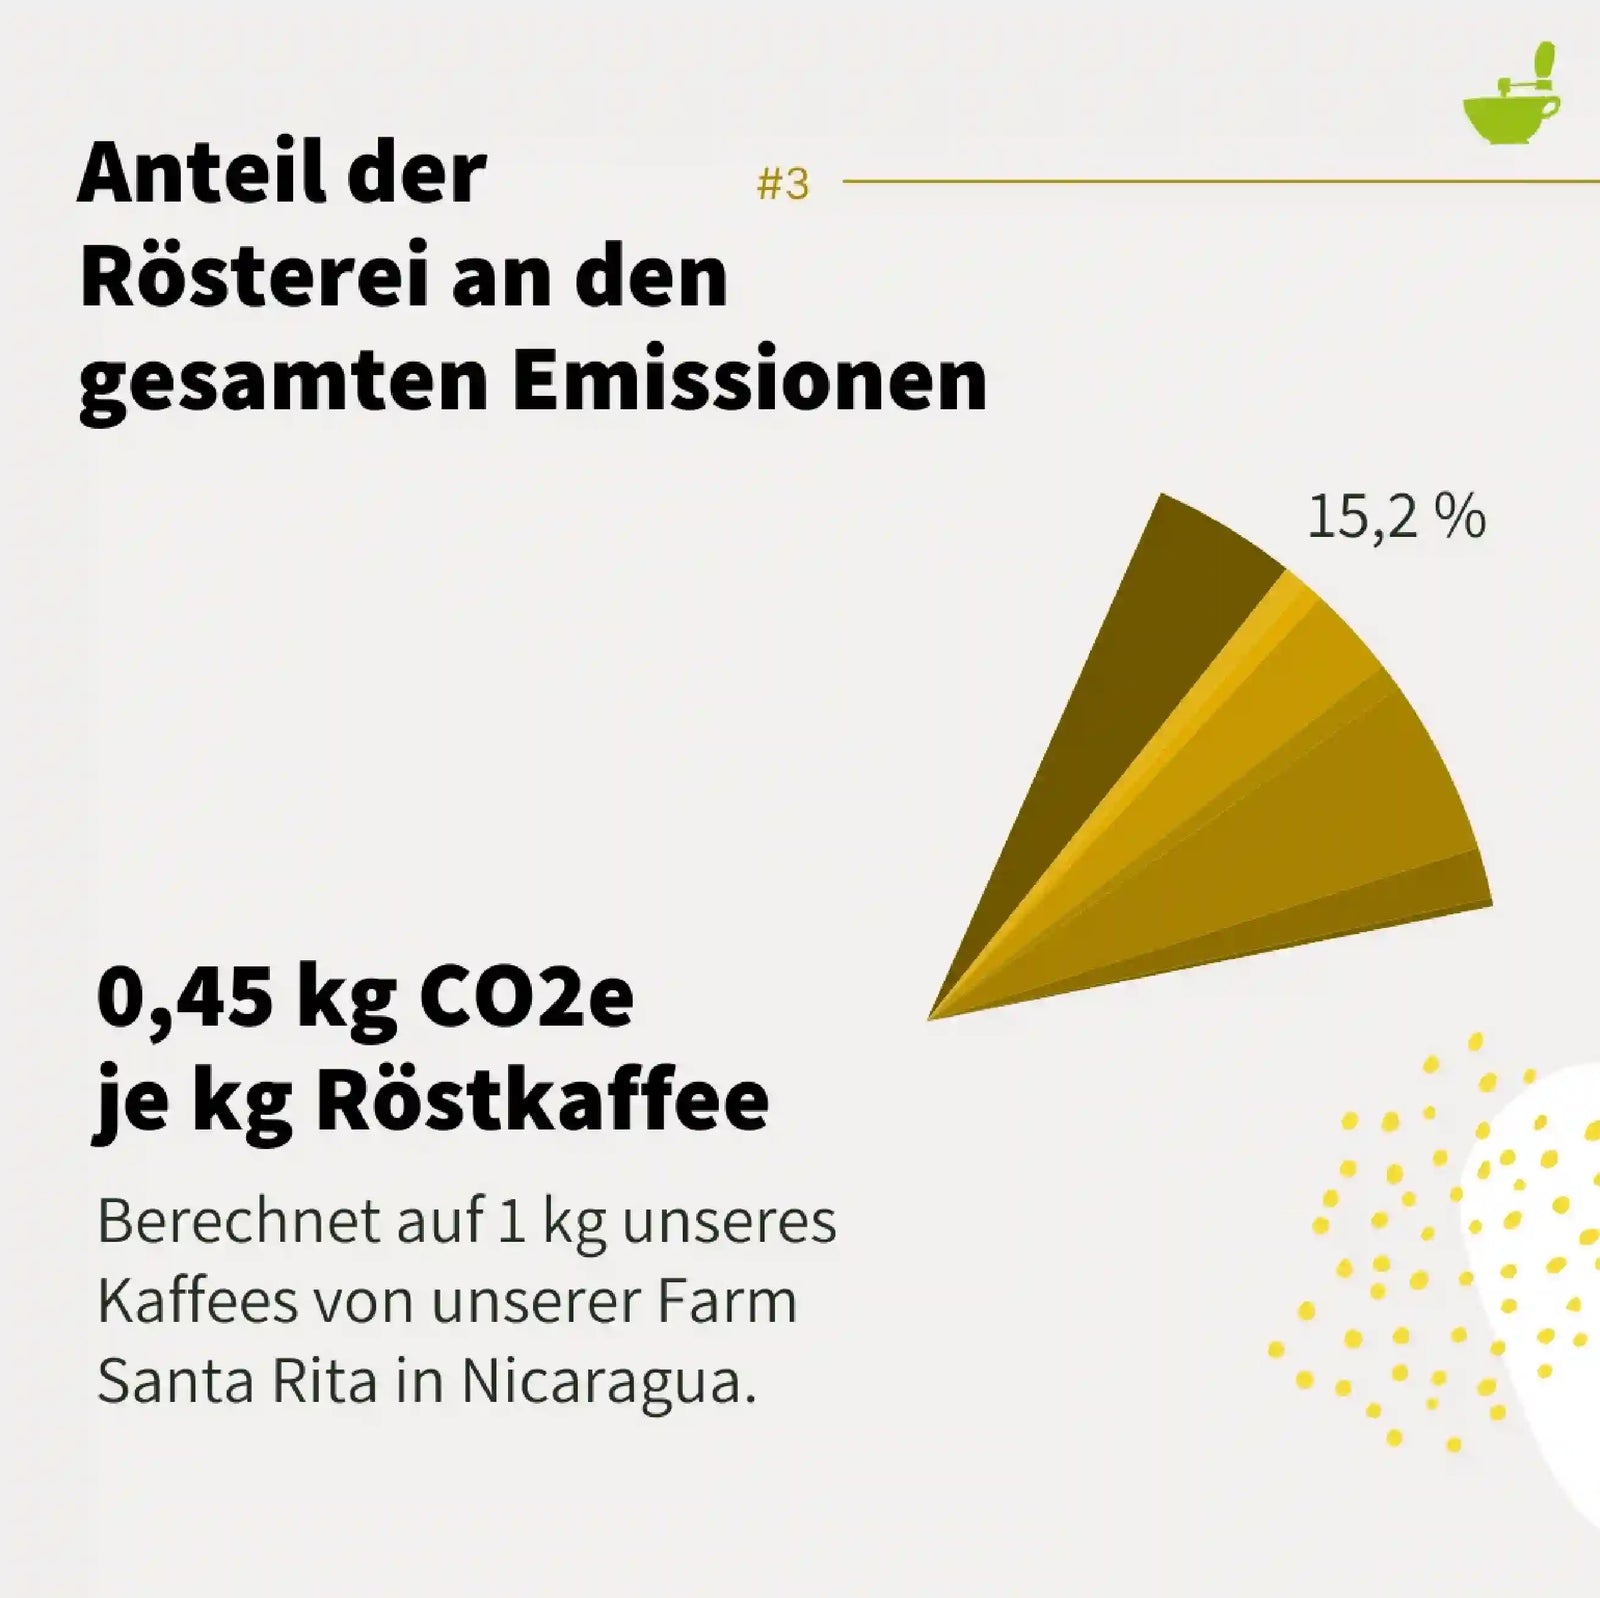
Die Kaffeemacher Rösterei in Basel röstete 2022 knapp 50 t Rohkaffee geröstet. Damit sind 22,12 t CO₂-Äquivalente entstanden. Auf ein Kilogramm Kaffee heruntergebrochen sind das immer noch 0,45 kg CO2e / kg Röstkaffee und somit auf den Kaffee von Santa Rita 15,2 %. Die größten Faktoren des Rösterei-Fußabdrucks sind Gasverbrauch fürs Rösten, Verpackung und Geschäftsreisen in den Ursprung.
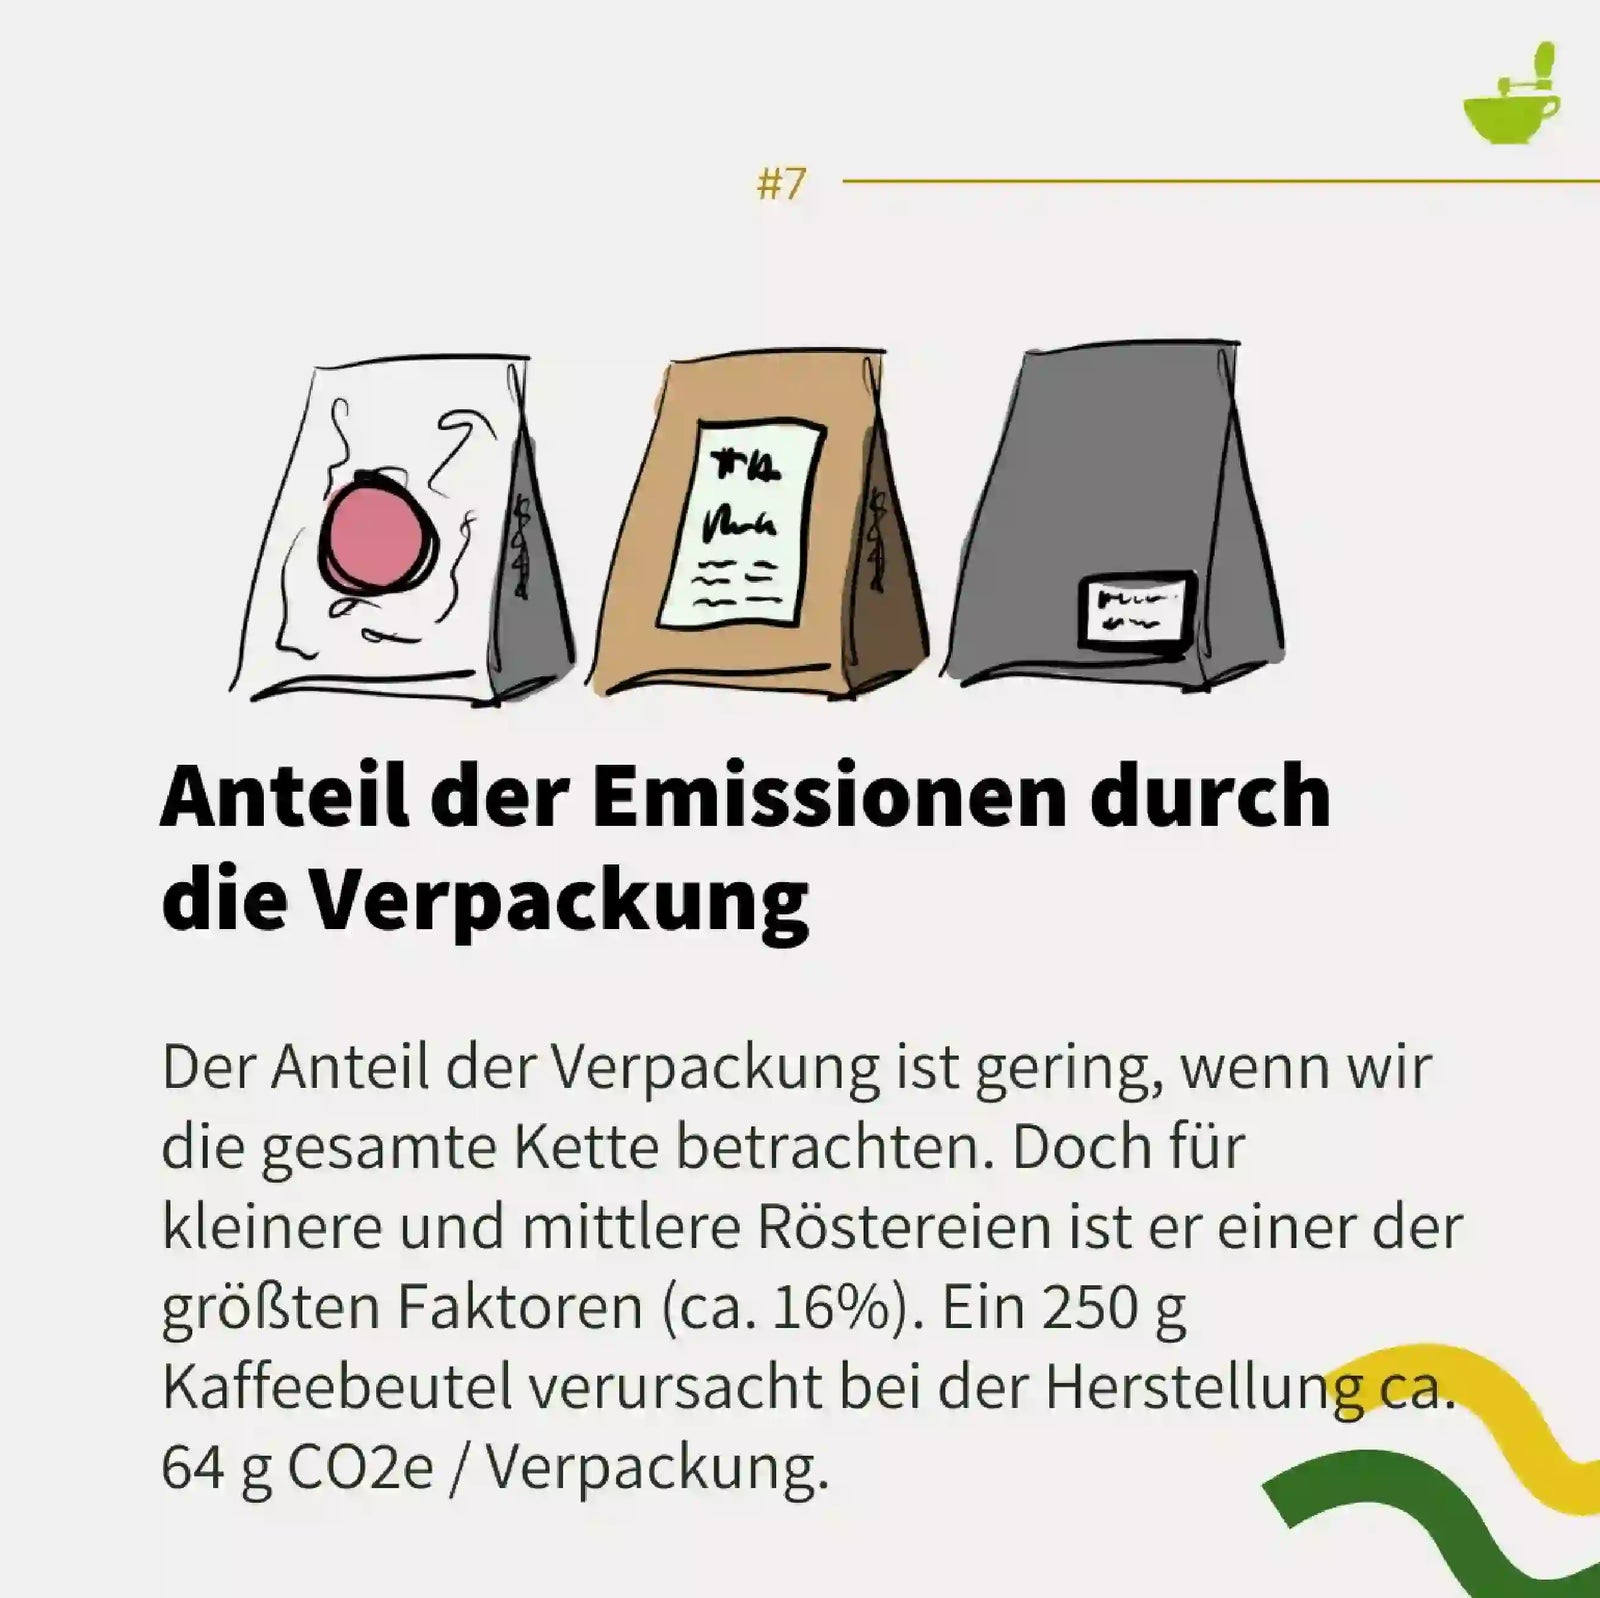
Ein 250g Mono-Kunststoff-Beutel verursacht in der Herstellung ca. 64 g CO2- Äquivalente. Geht der Beutel in die Verbrennung, kann dieser Wert ungefähr verdoppelt werden.
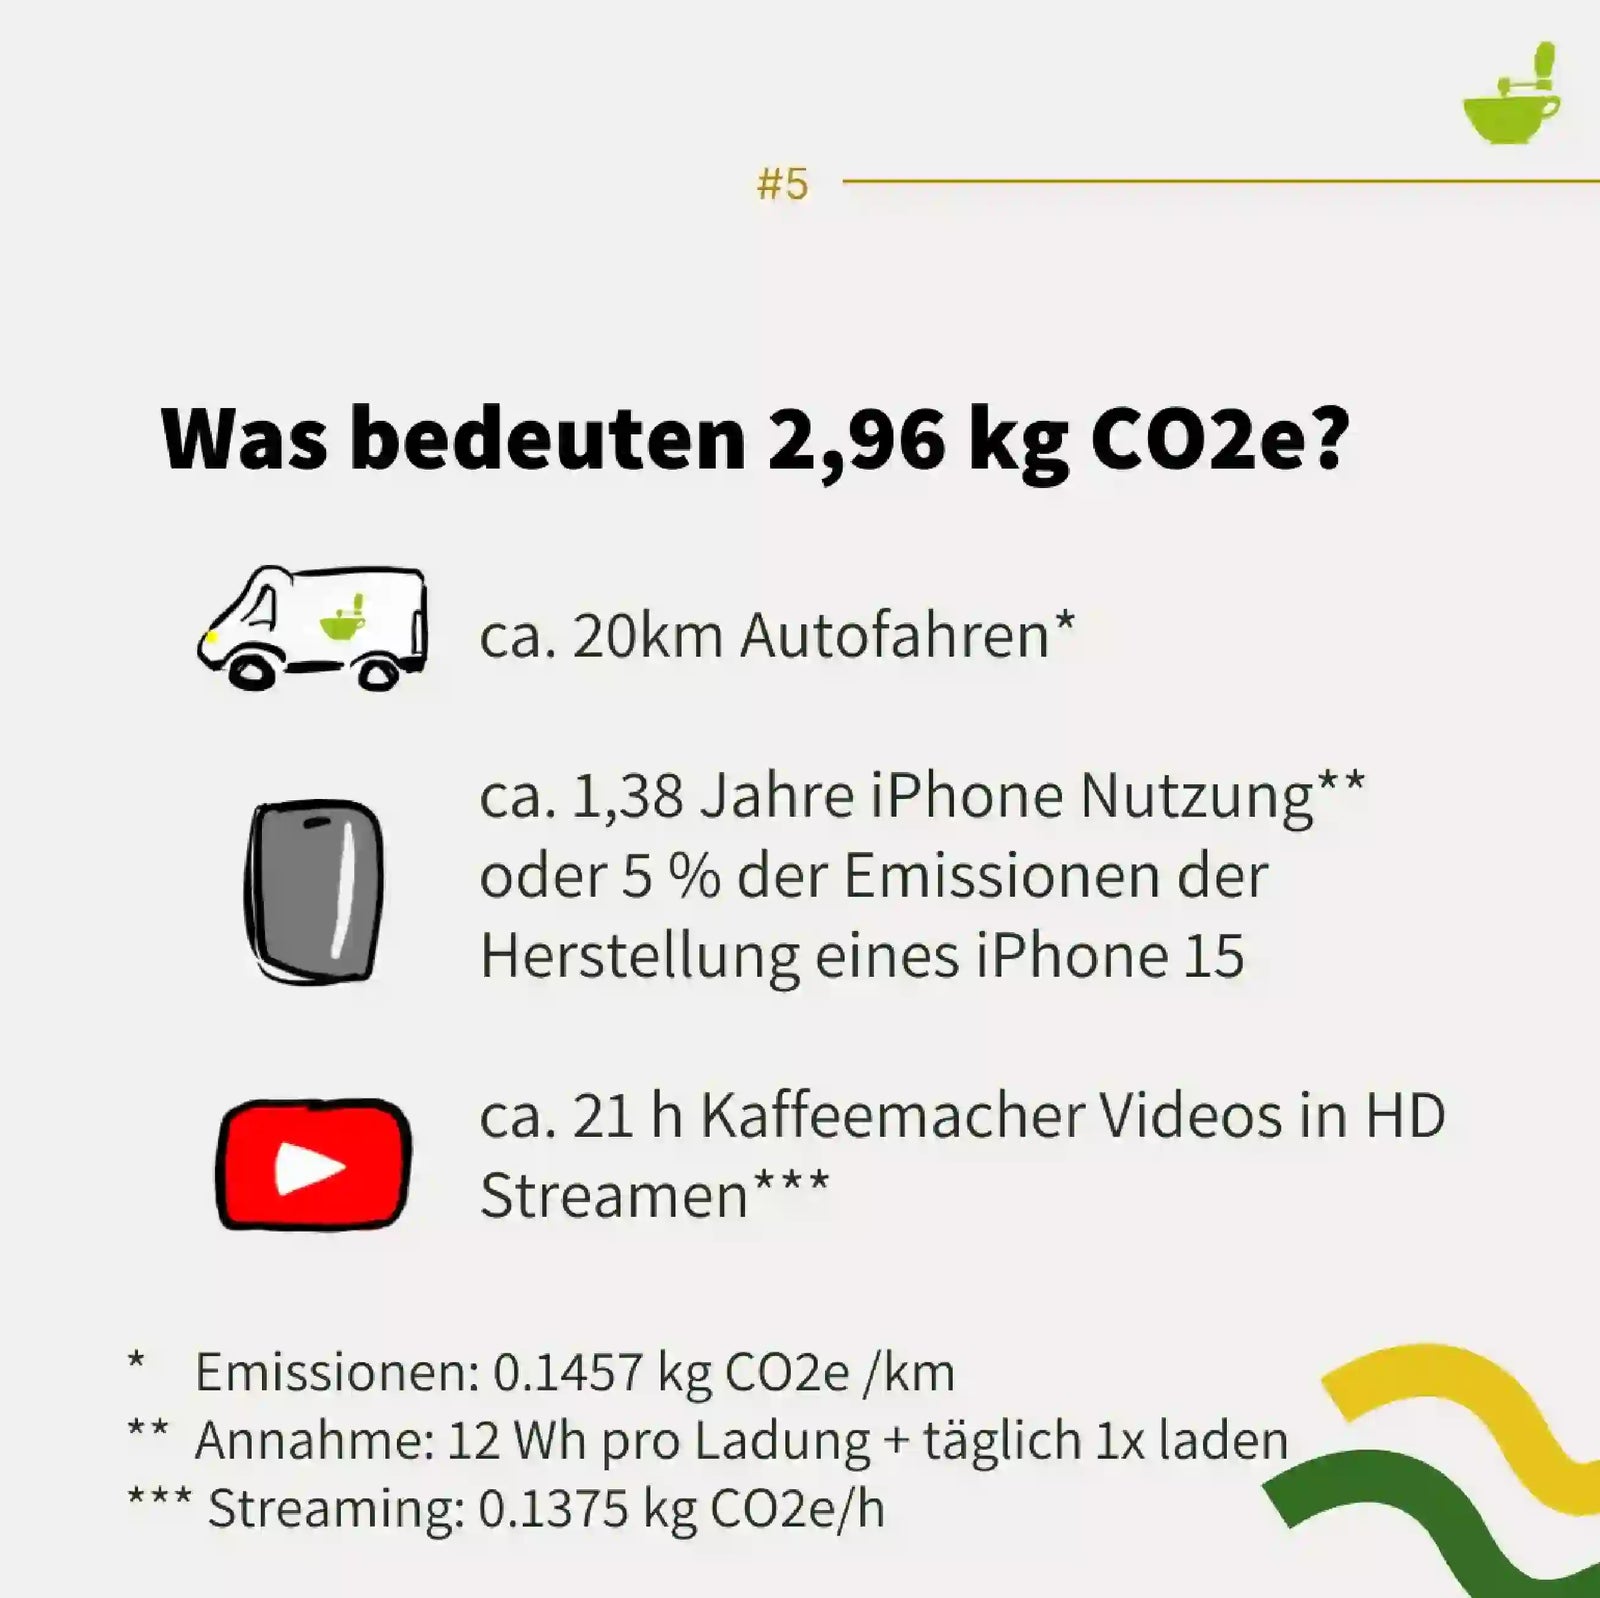
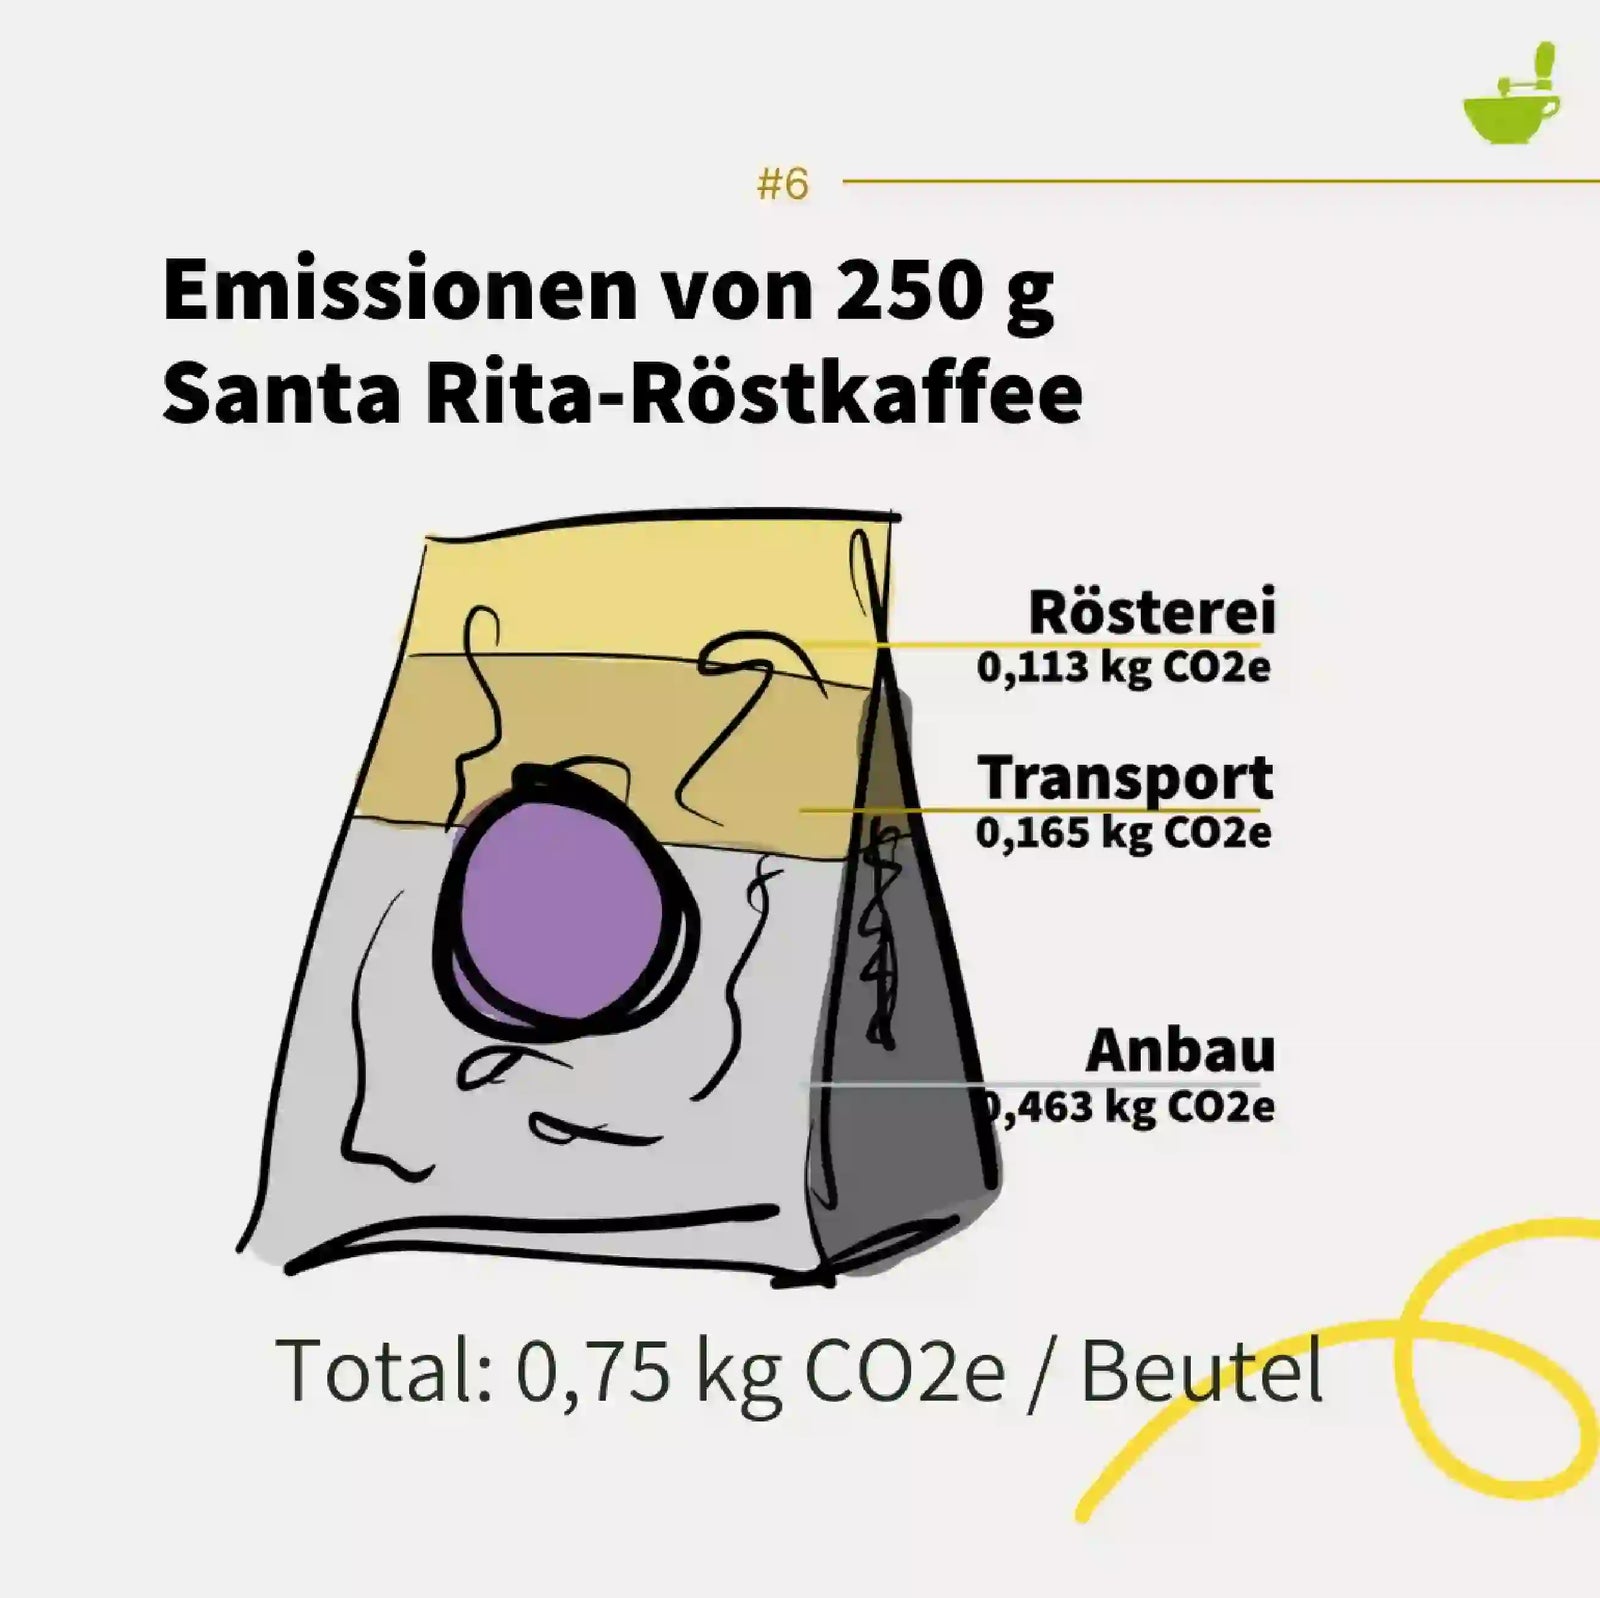
Und obwohl es auf der Wertschöpfungskette nur einen kleinen Teil ausmacht, sind es die Maßnahmen, die wir vor Ort selbst umsetzen können. Zusammen kommen Anbau, Transport und Rösten auf 2,96 kg CO2e / kg Röstkaffee (das sind 0,75 kg CO2e / 250 g Beutel). Was einer Autofahrt von ca. 20 km entspricht.
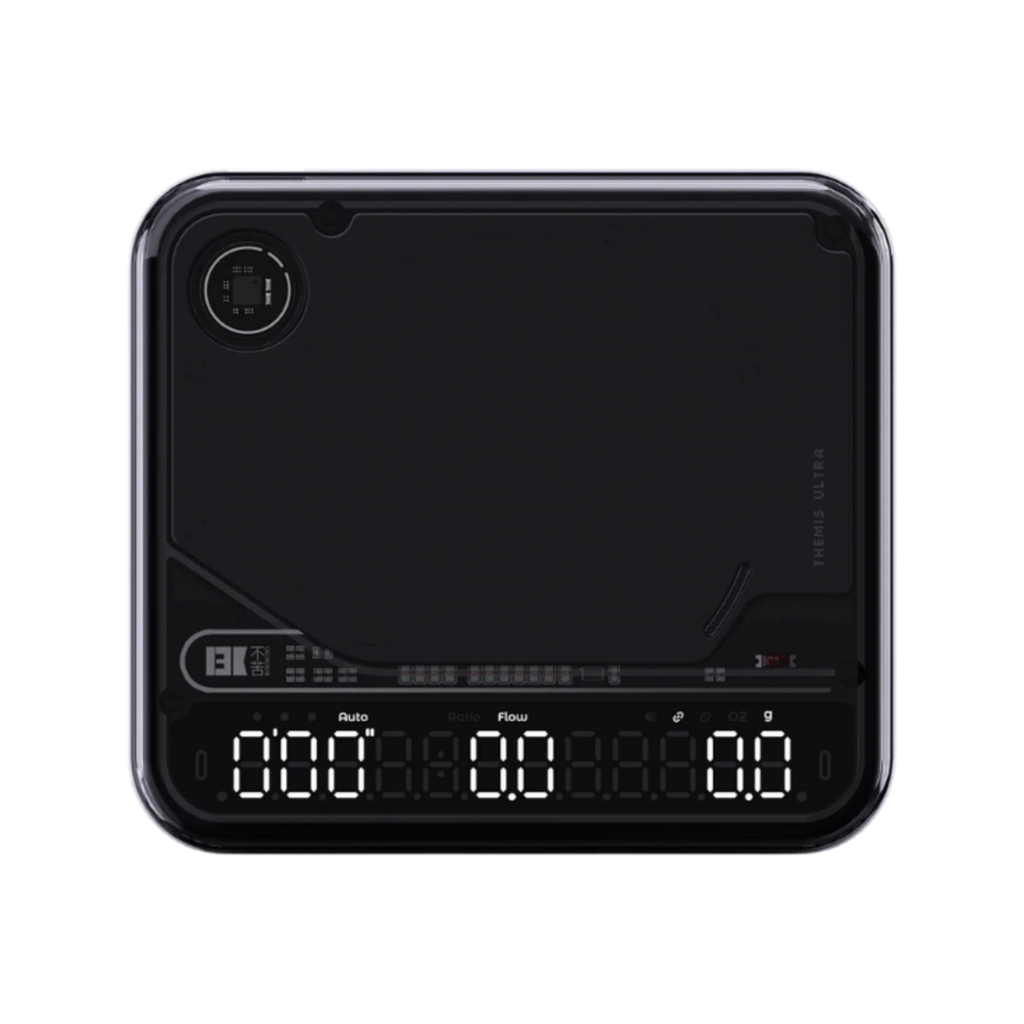
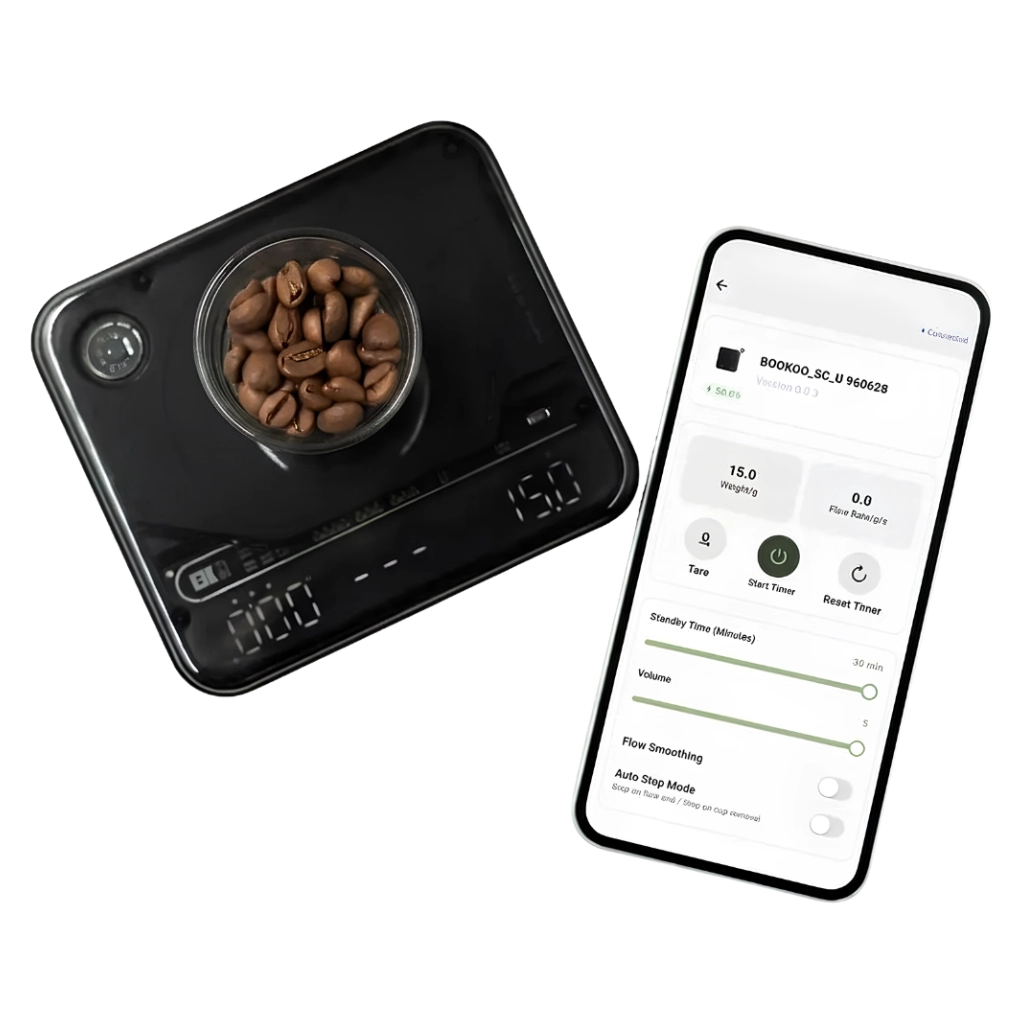
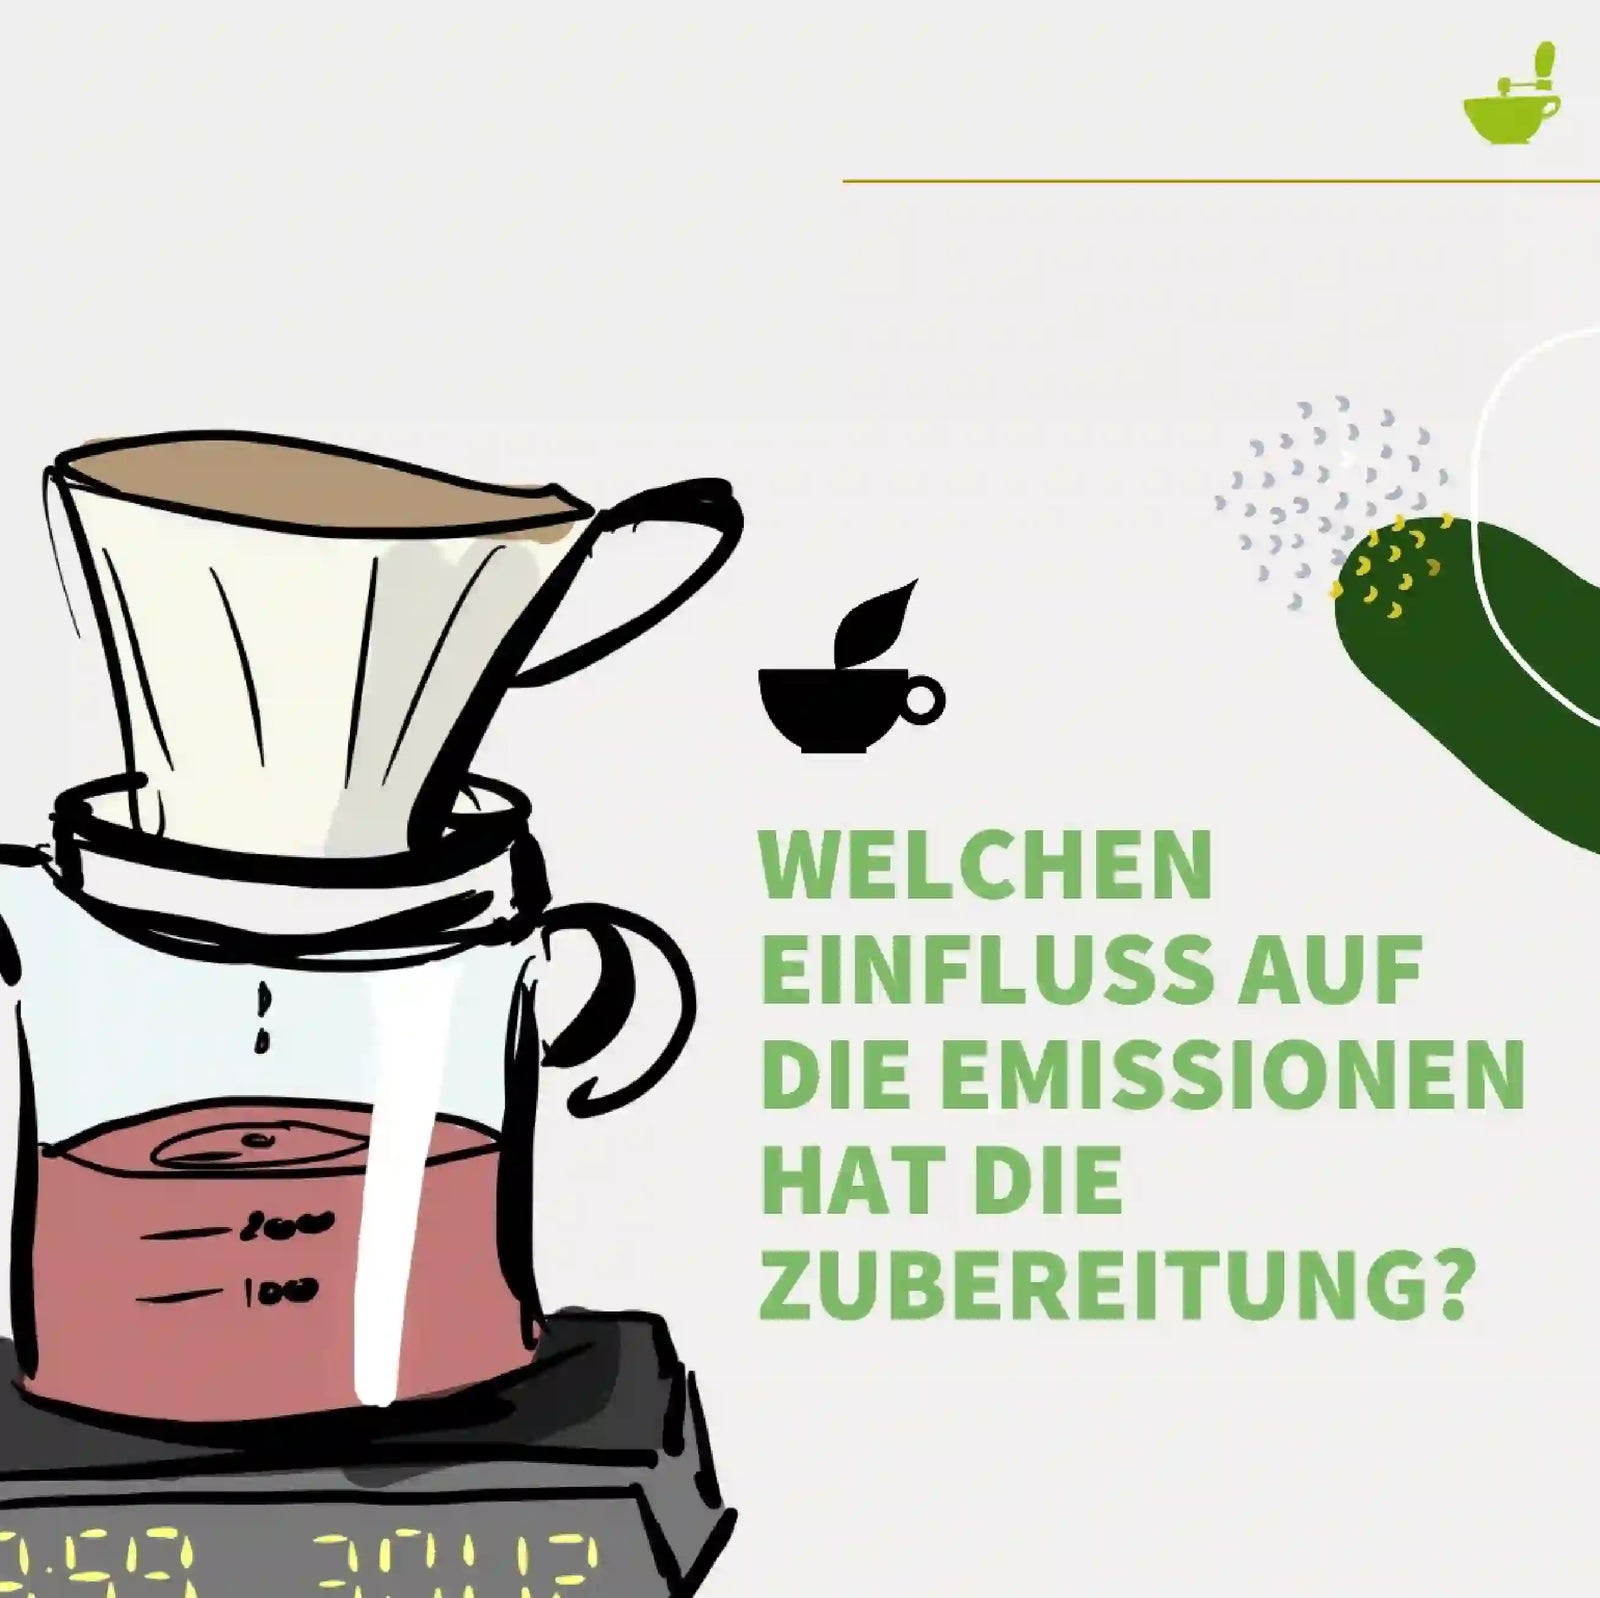
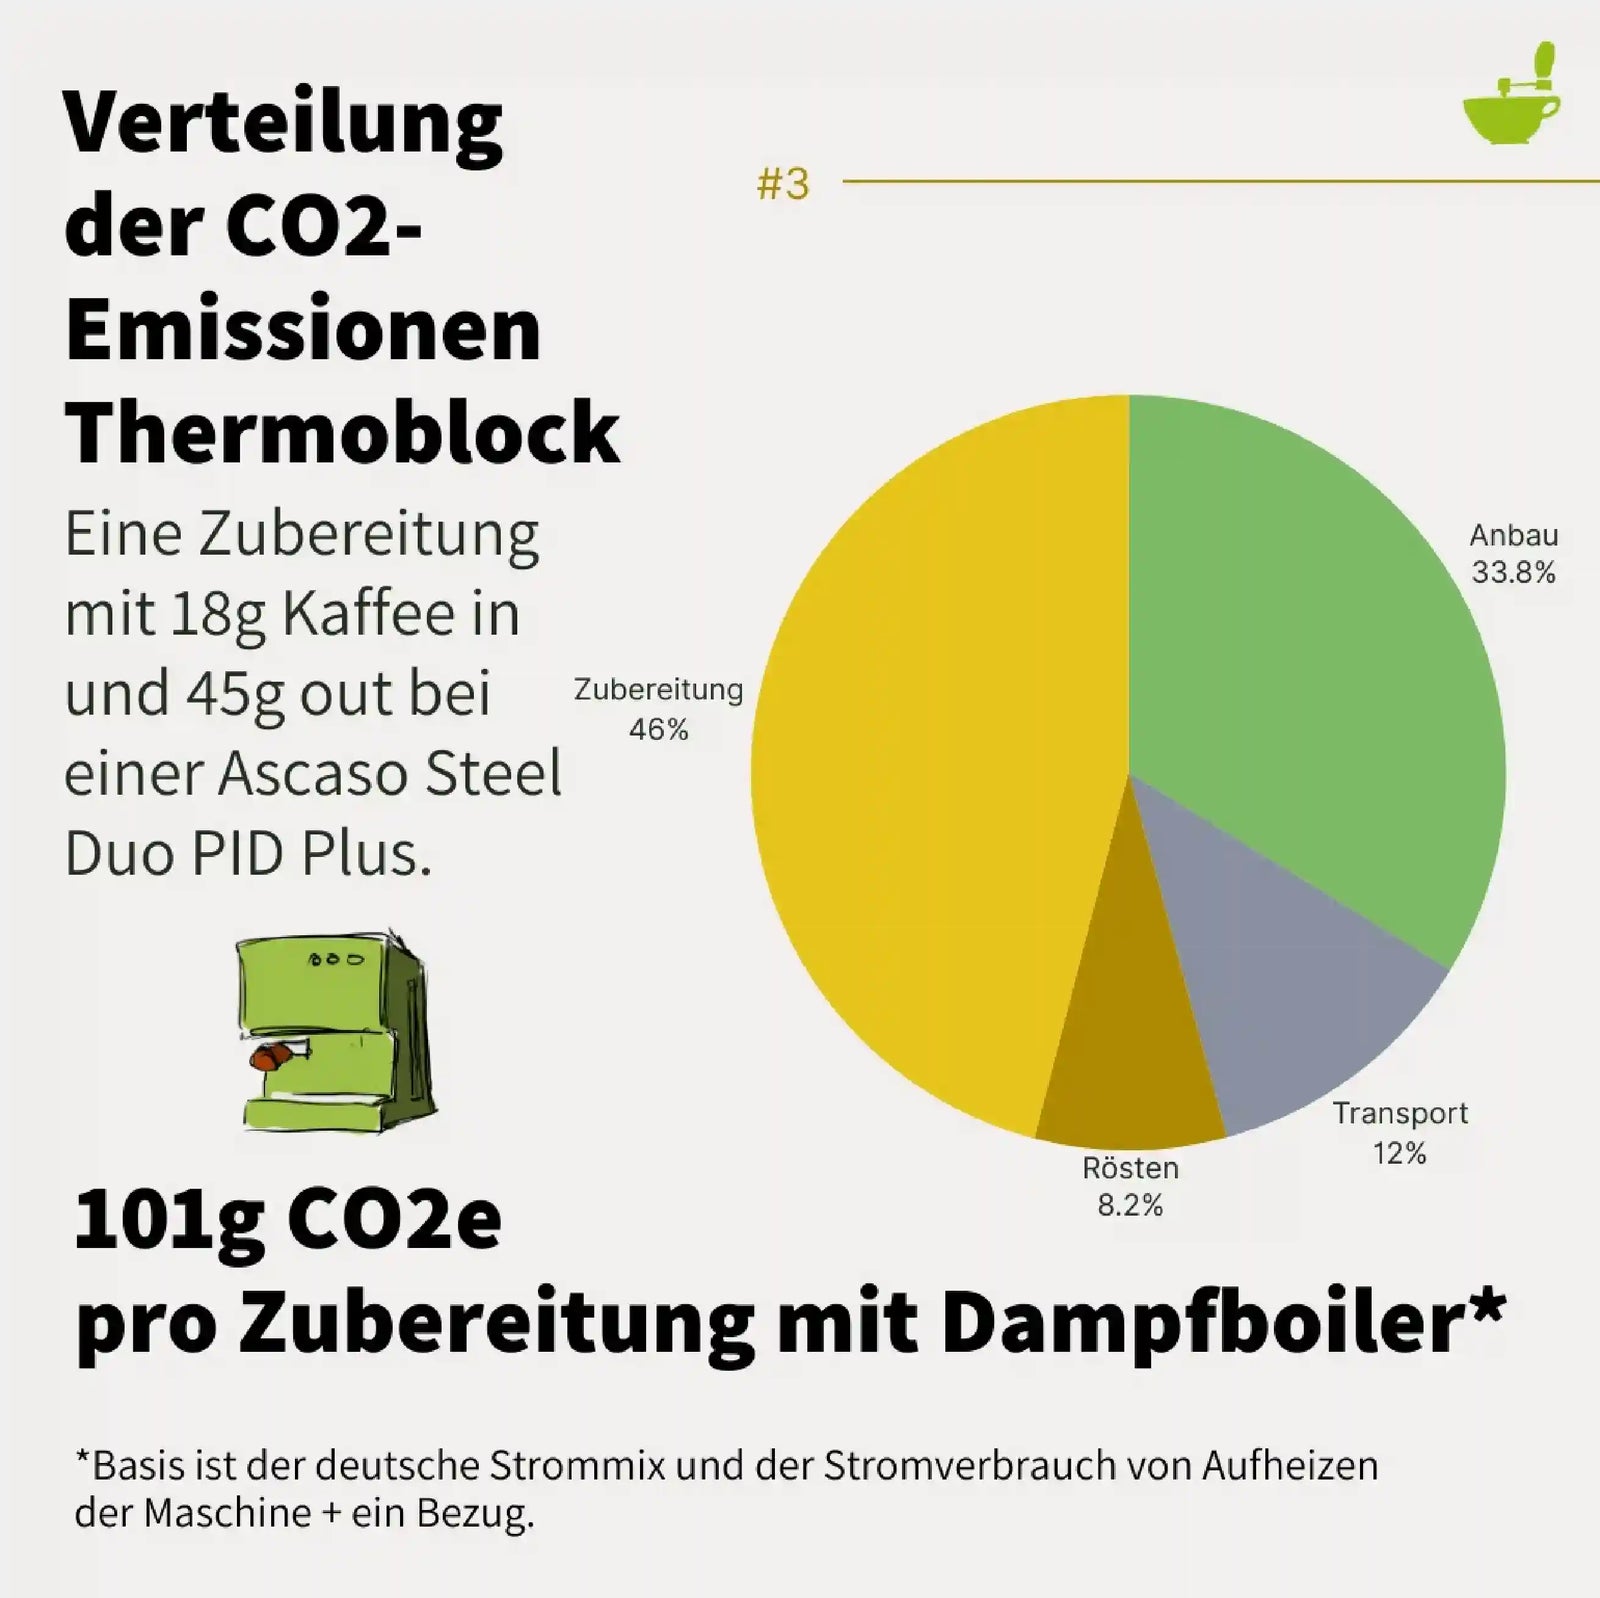
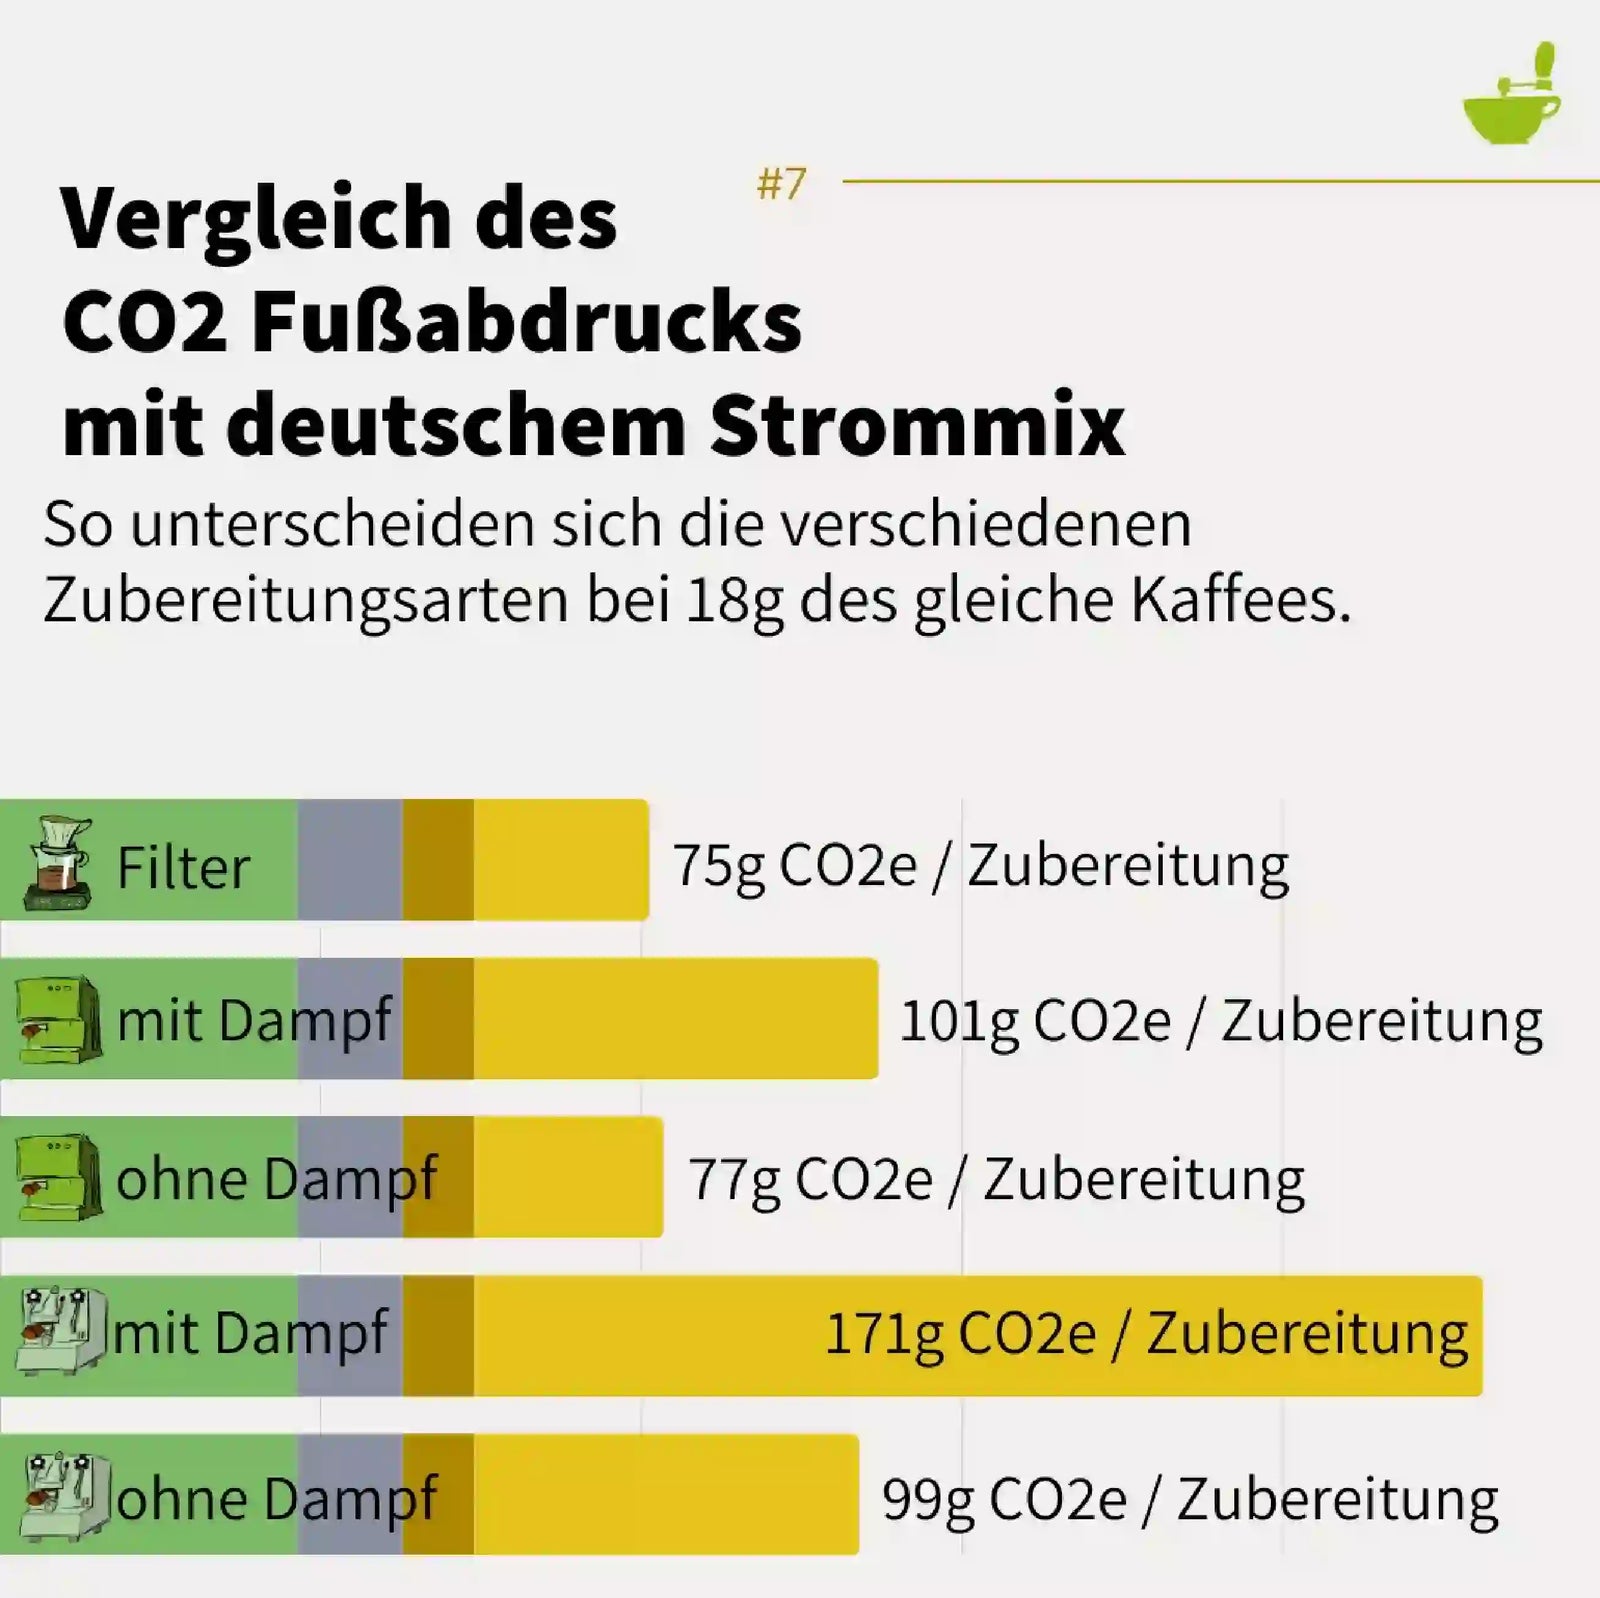
Der CO₂-Fußabdruck der Zubereitung
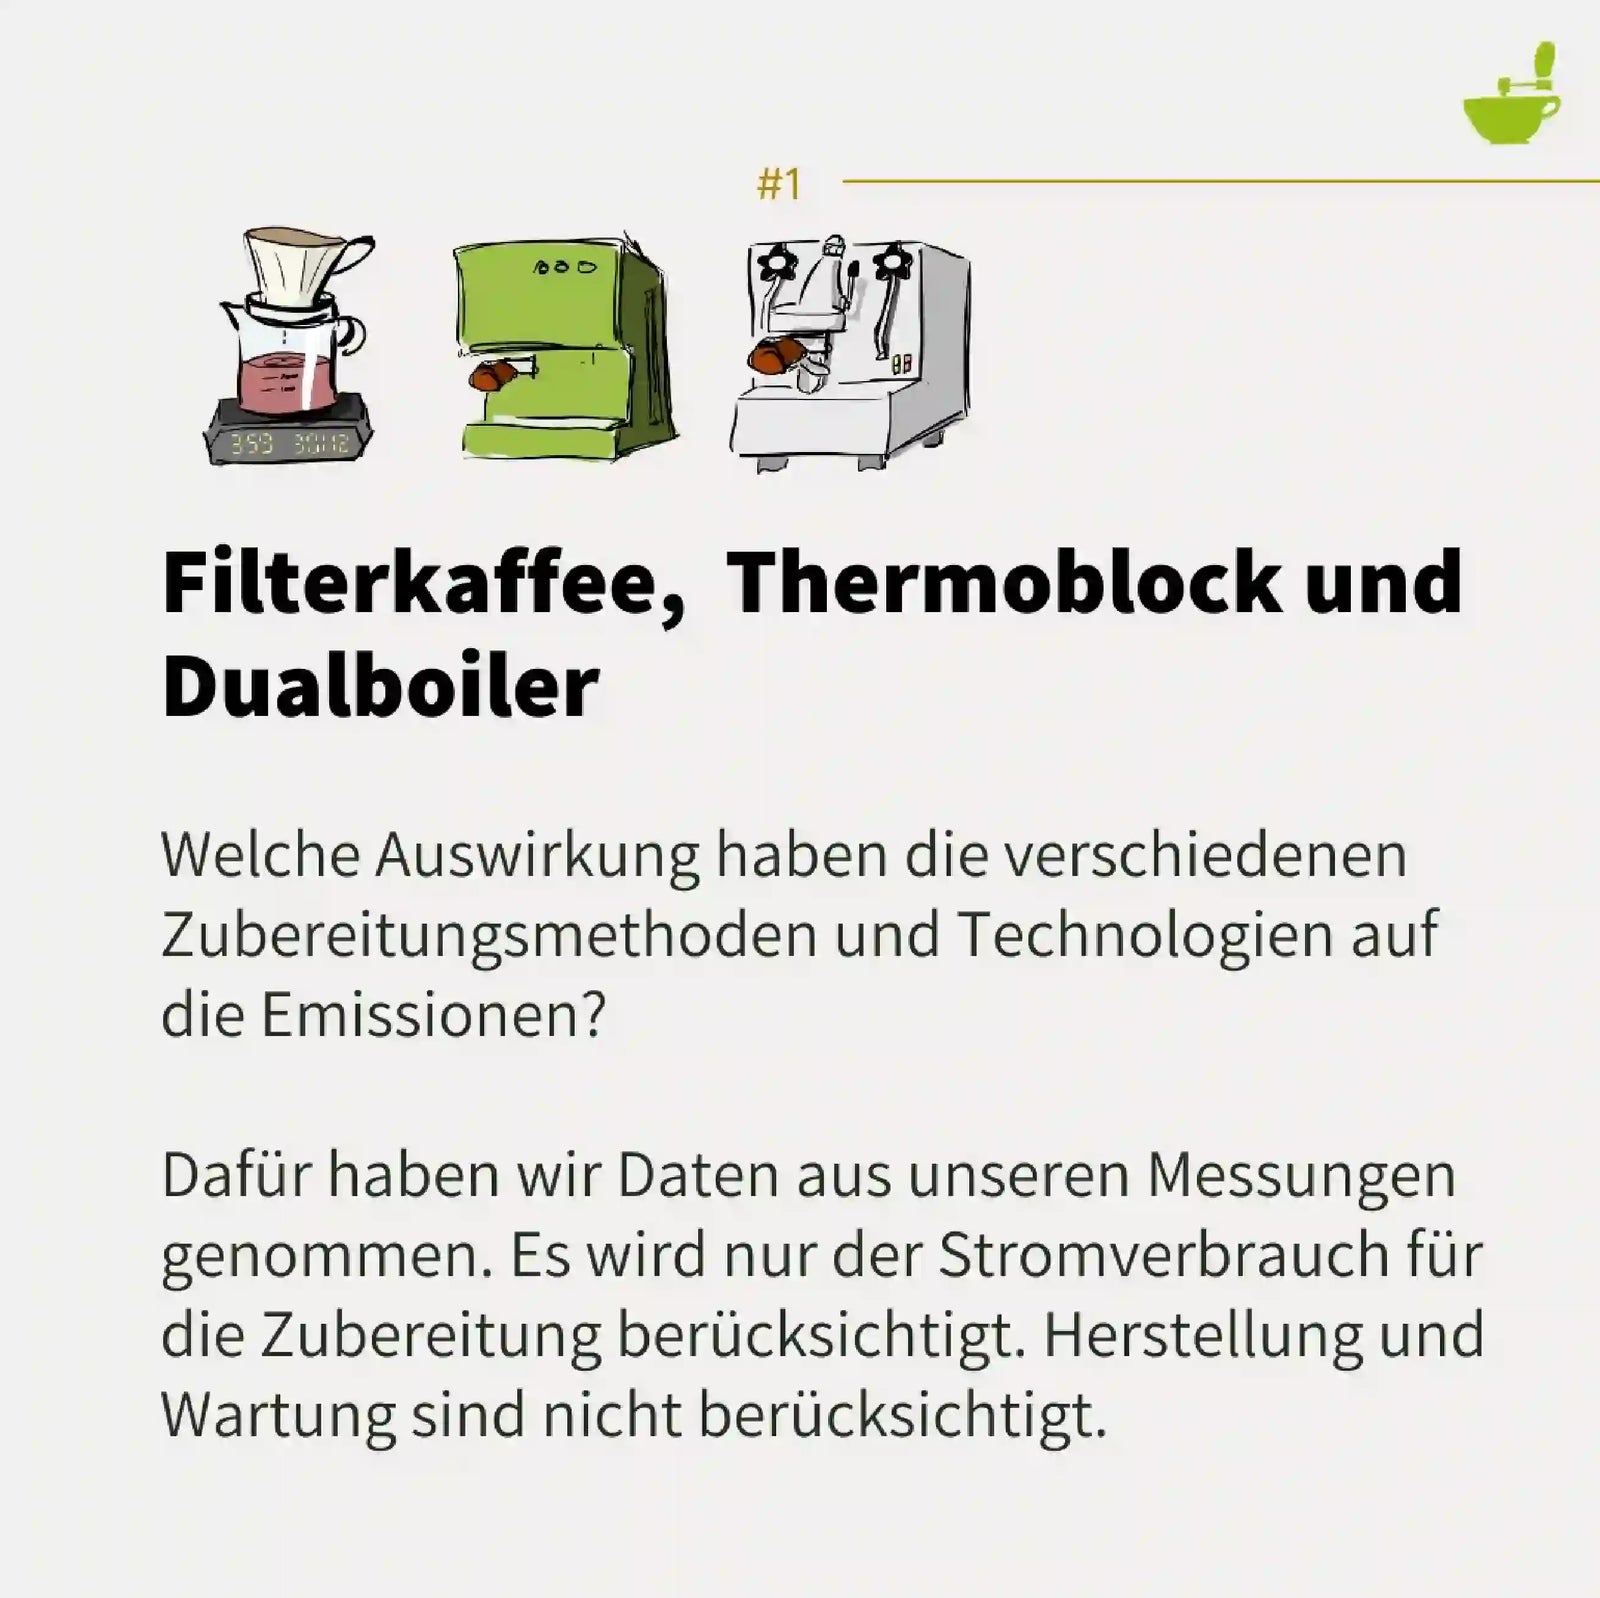
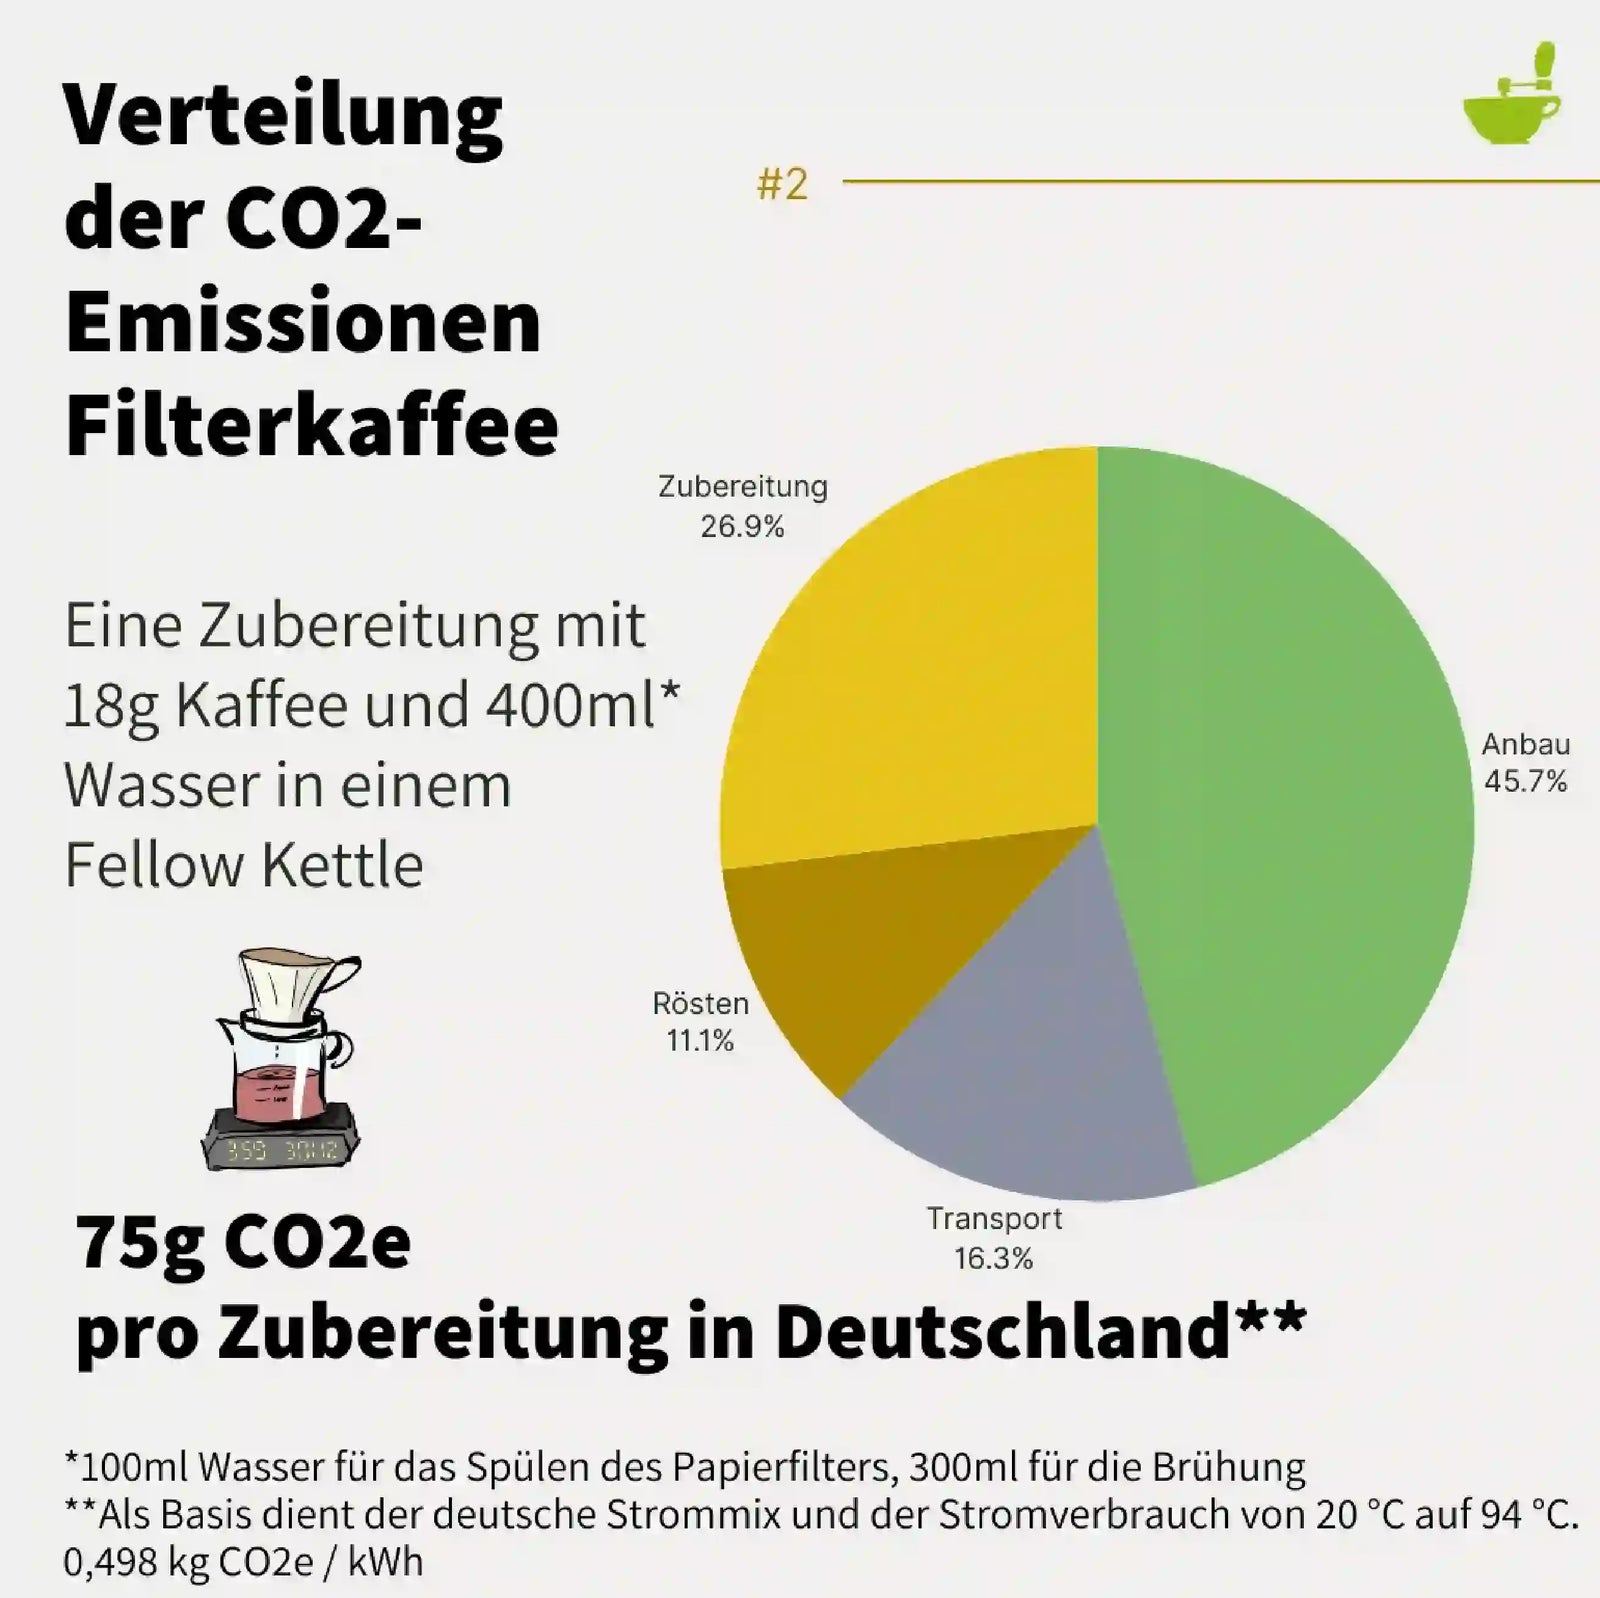
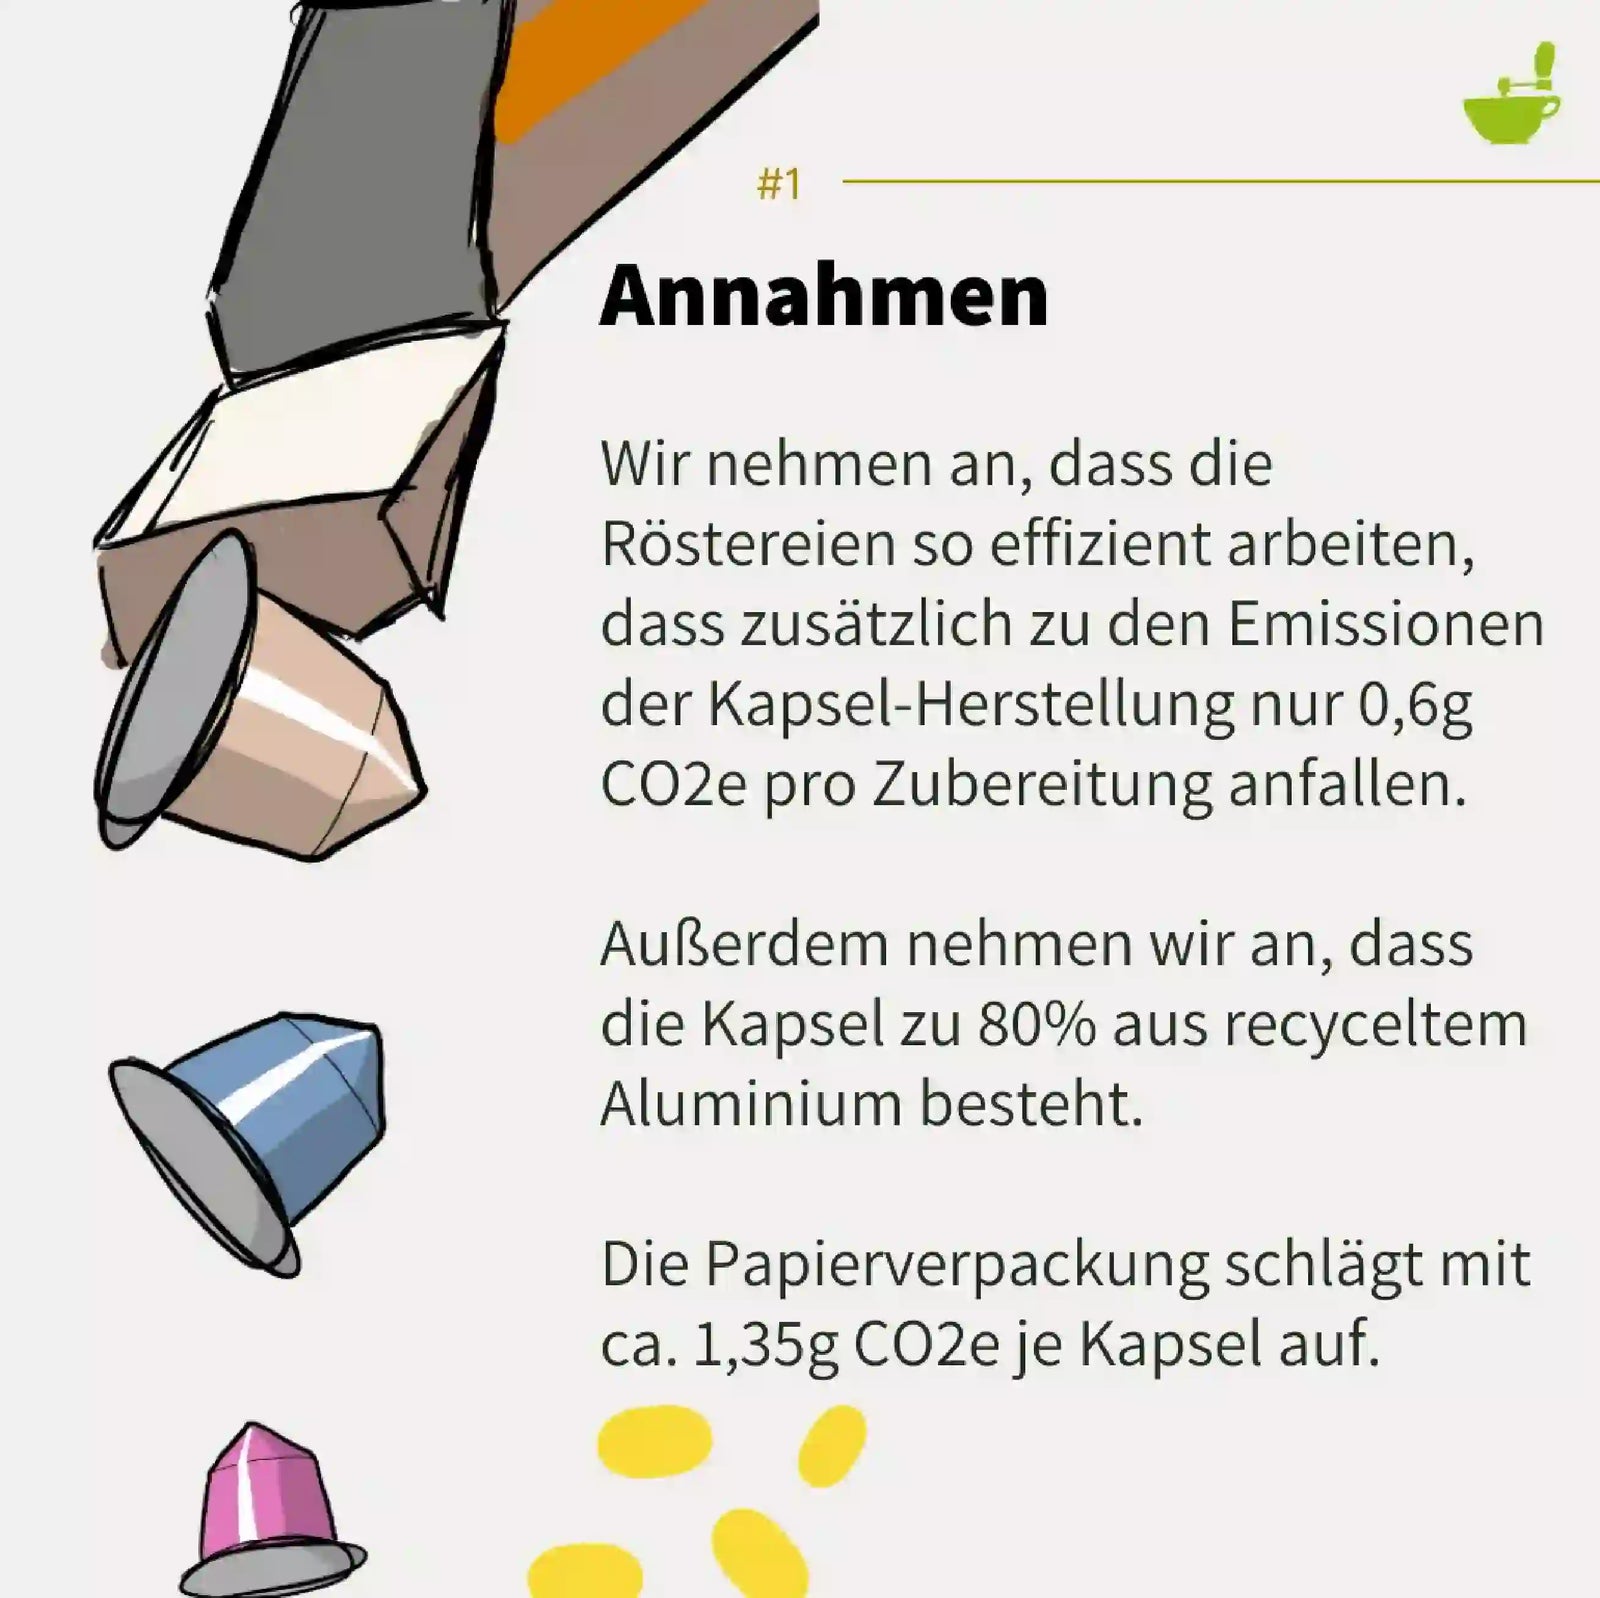
Der letzte Schritt vor dem Genuss ist die Zubereitung. Sie trägt, je nach Methode auch erheblich zu den Emissionen bei. Und das, obwohl in unserer Betrachtung die Herstellung, Entsorgung und Wartung der Maschinen nicht berücksichtigt wird.
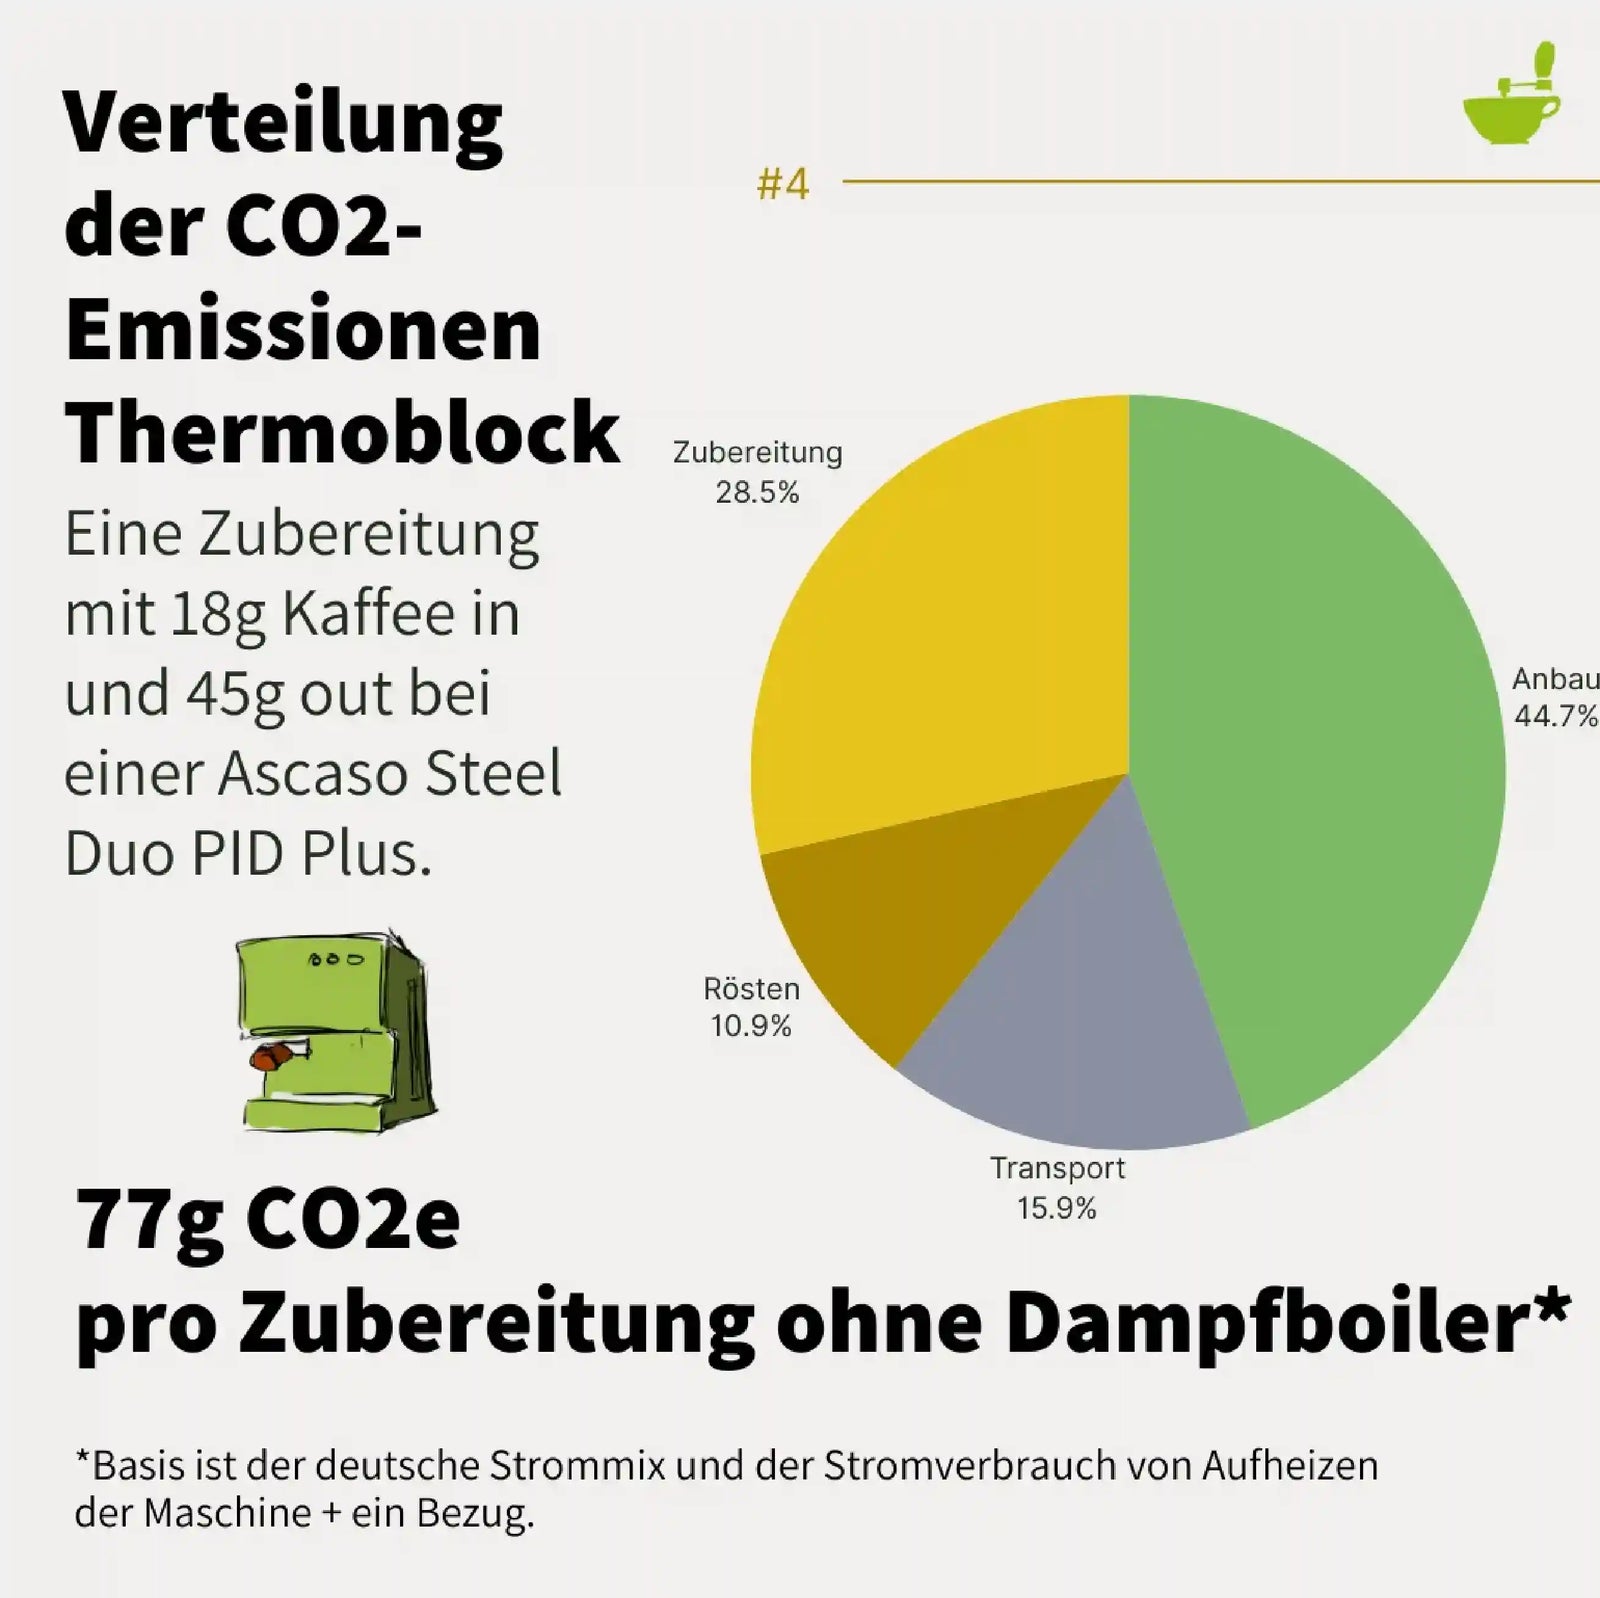
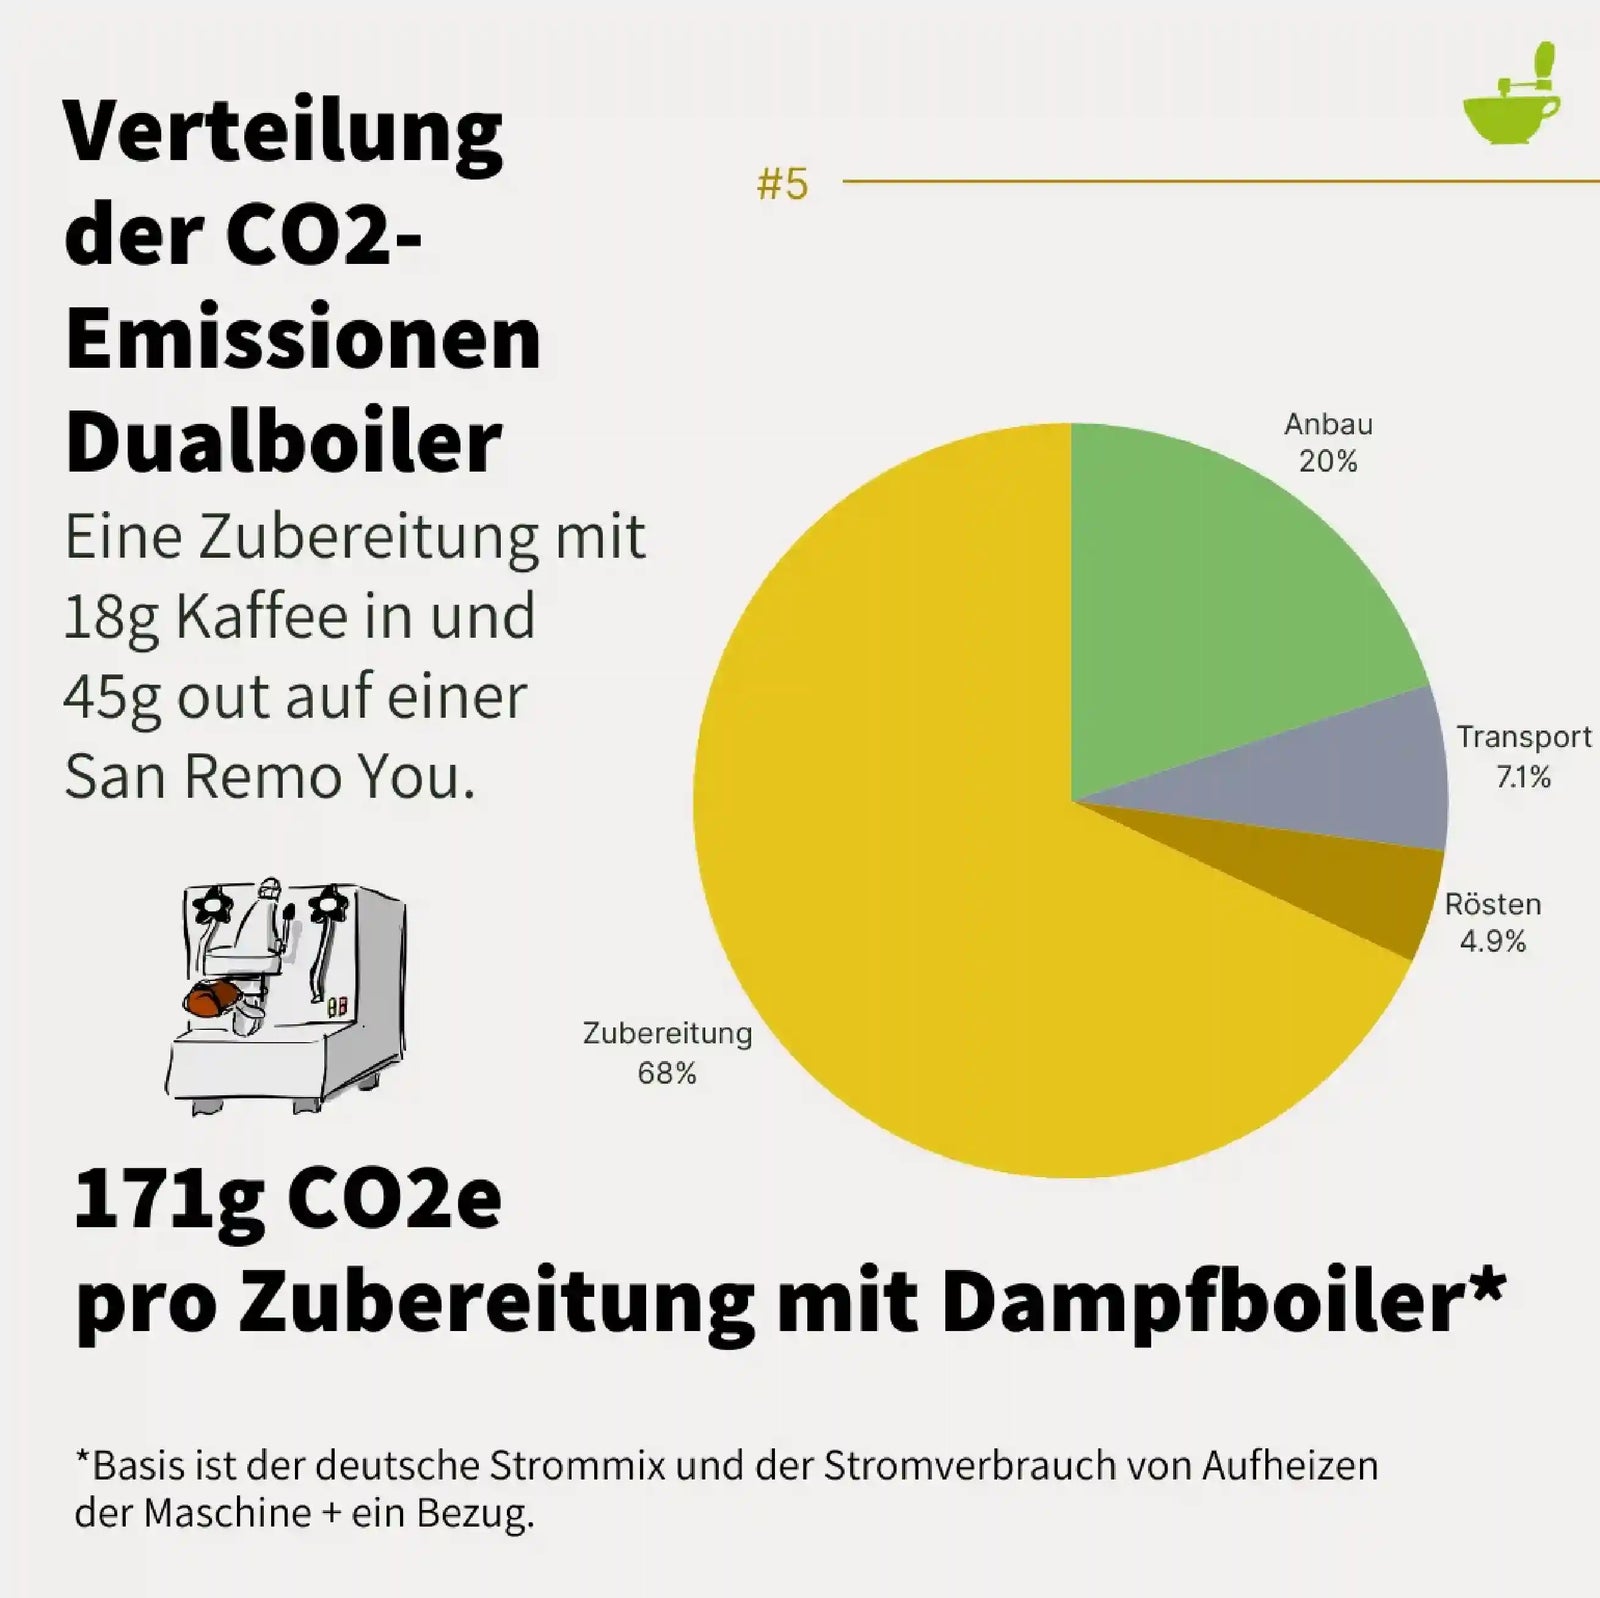
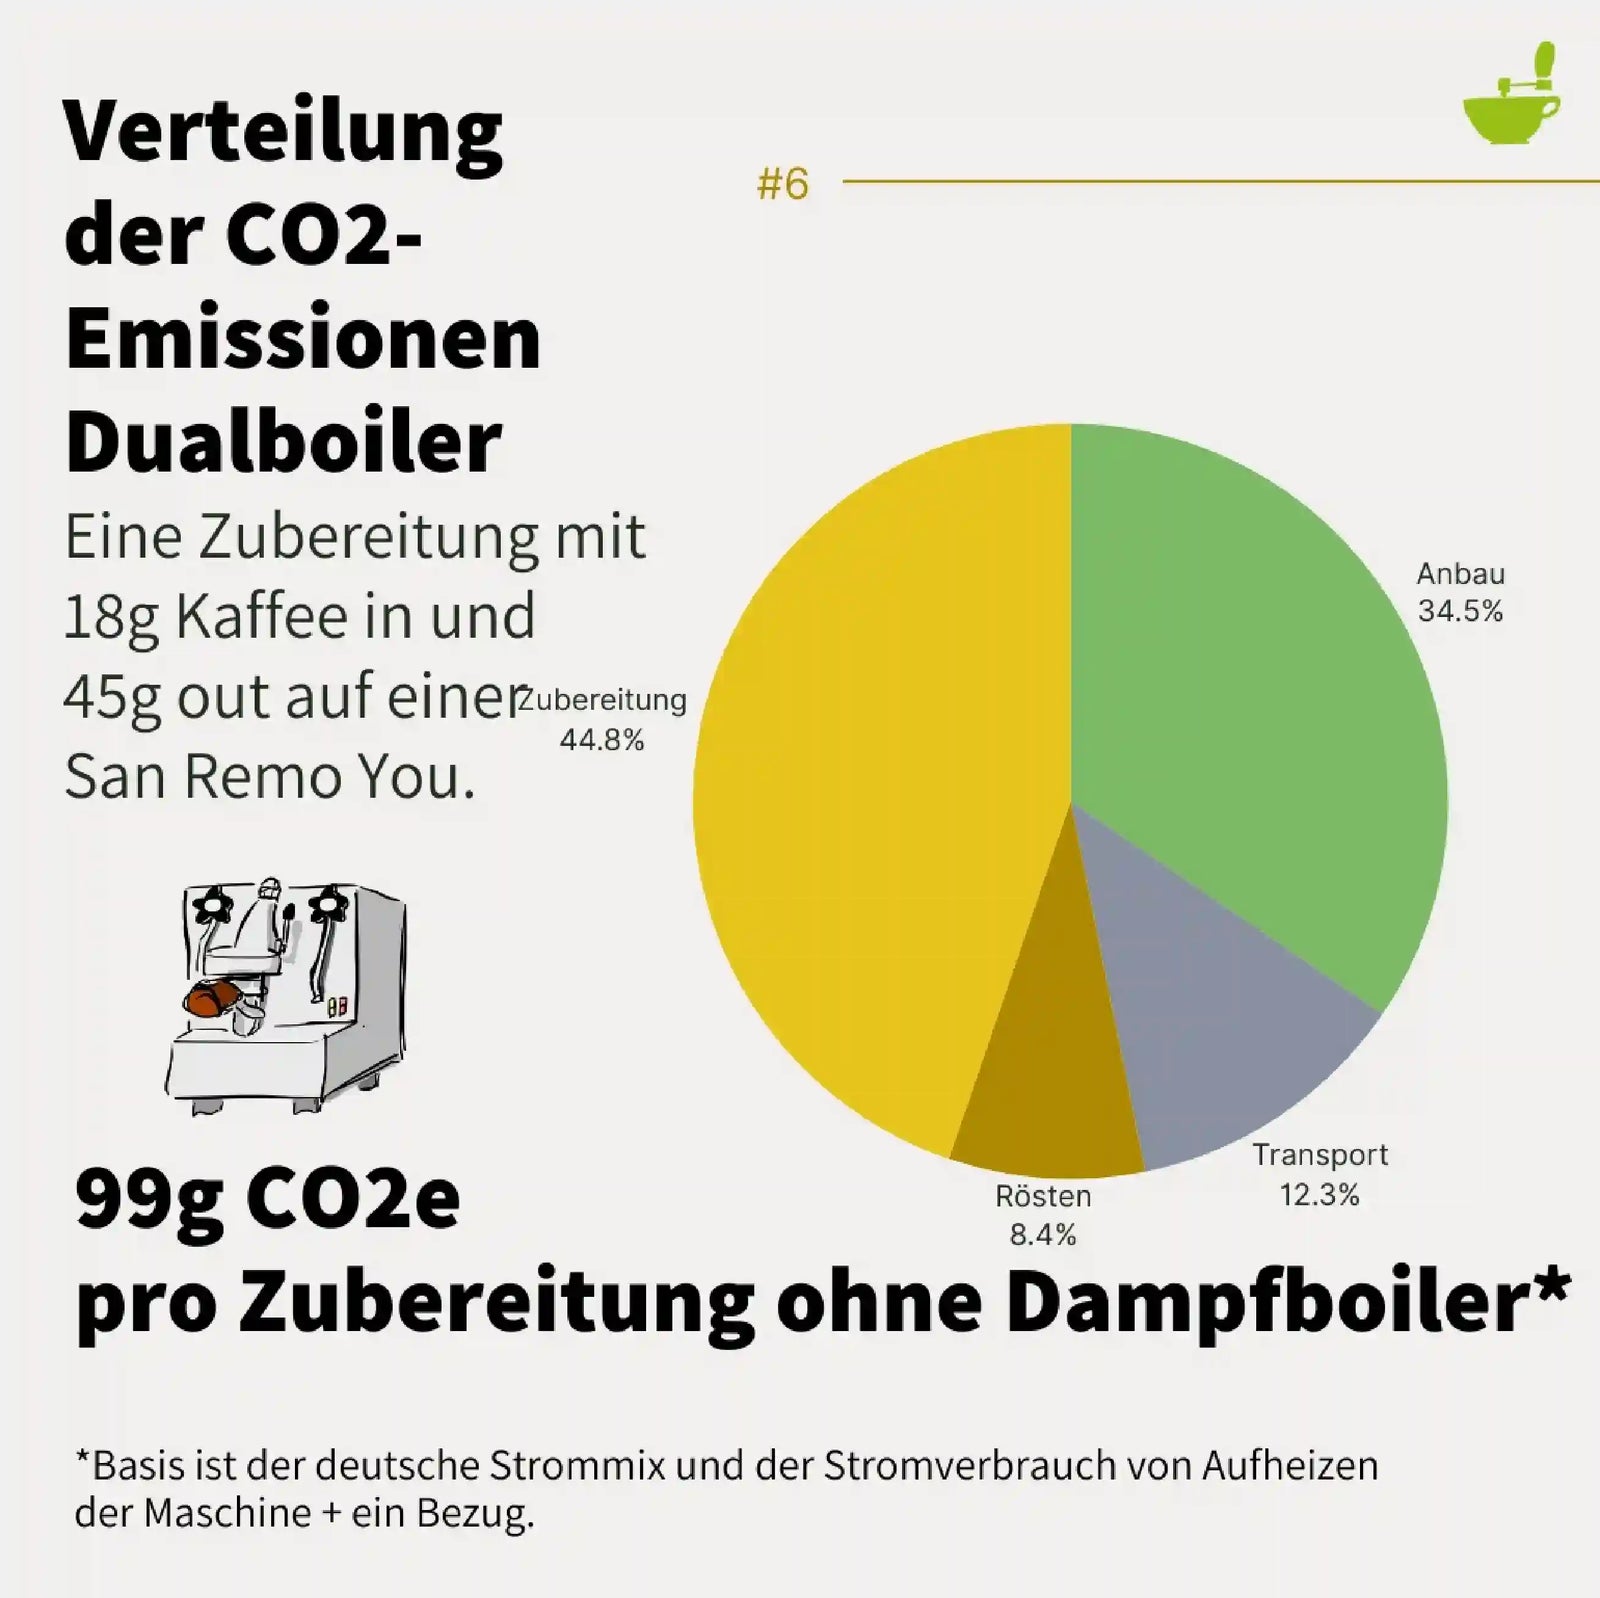
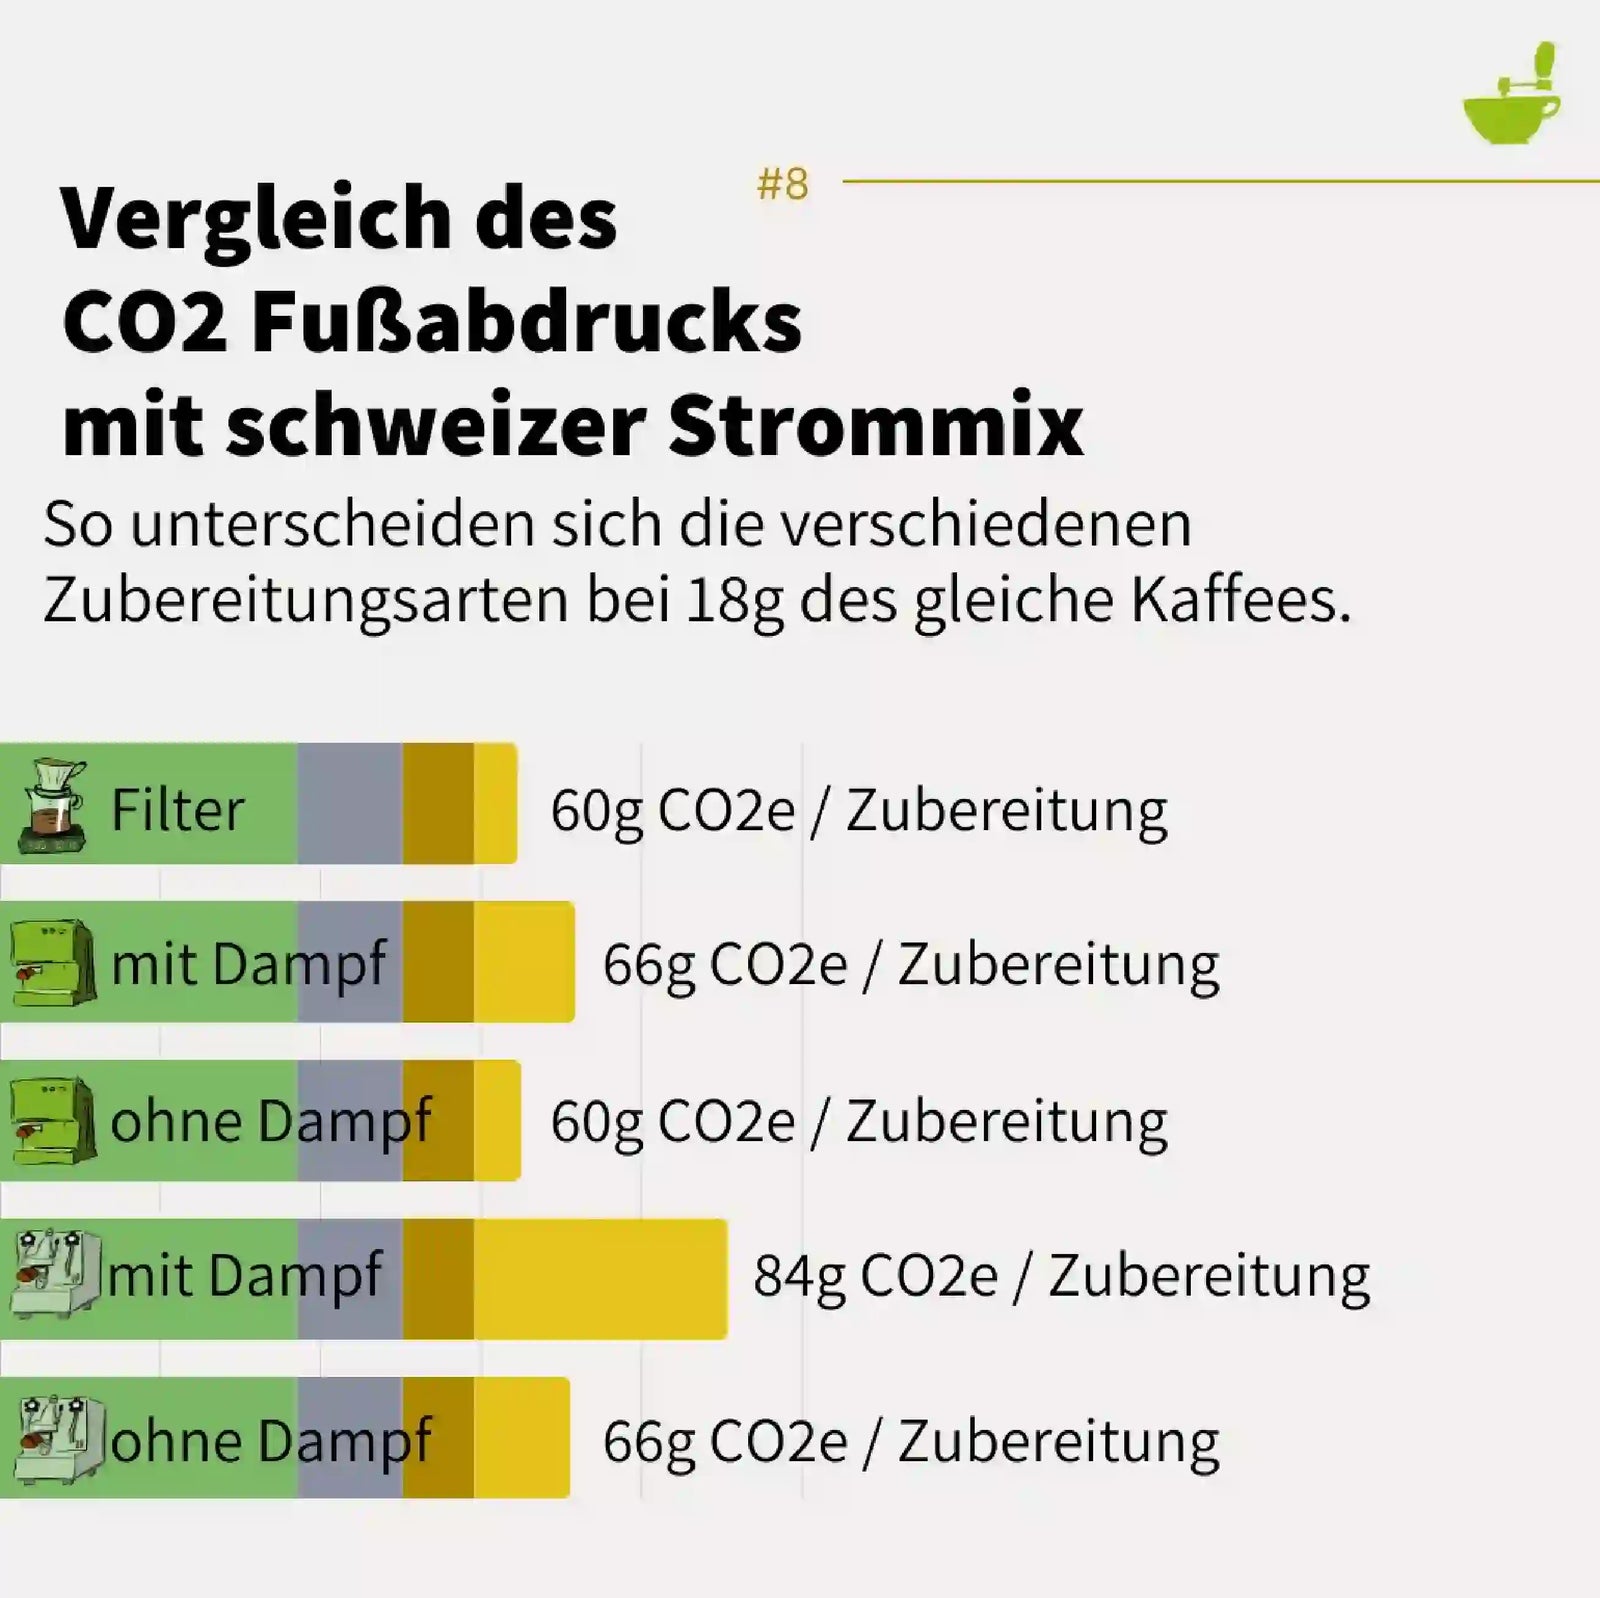
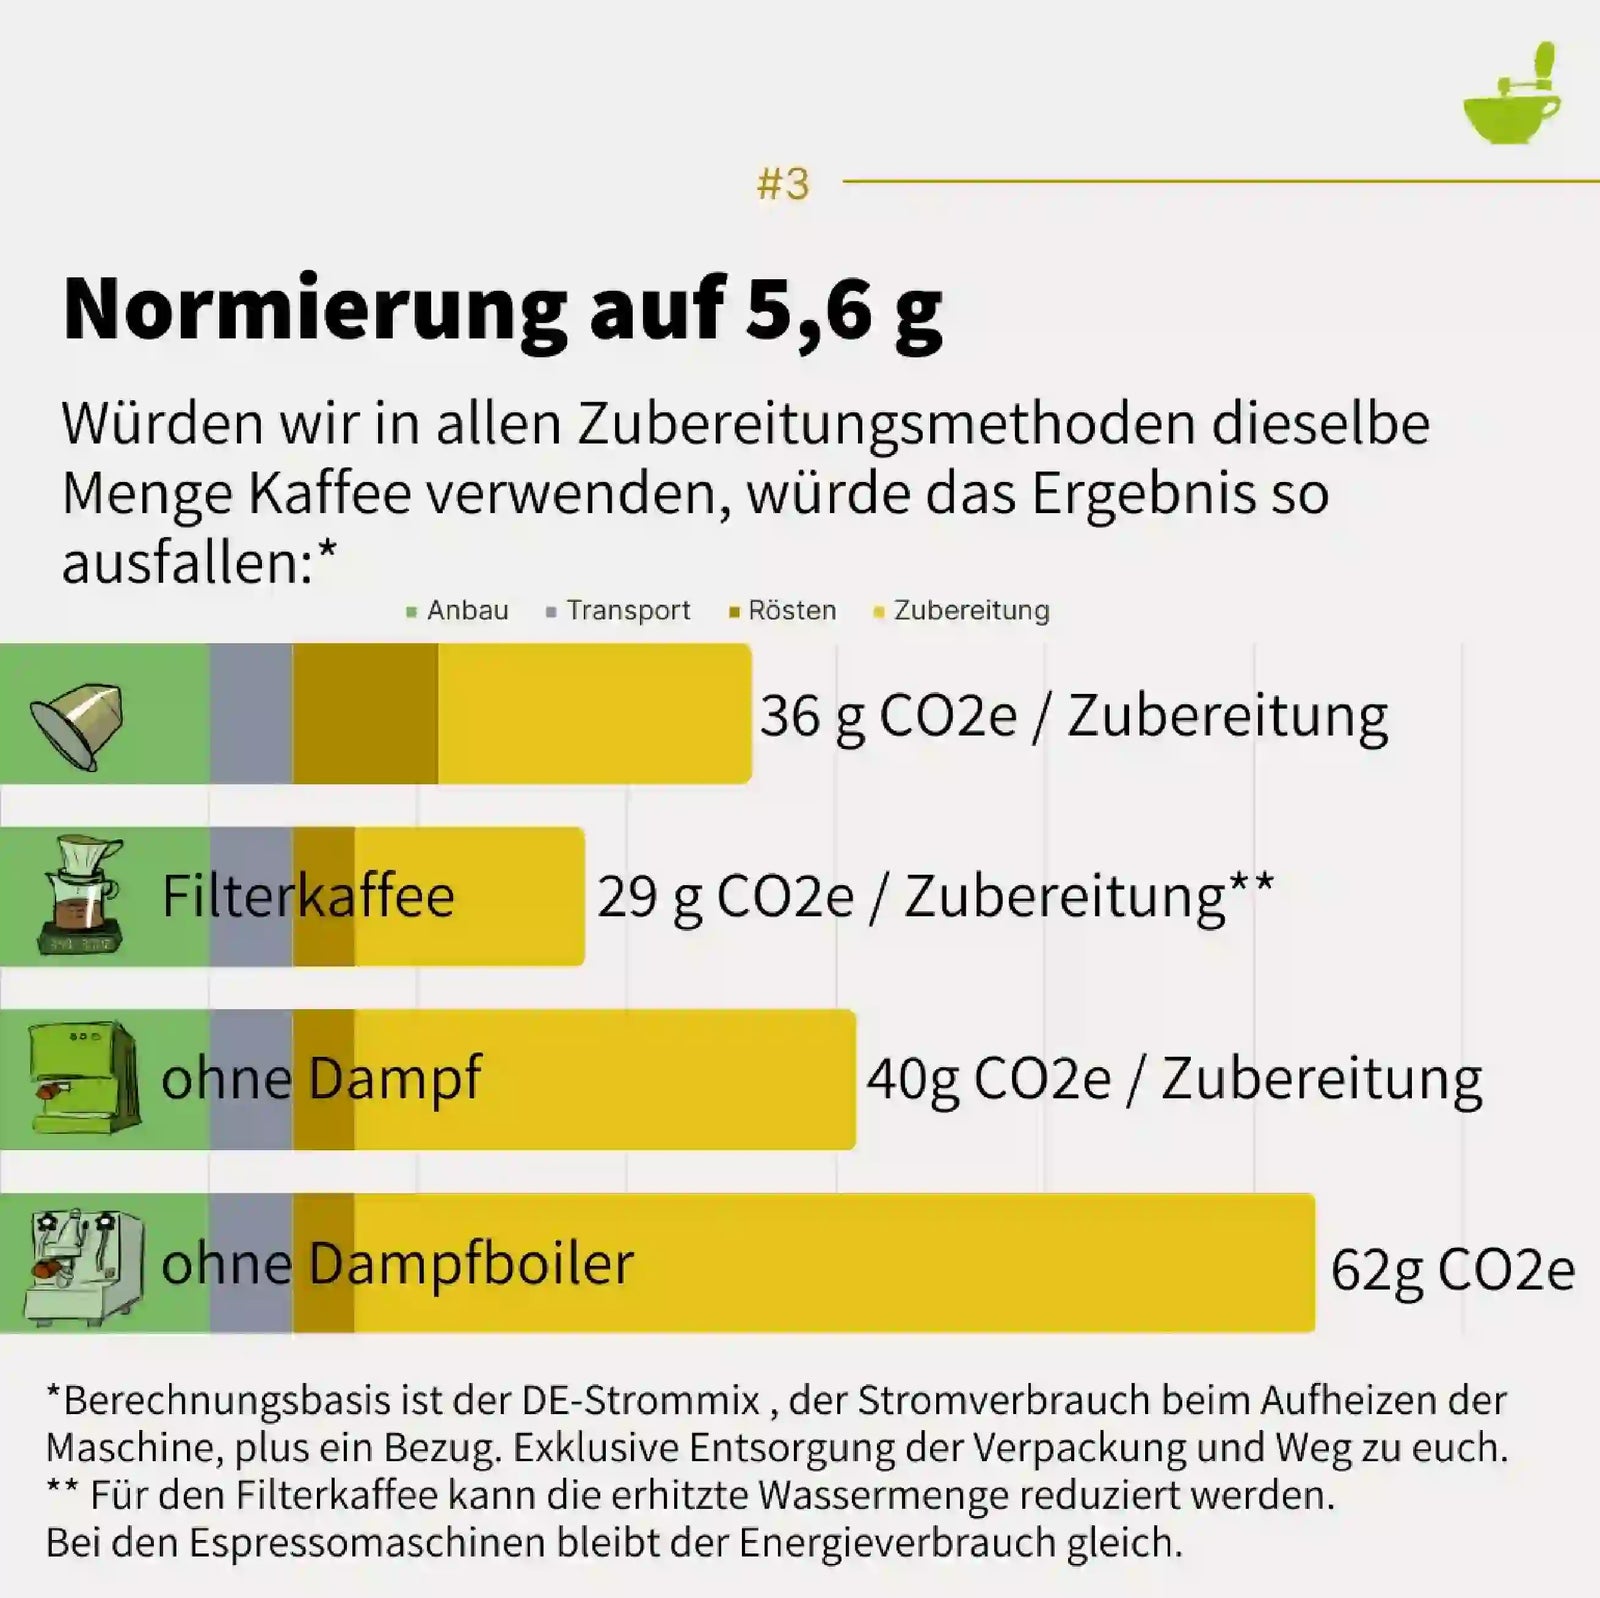
Es zeigt sich, dass man mit der Zubereitung nochmal einen großen Einfluss auf die Emissionen hat. Neben der Methode ist vor allem der Strommix, mit der die Kaffeemacher betrieben werden, entscheidend.
Die Daten für die Ergebnisse basieren auf den Energiemessungen, die wir für jede Maschine für die Test-Videos vornehmen.
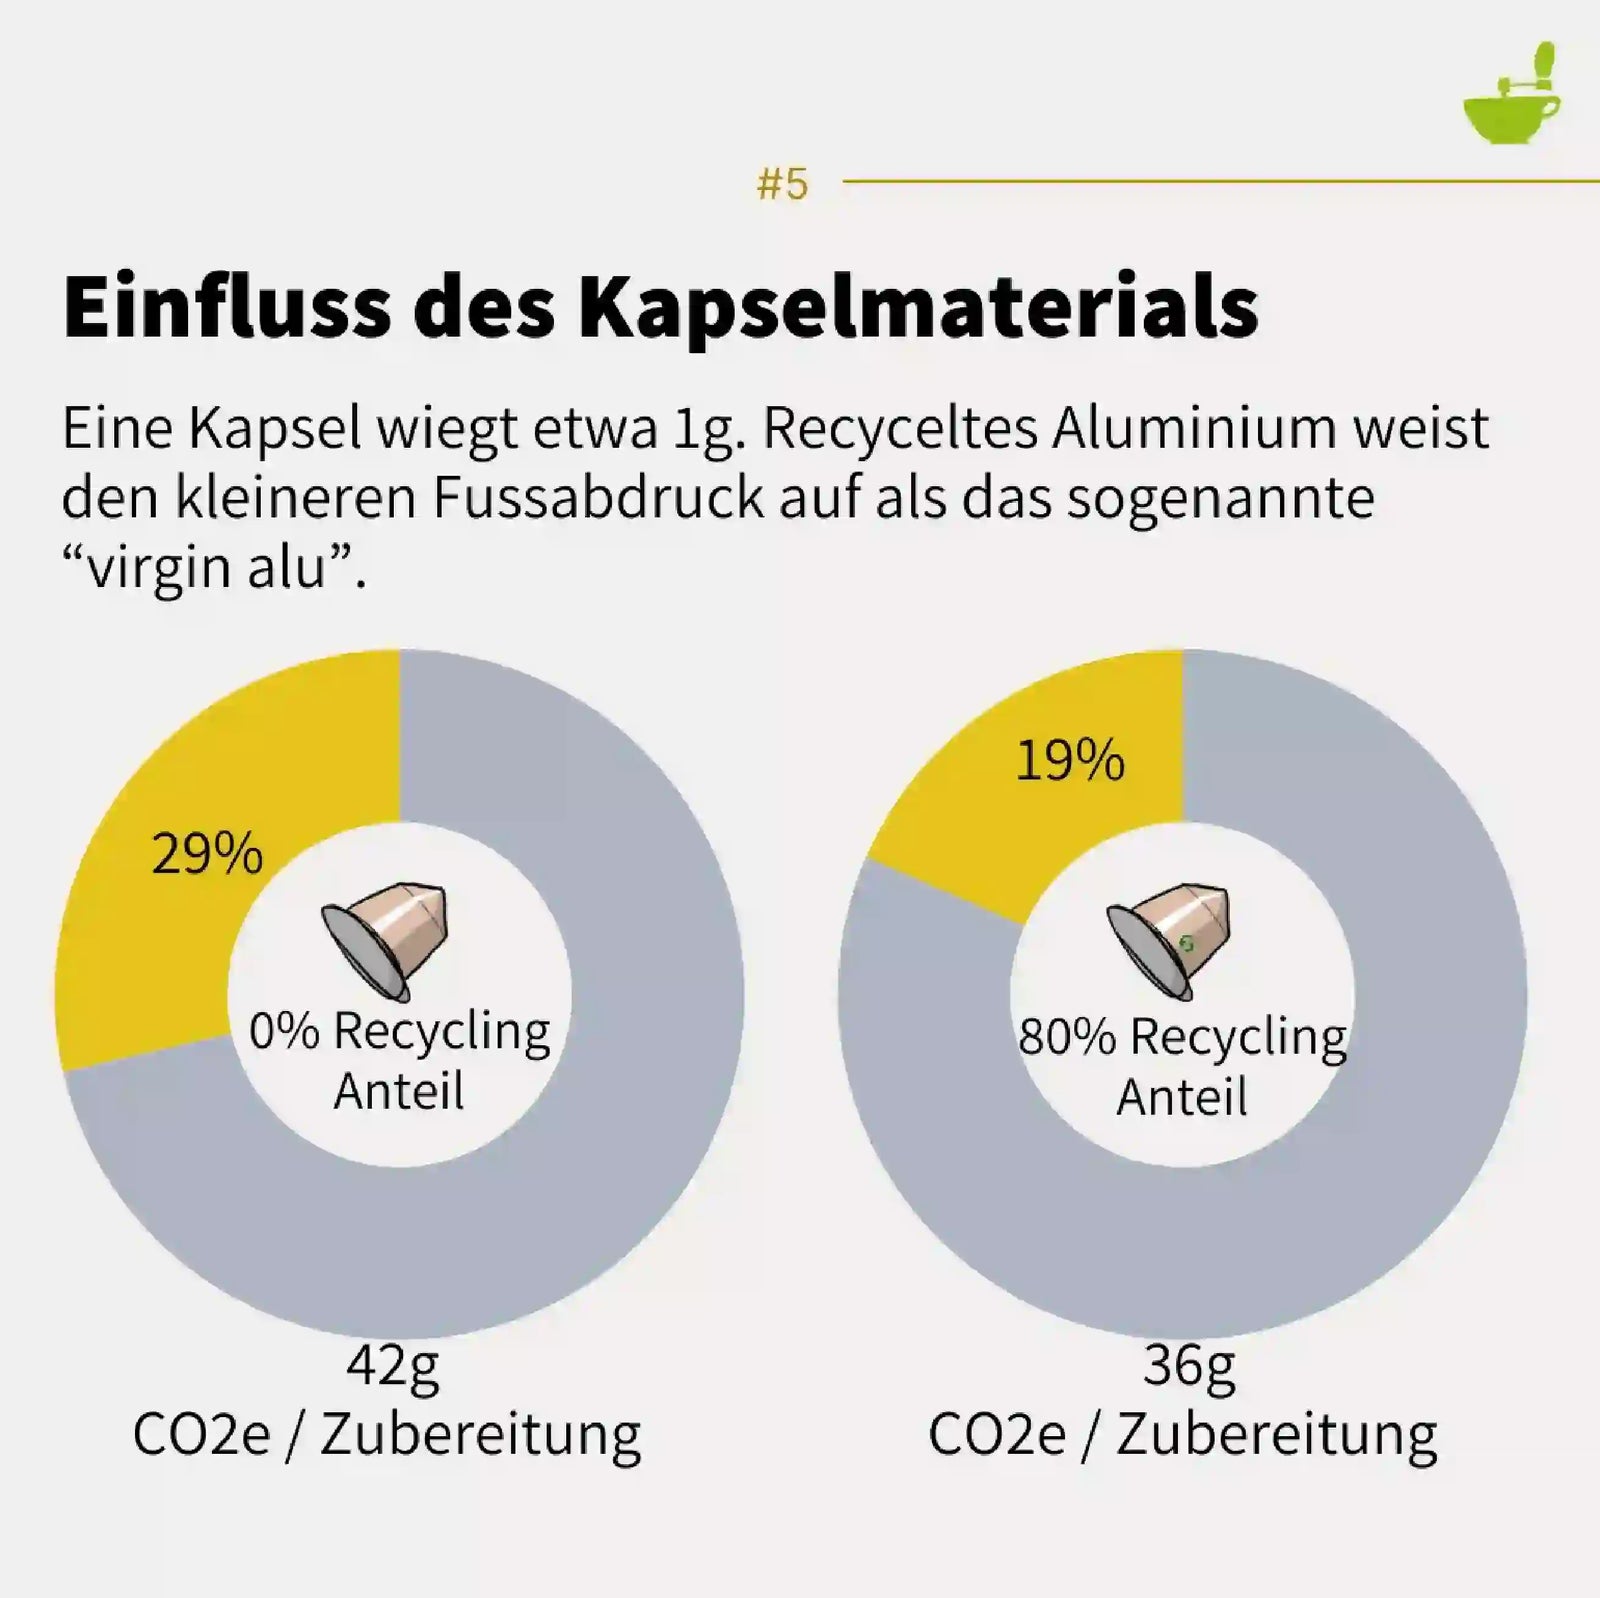
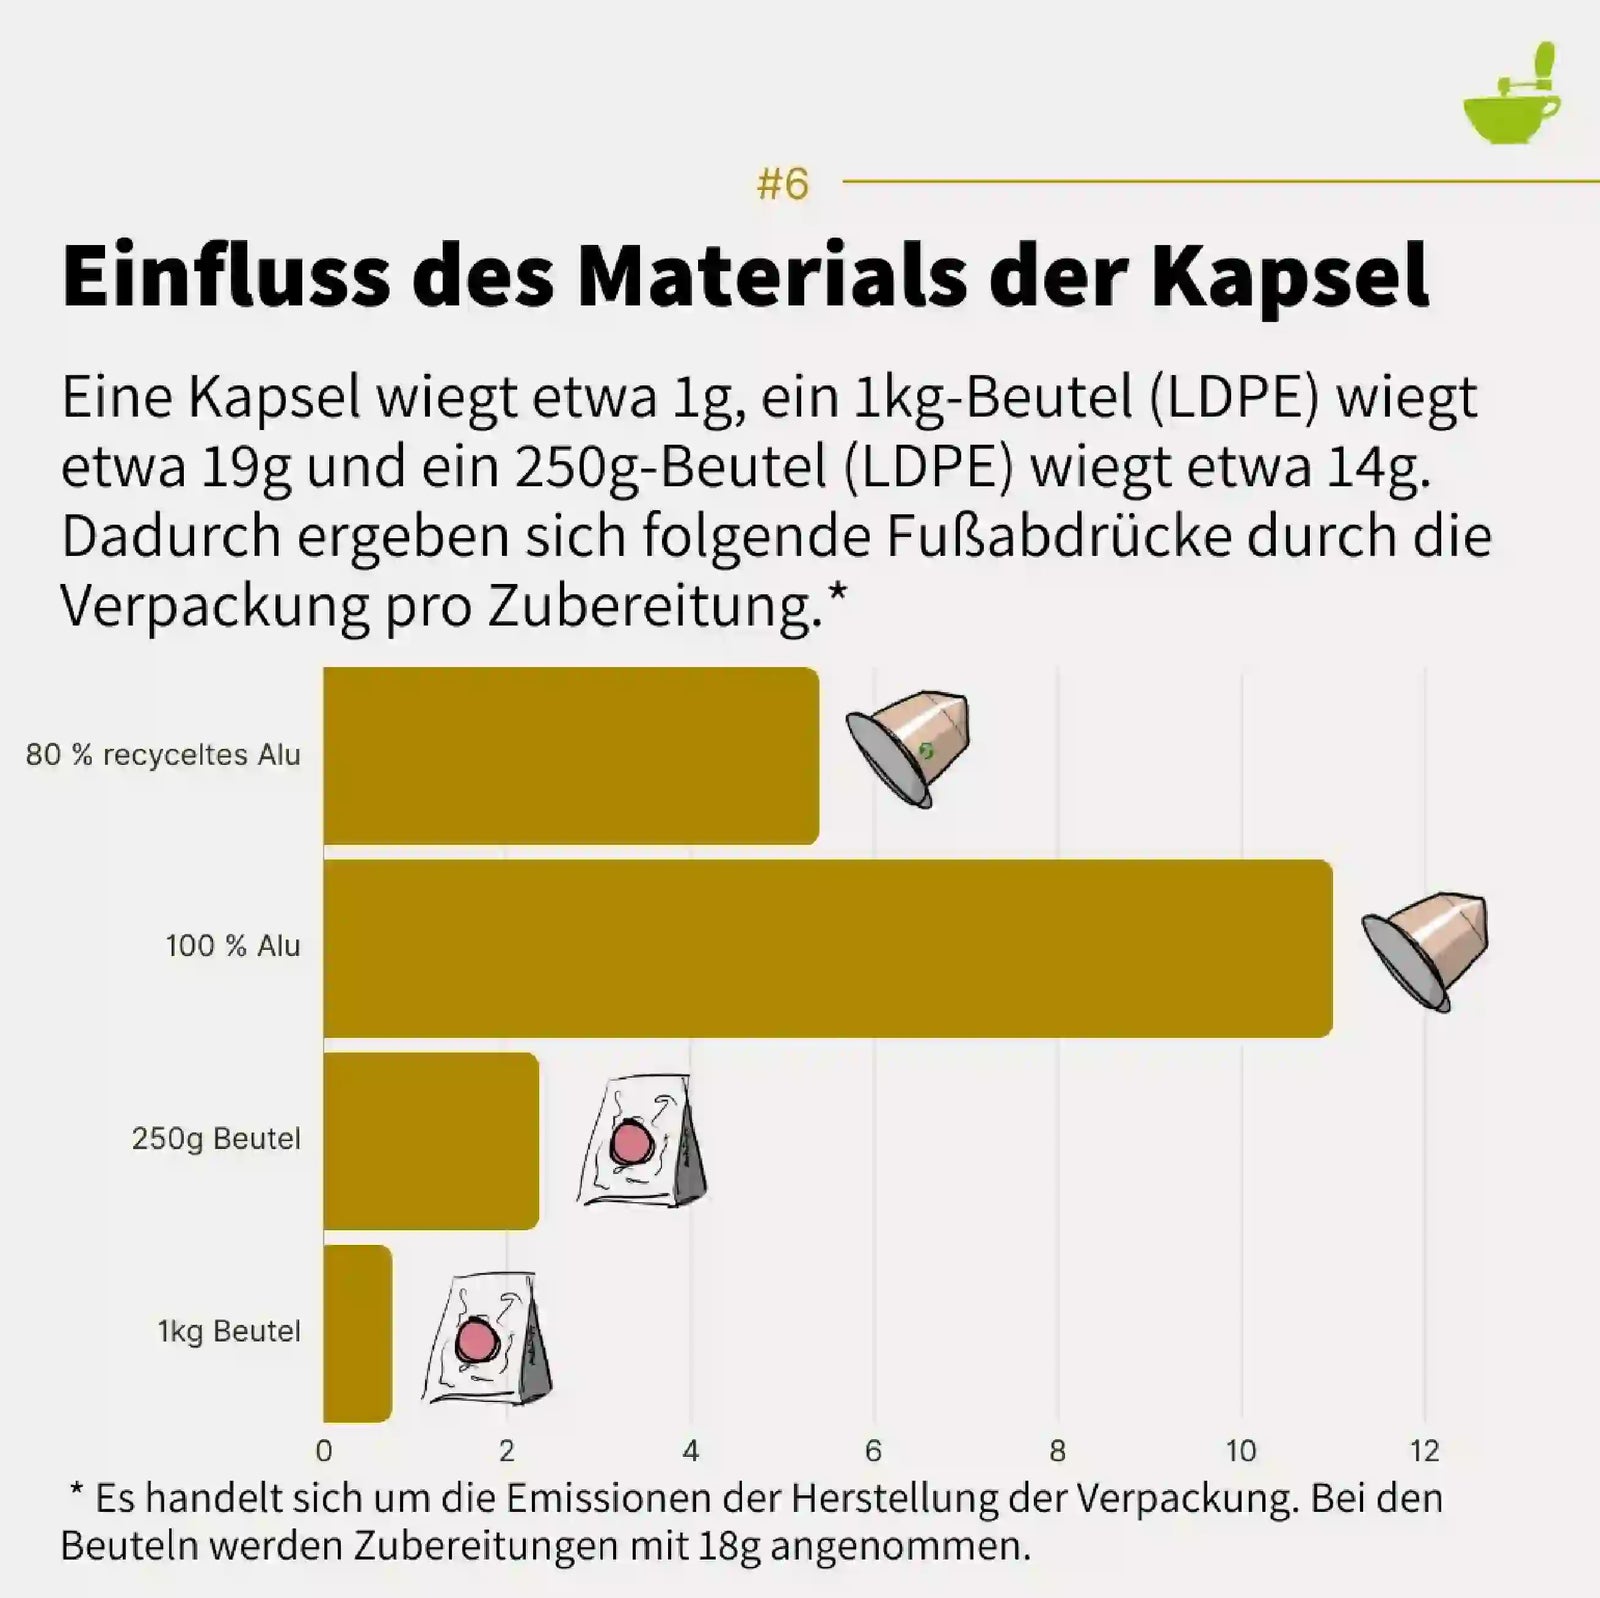
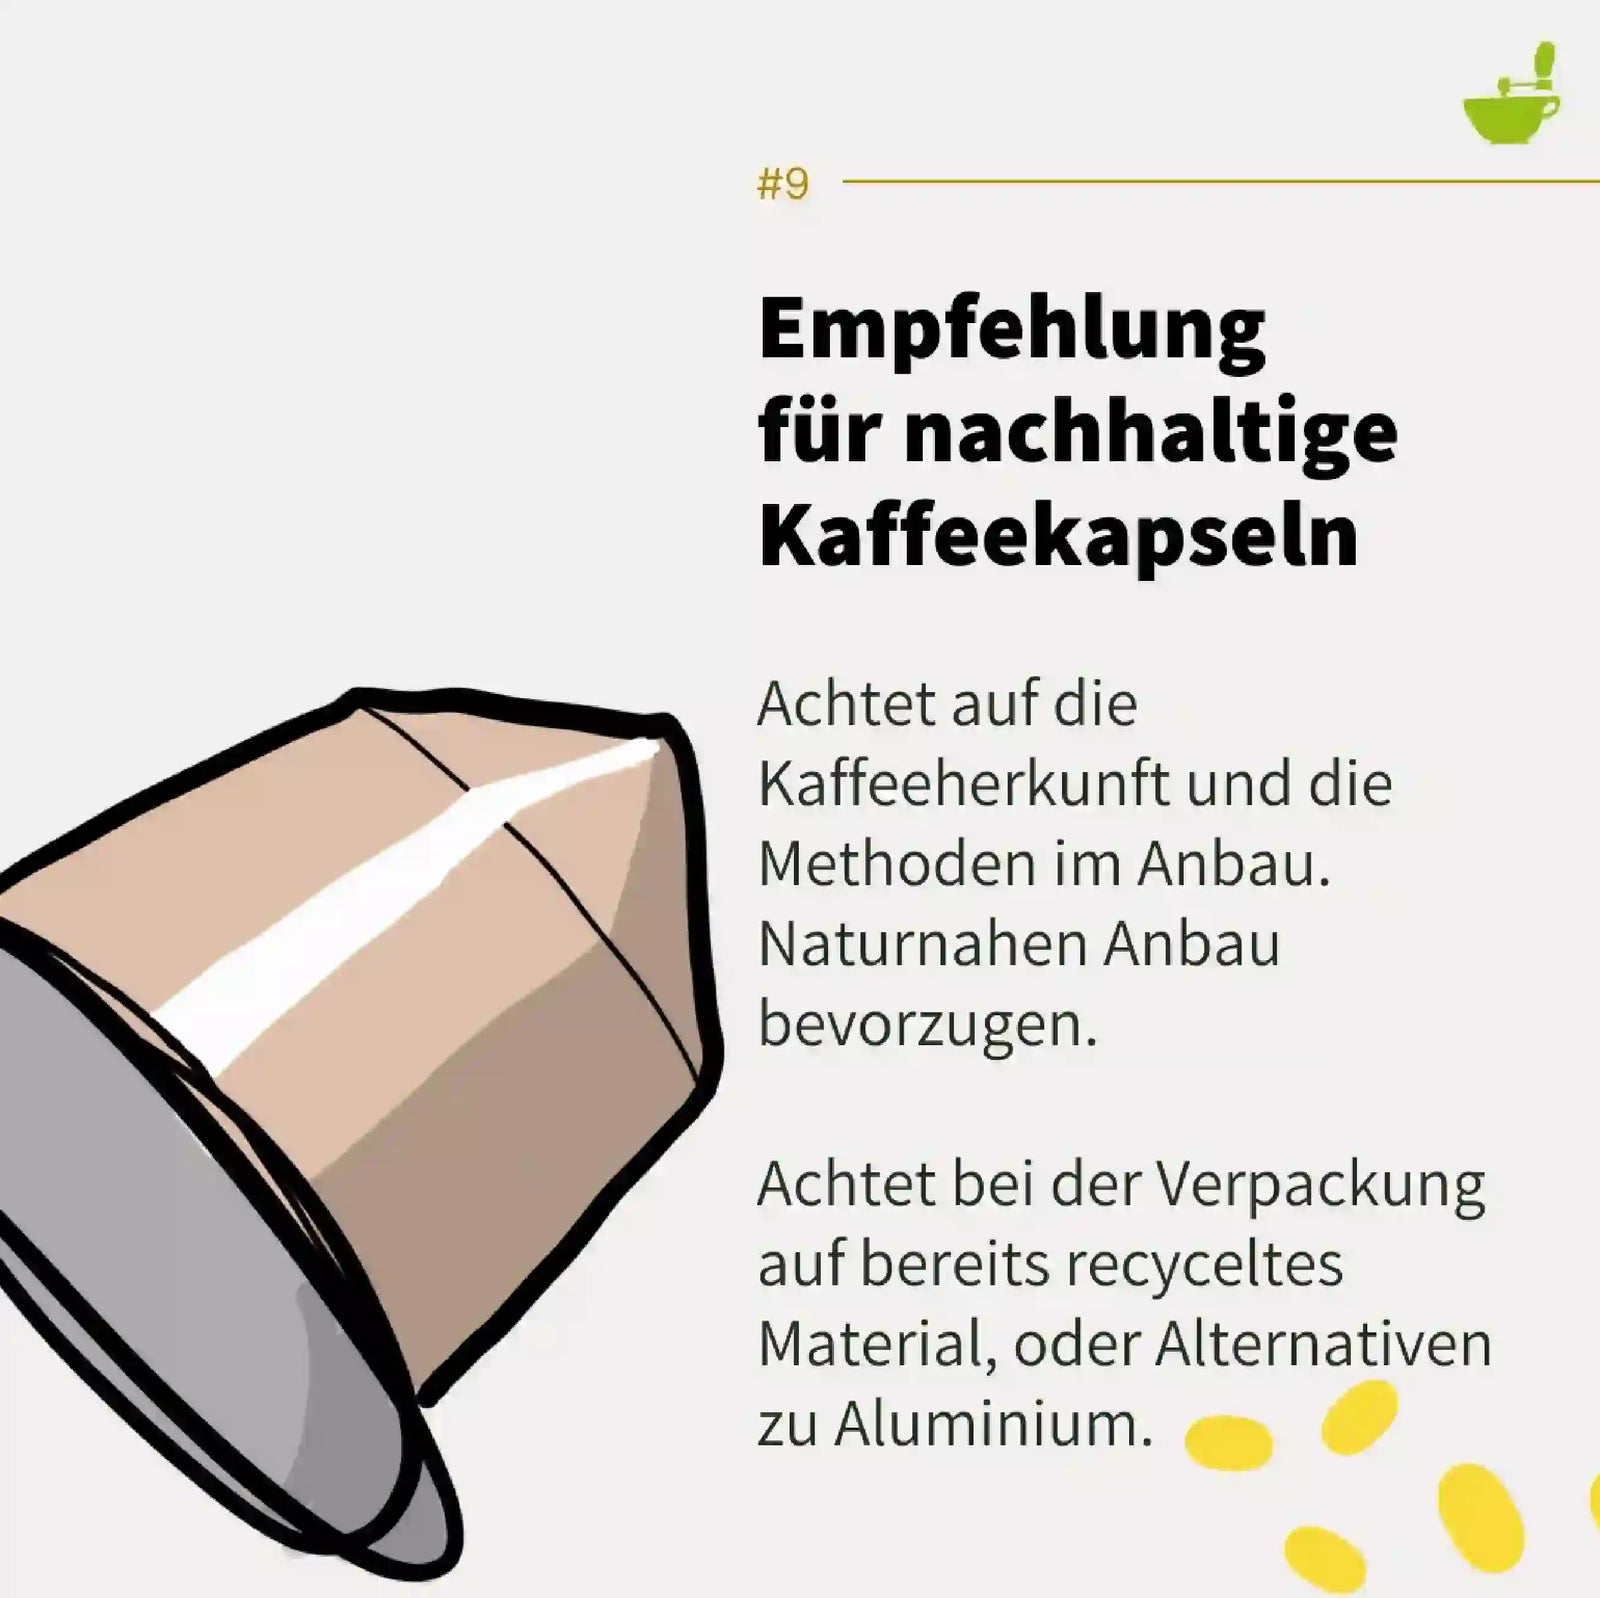
Sind Kaffeekapseln nachhaltig?
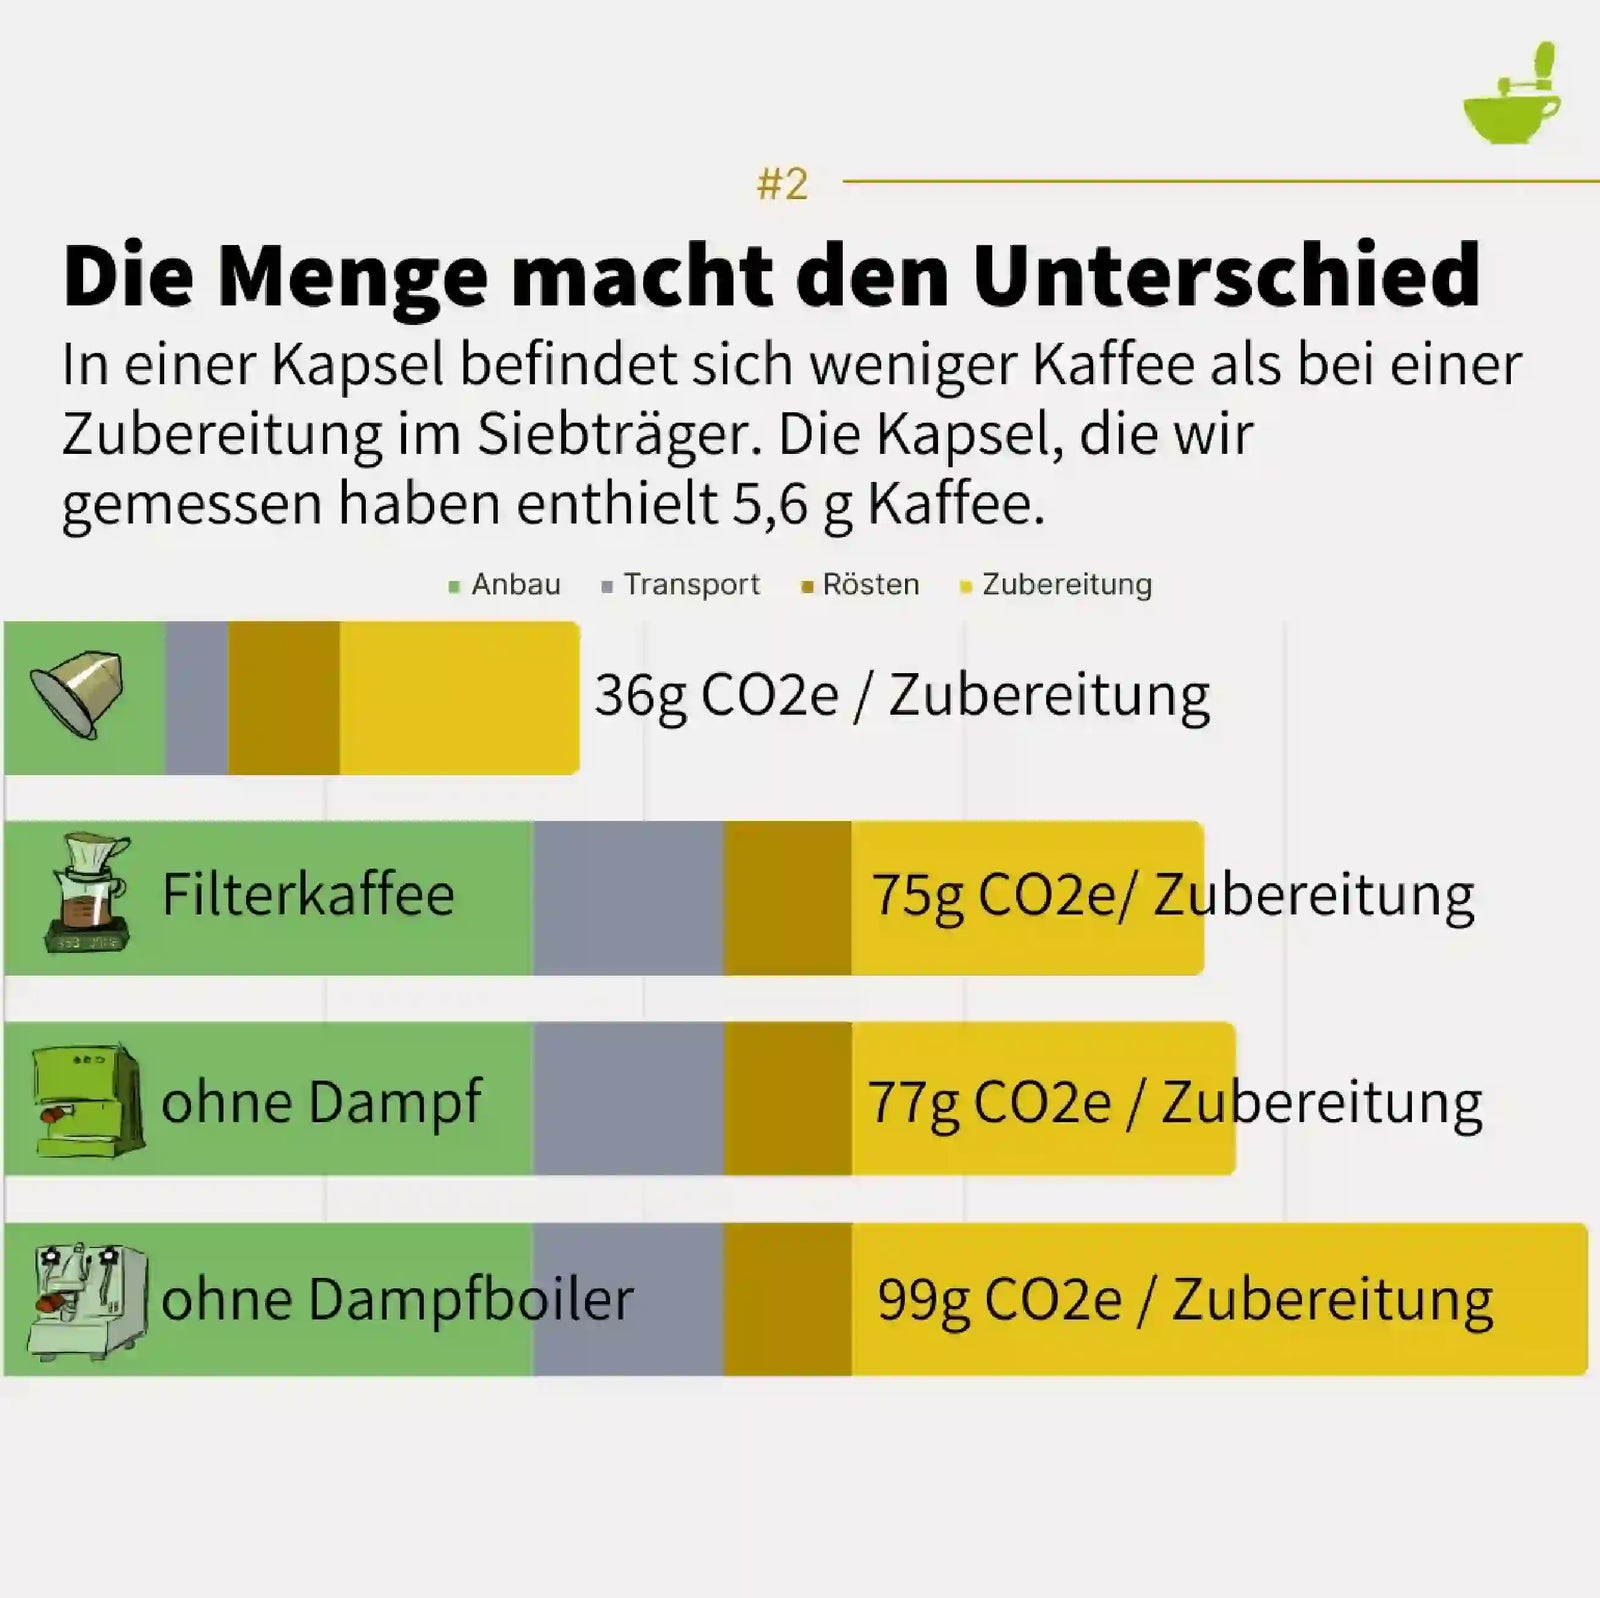
Eine Diskussion, die oft mit Leidenschaft geführt wird. Wie schneiden die Kaffeekapseln ab? Basis unserer Betrachtung ist die Basis eine Zubereitung, das wäre ein doppelter Espresso aus der Siebträgermaschine, 280 ml Filterkaffee oder eben ein Getränk aus einer Kapsel.
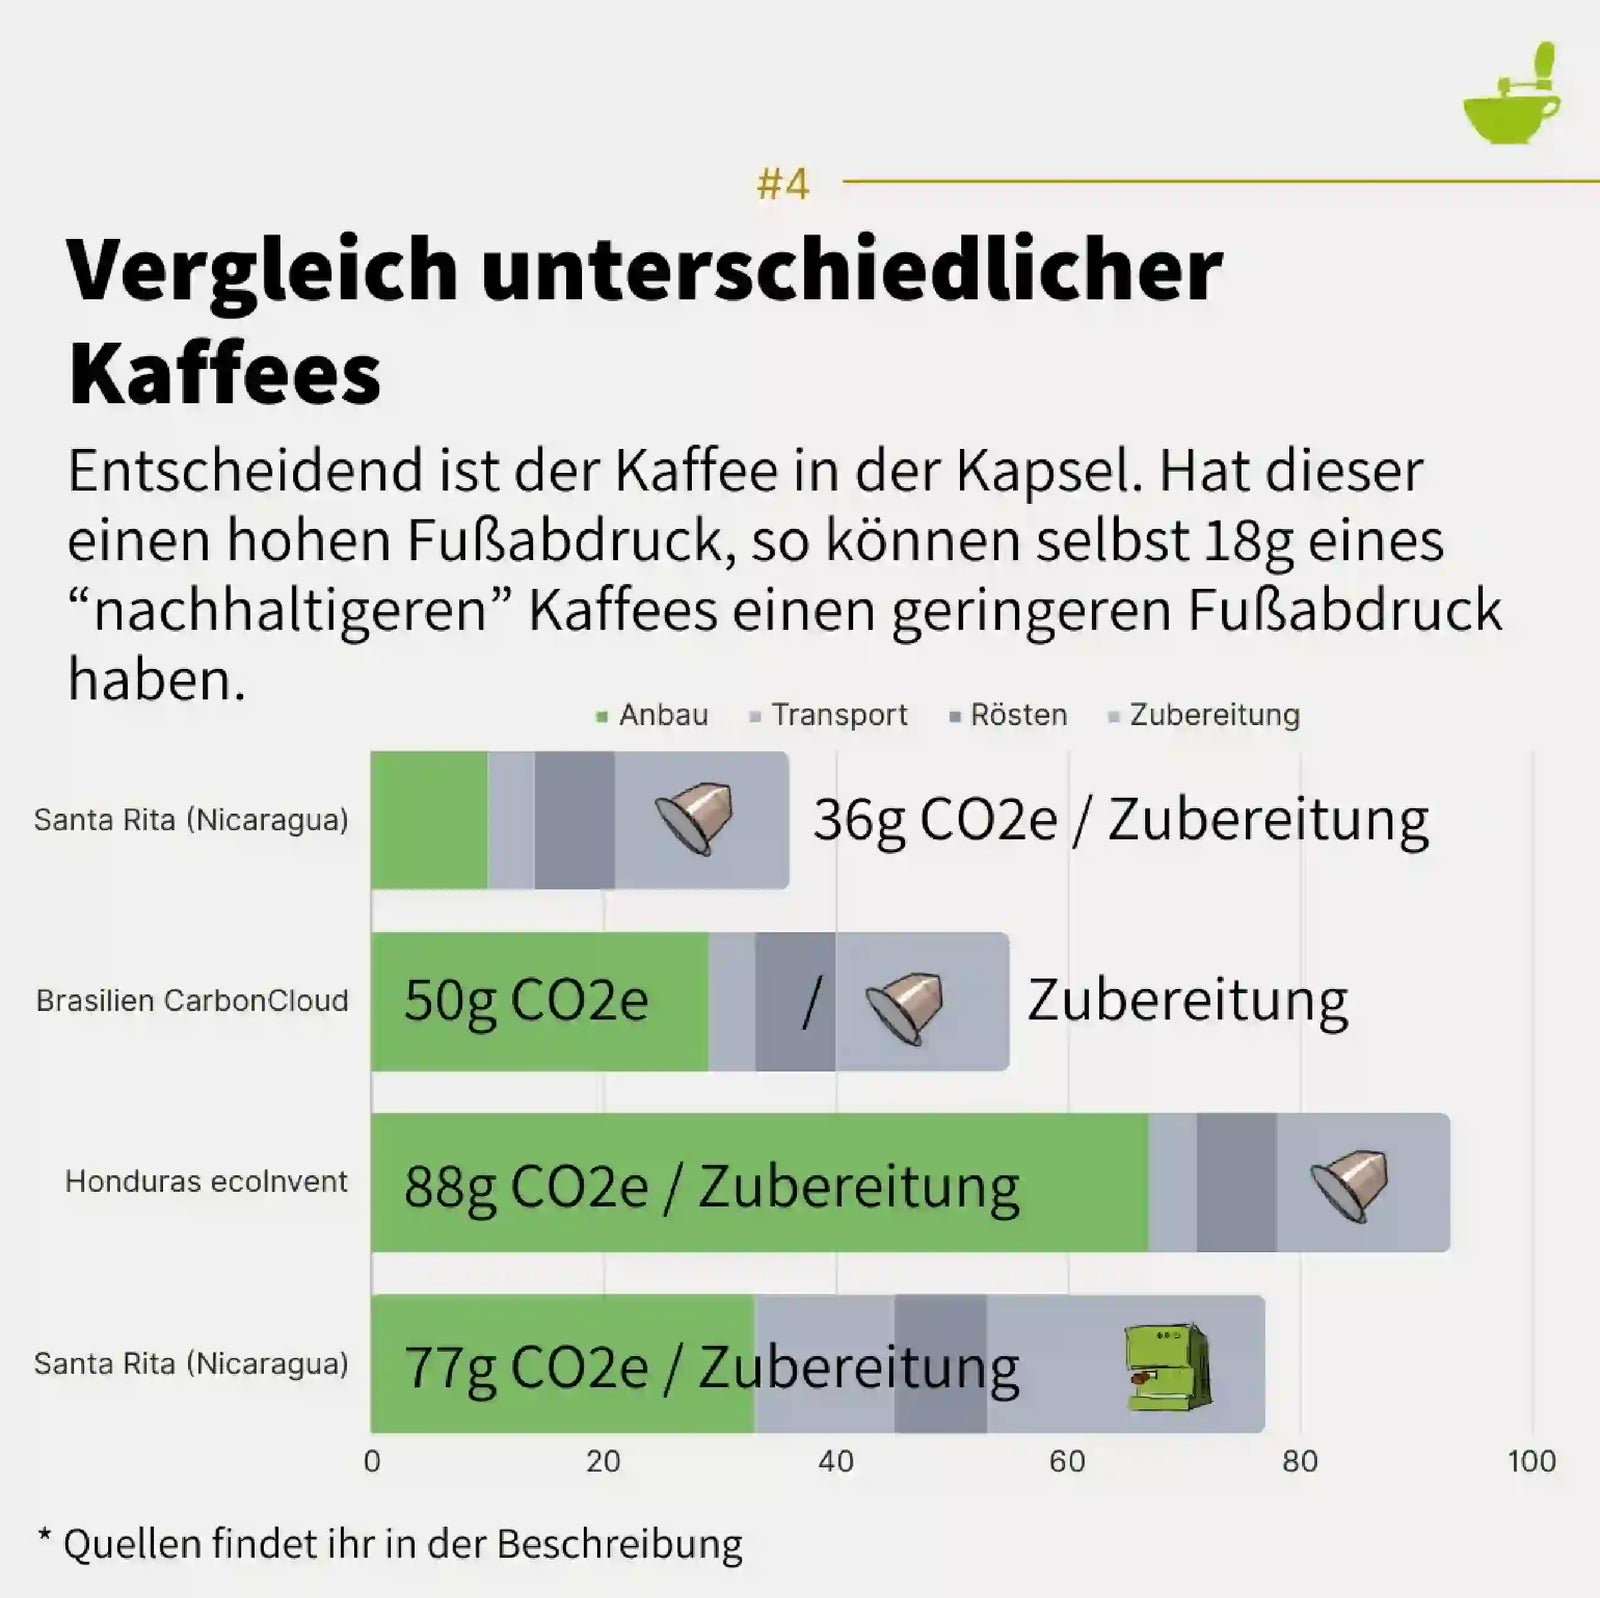
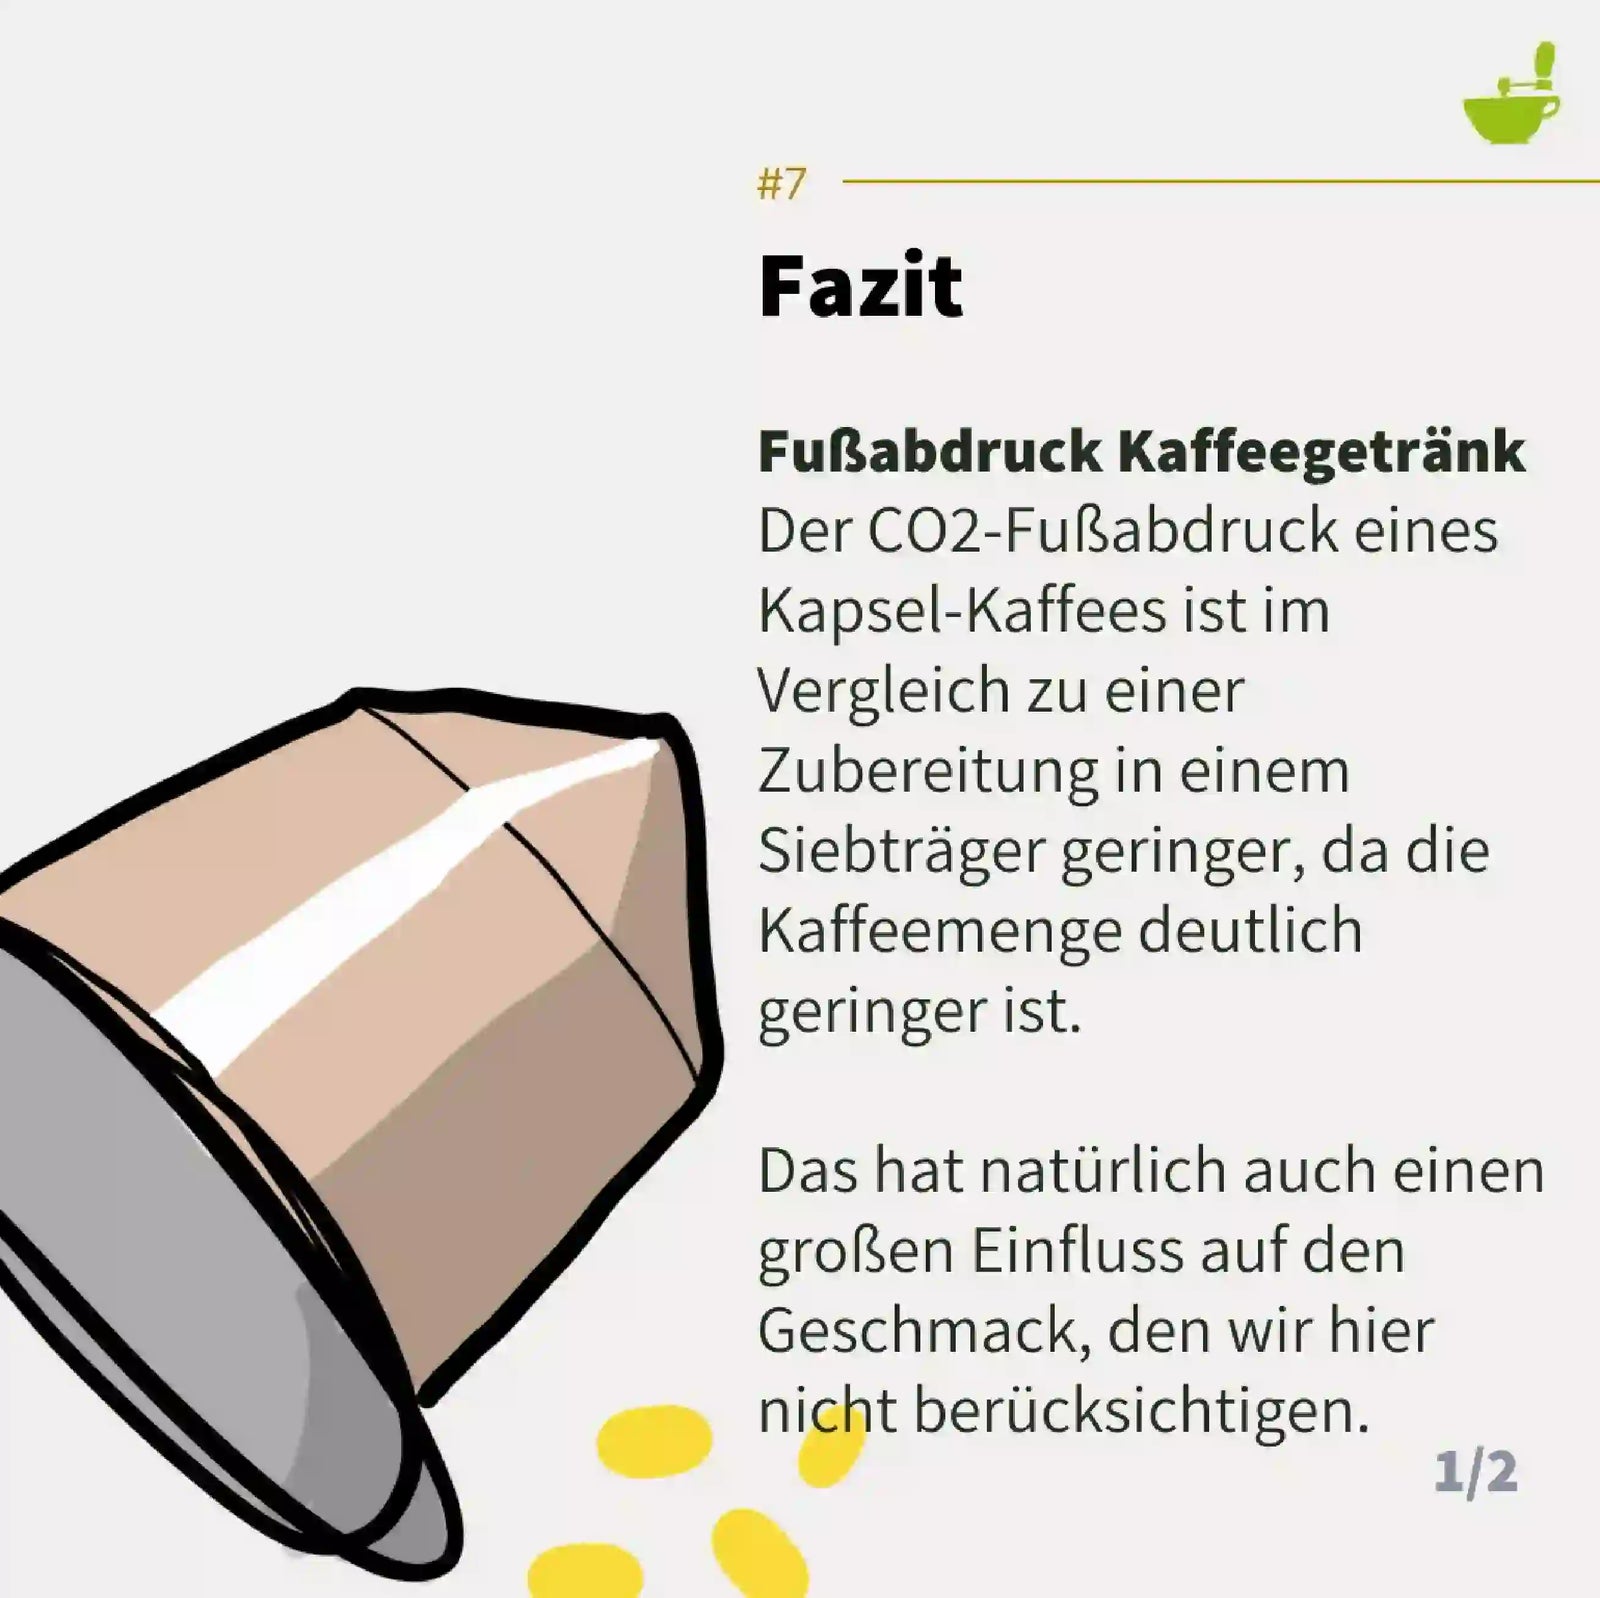
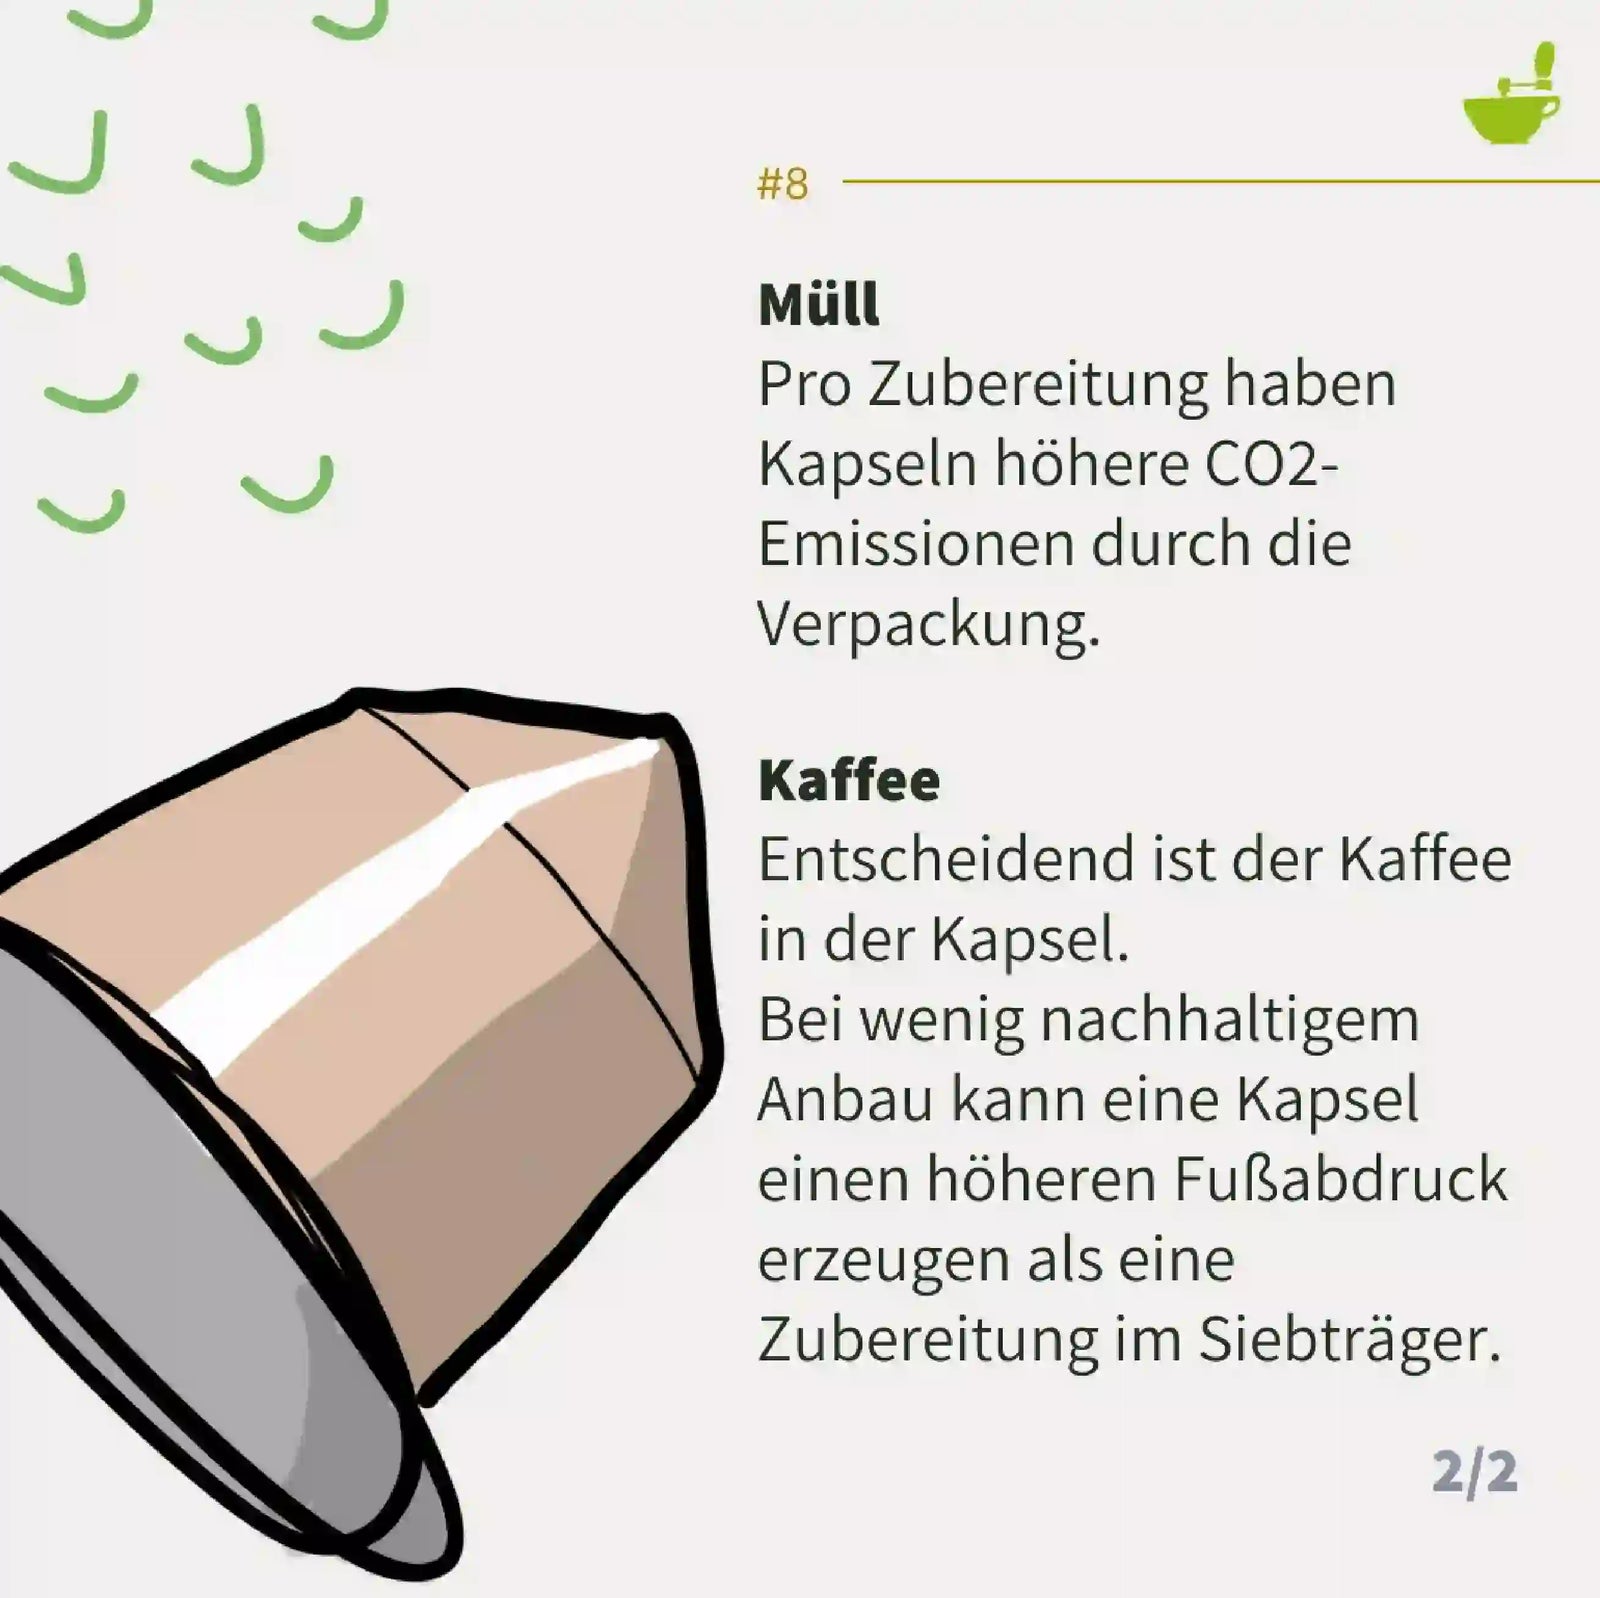
Die Zubereitung aus einer Kapsel schneidet besser ab als die anderen Zubereitungen. Grund dafür ist die geringe Menge Kaffee, die für eine Zubereitung benötigt wird. Das gilt aber nur, wenn für jede Zubereitungsart auch der gleiche Kaffee verwendet wird.
Für die Kapseln gilt also auch, achtet vor allem auf den Kaffee in den Kapseln.
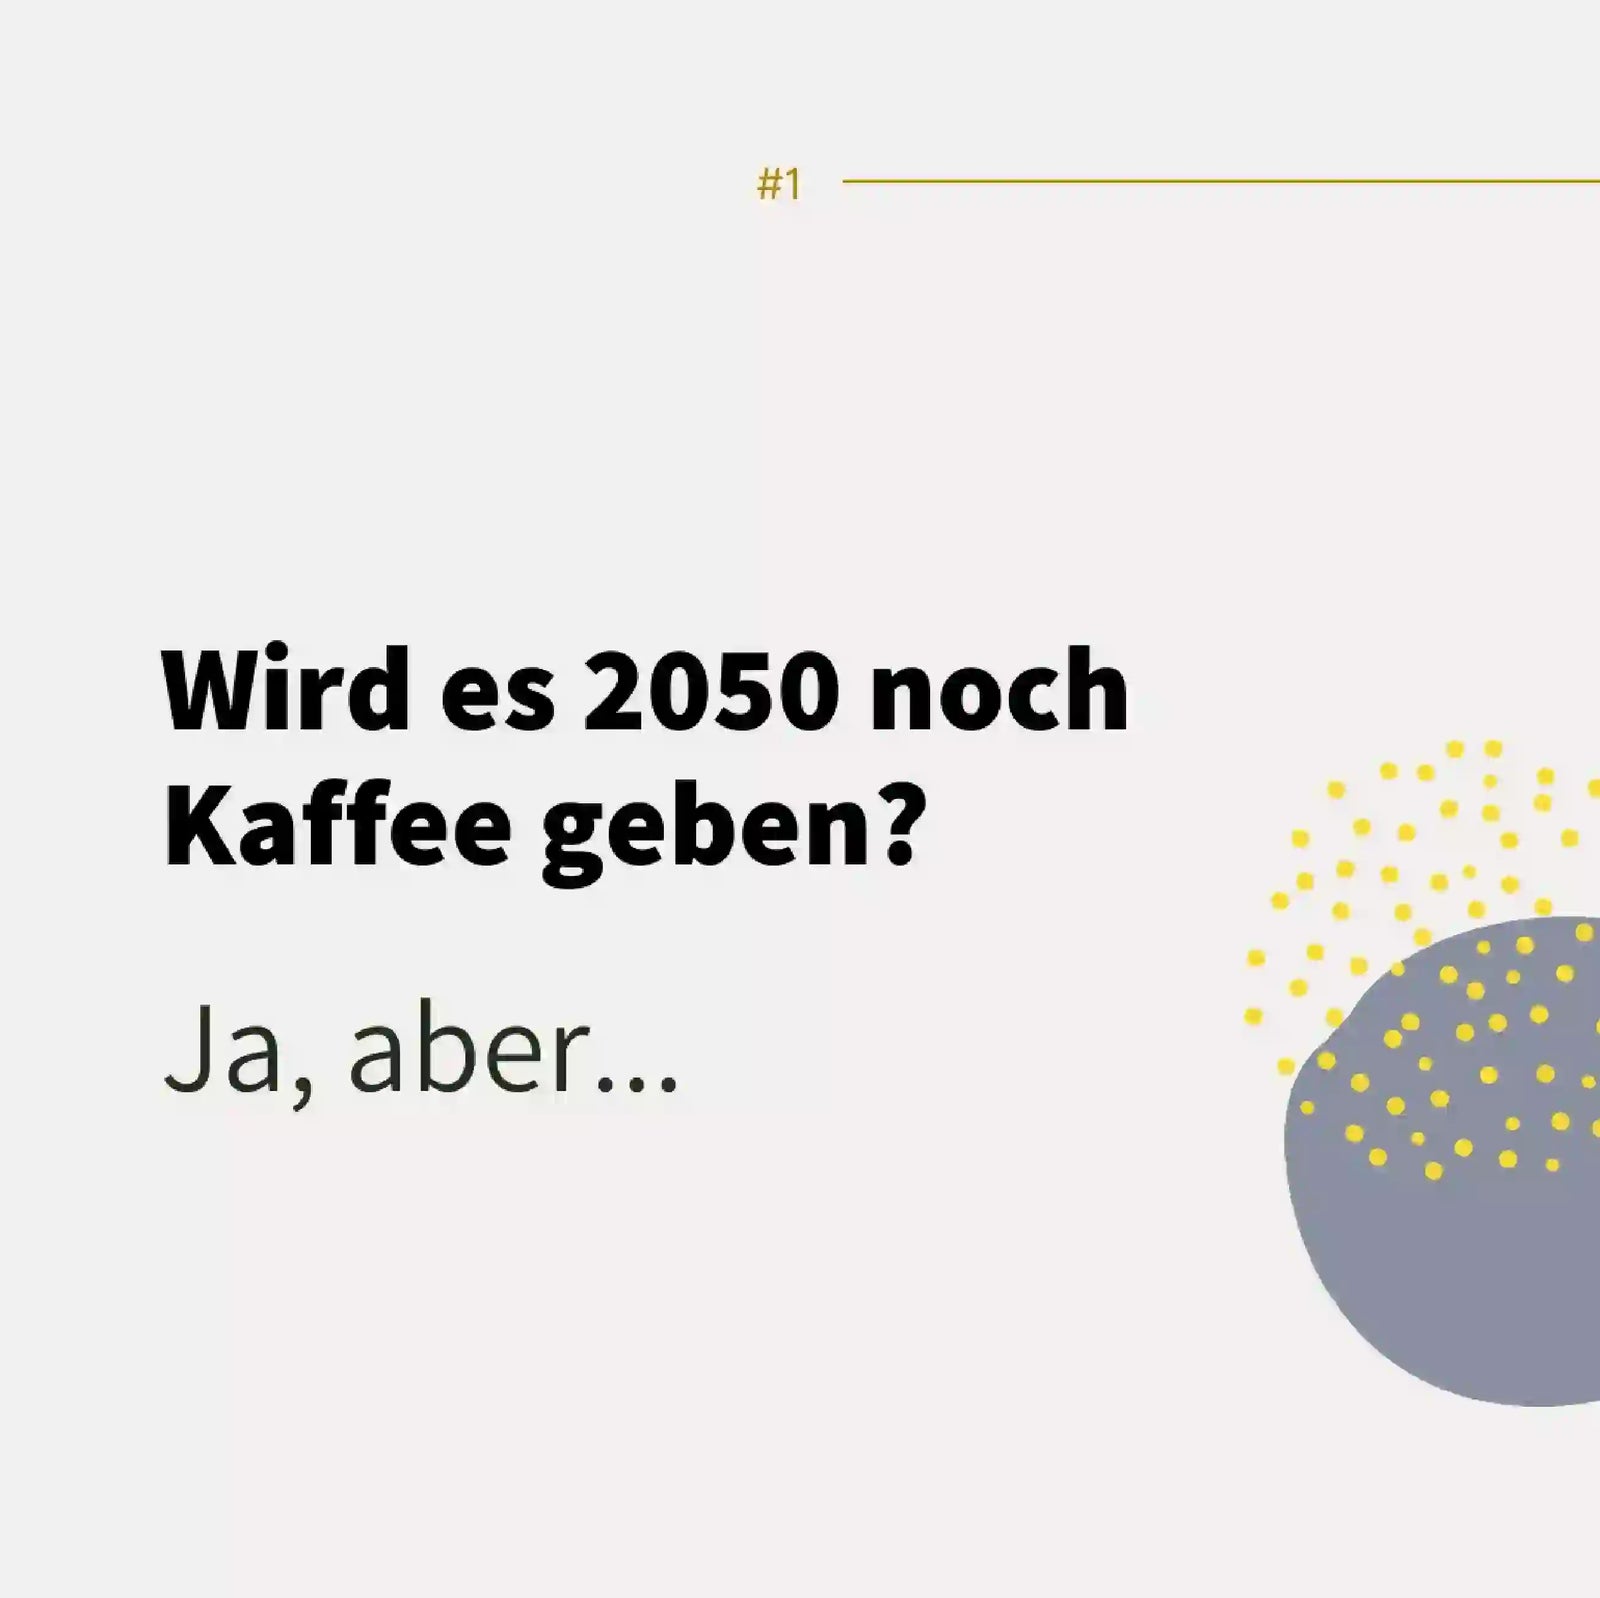
Wird es 2050 noch Kaffee geben?
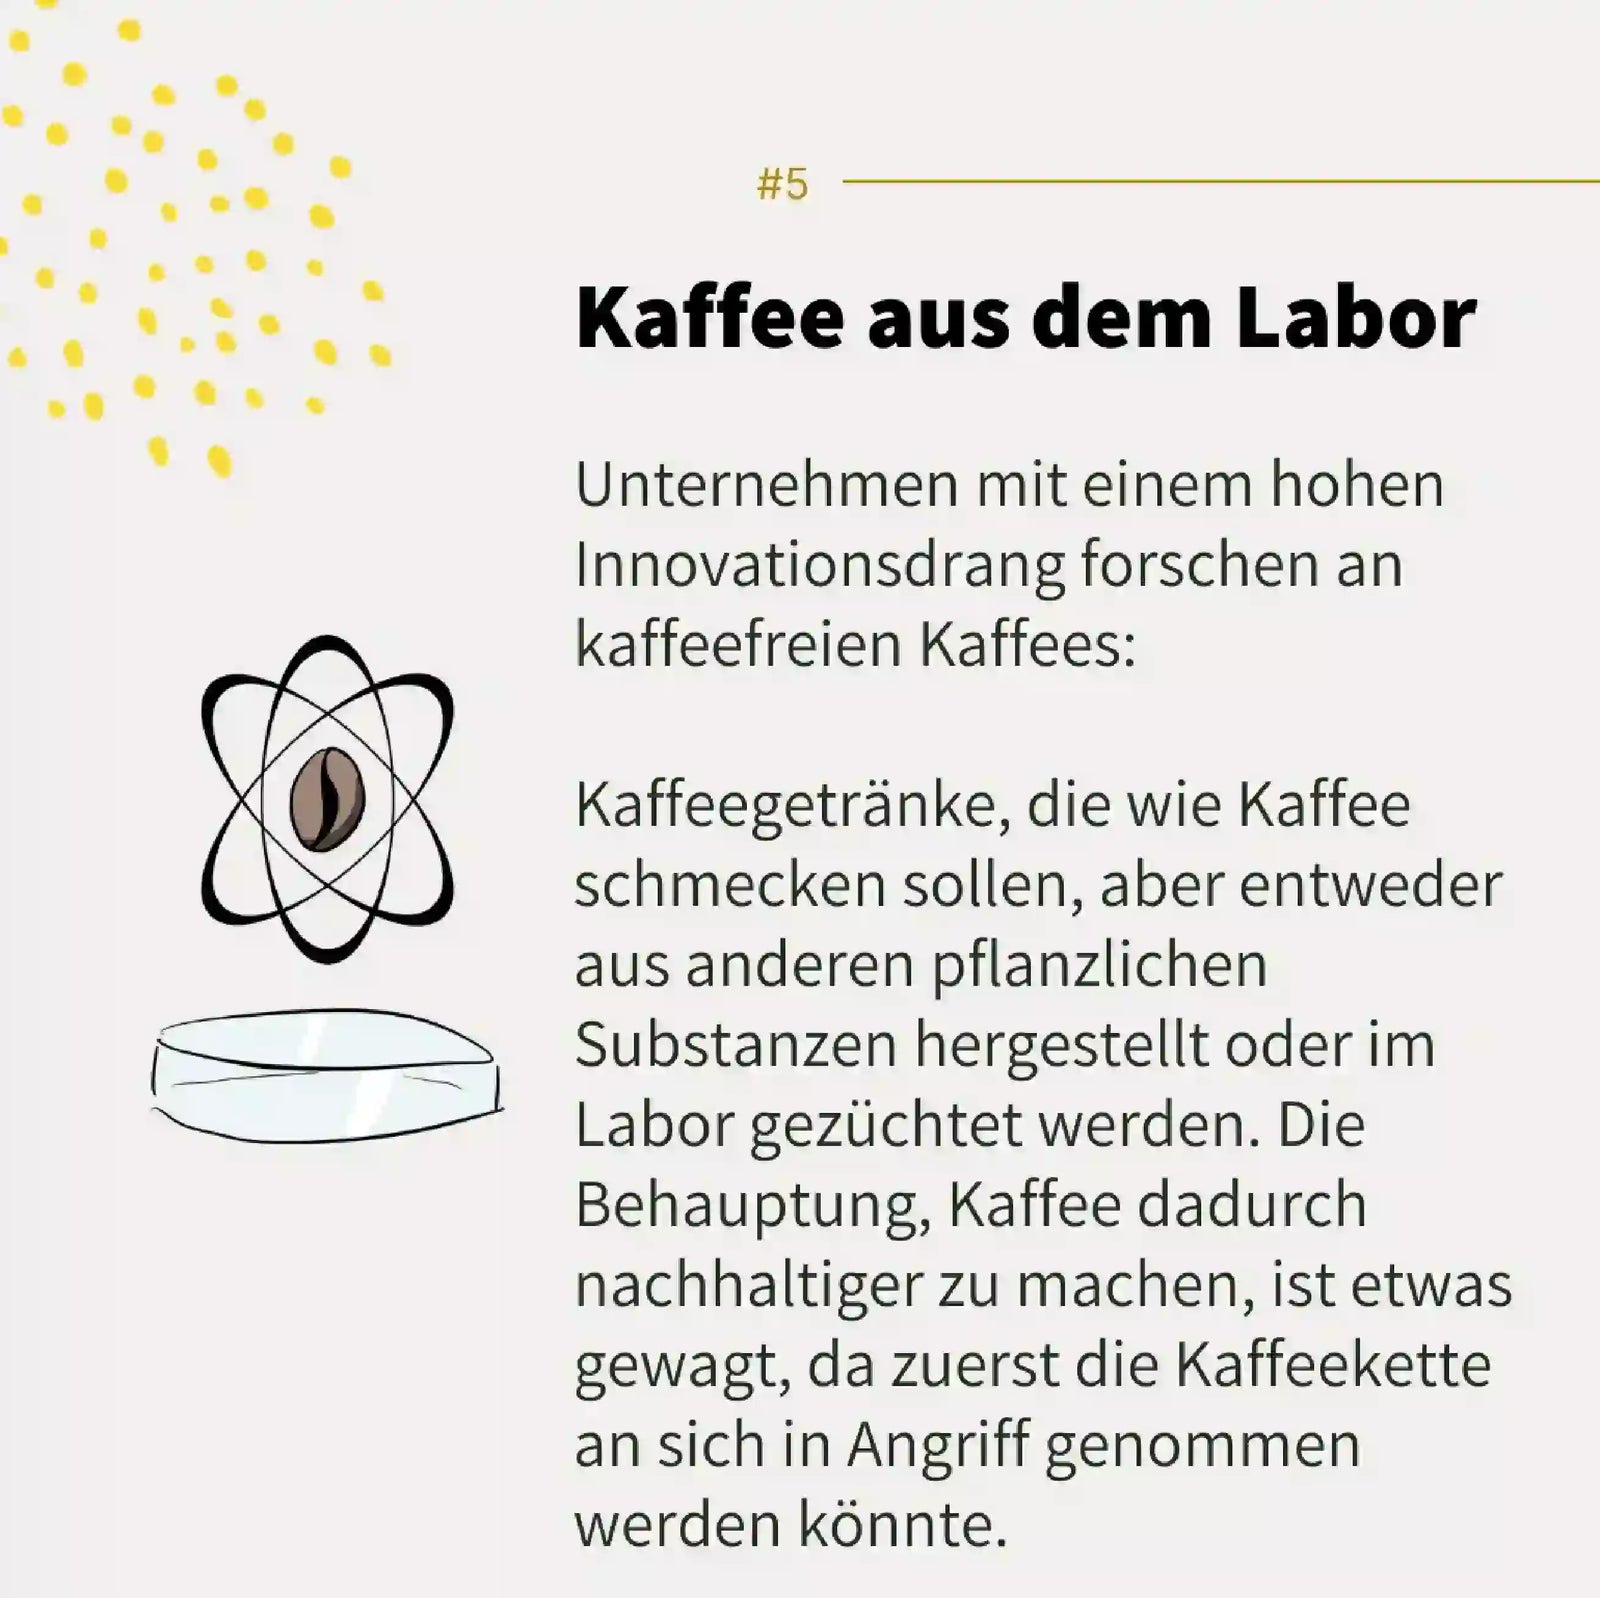
Ja, aber: es wird sich Vieles verändern, nicht zuletzt der Geschmack: außerordentliche Kaffees wird es weniger geben, mehr Kaffees werden nach „Kaffee“ schmecken.
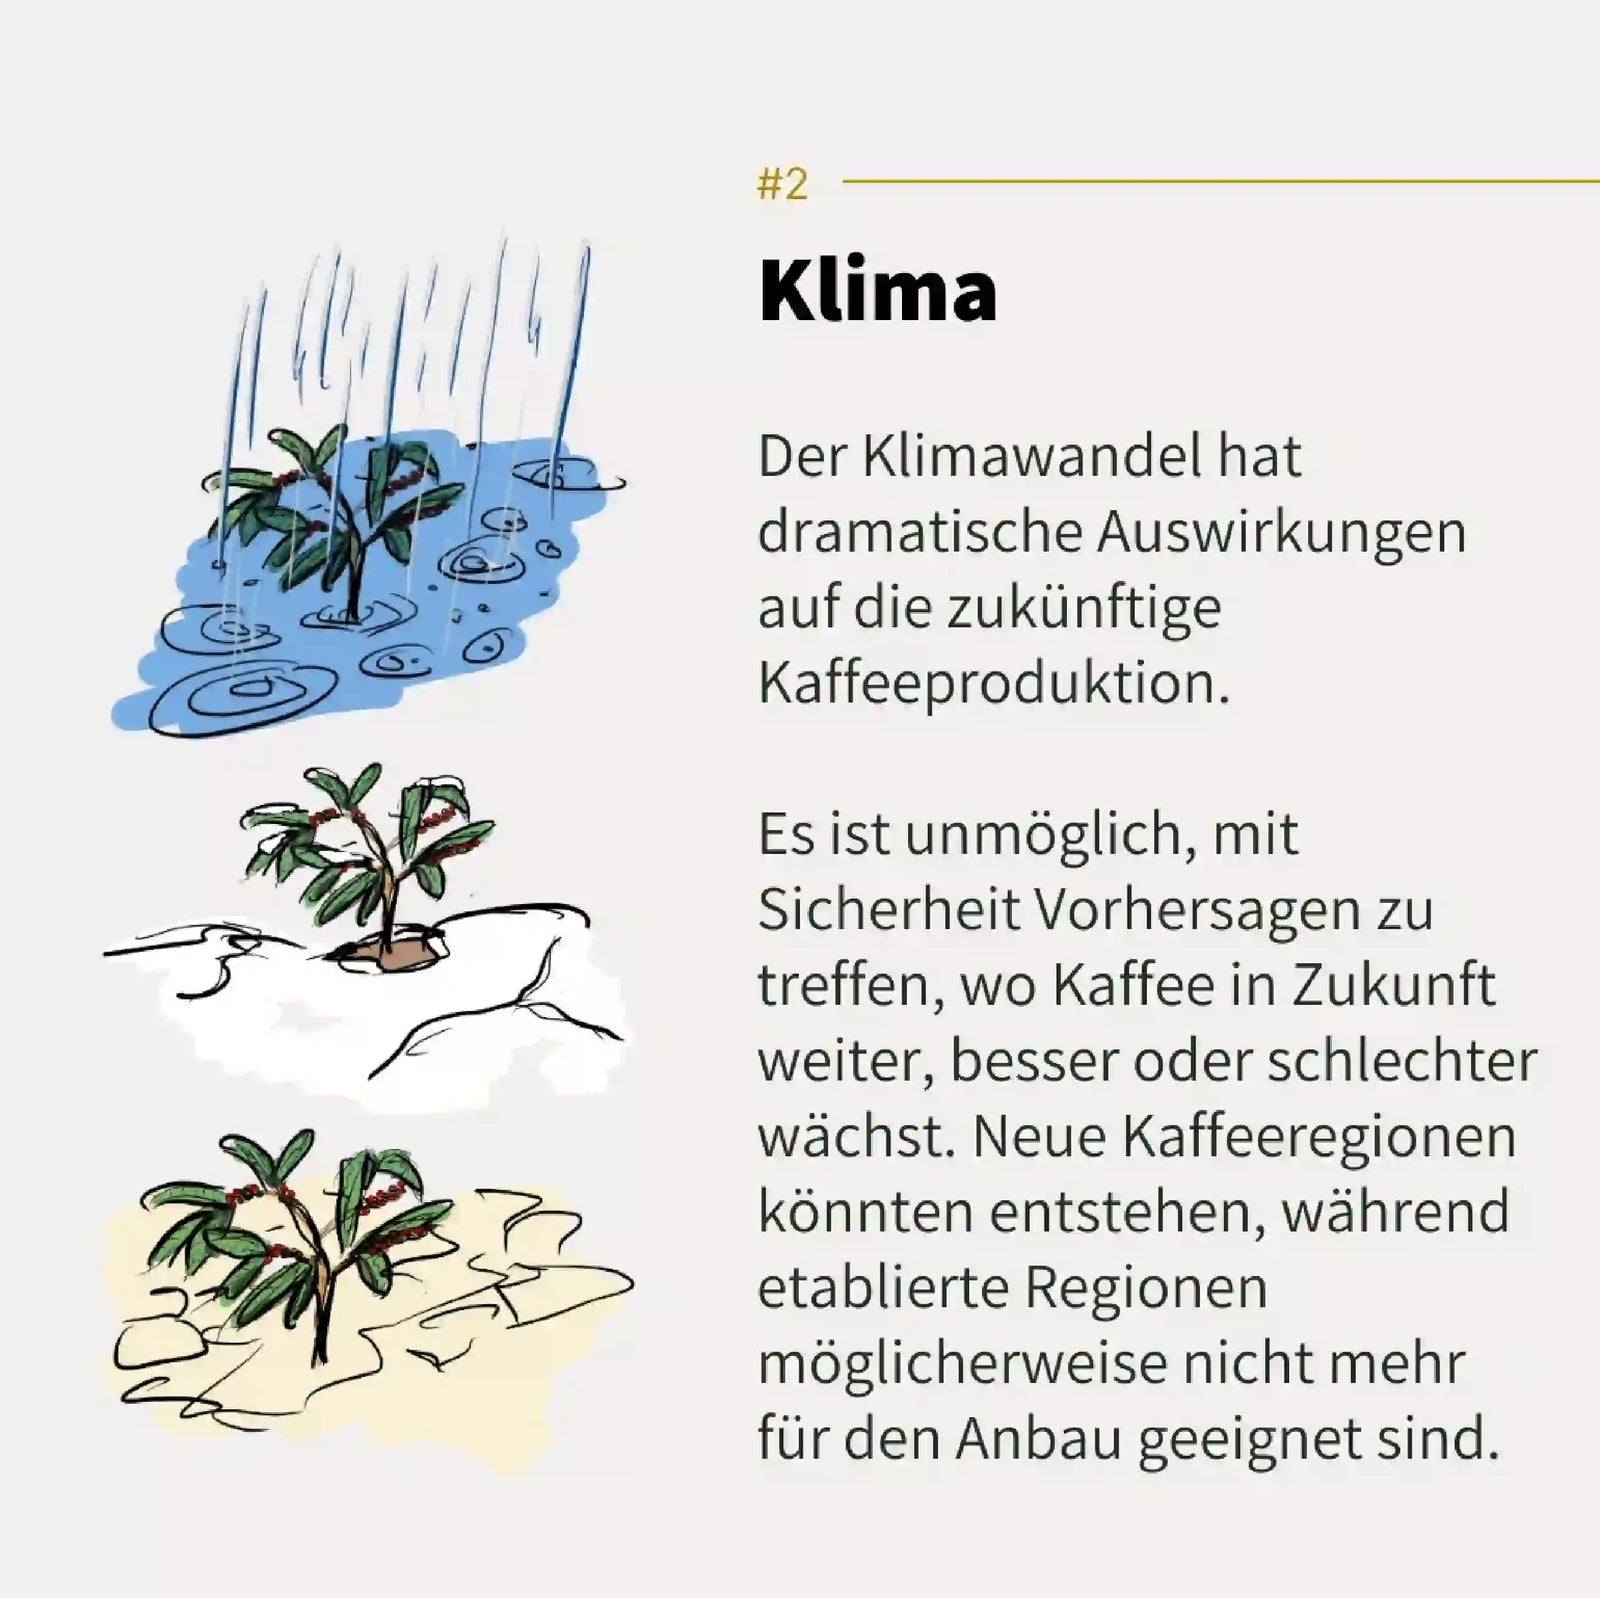
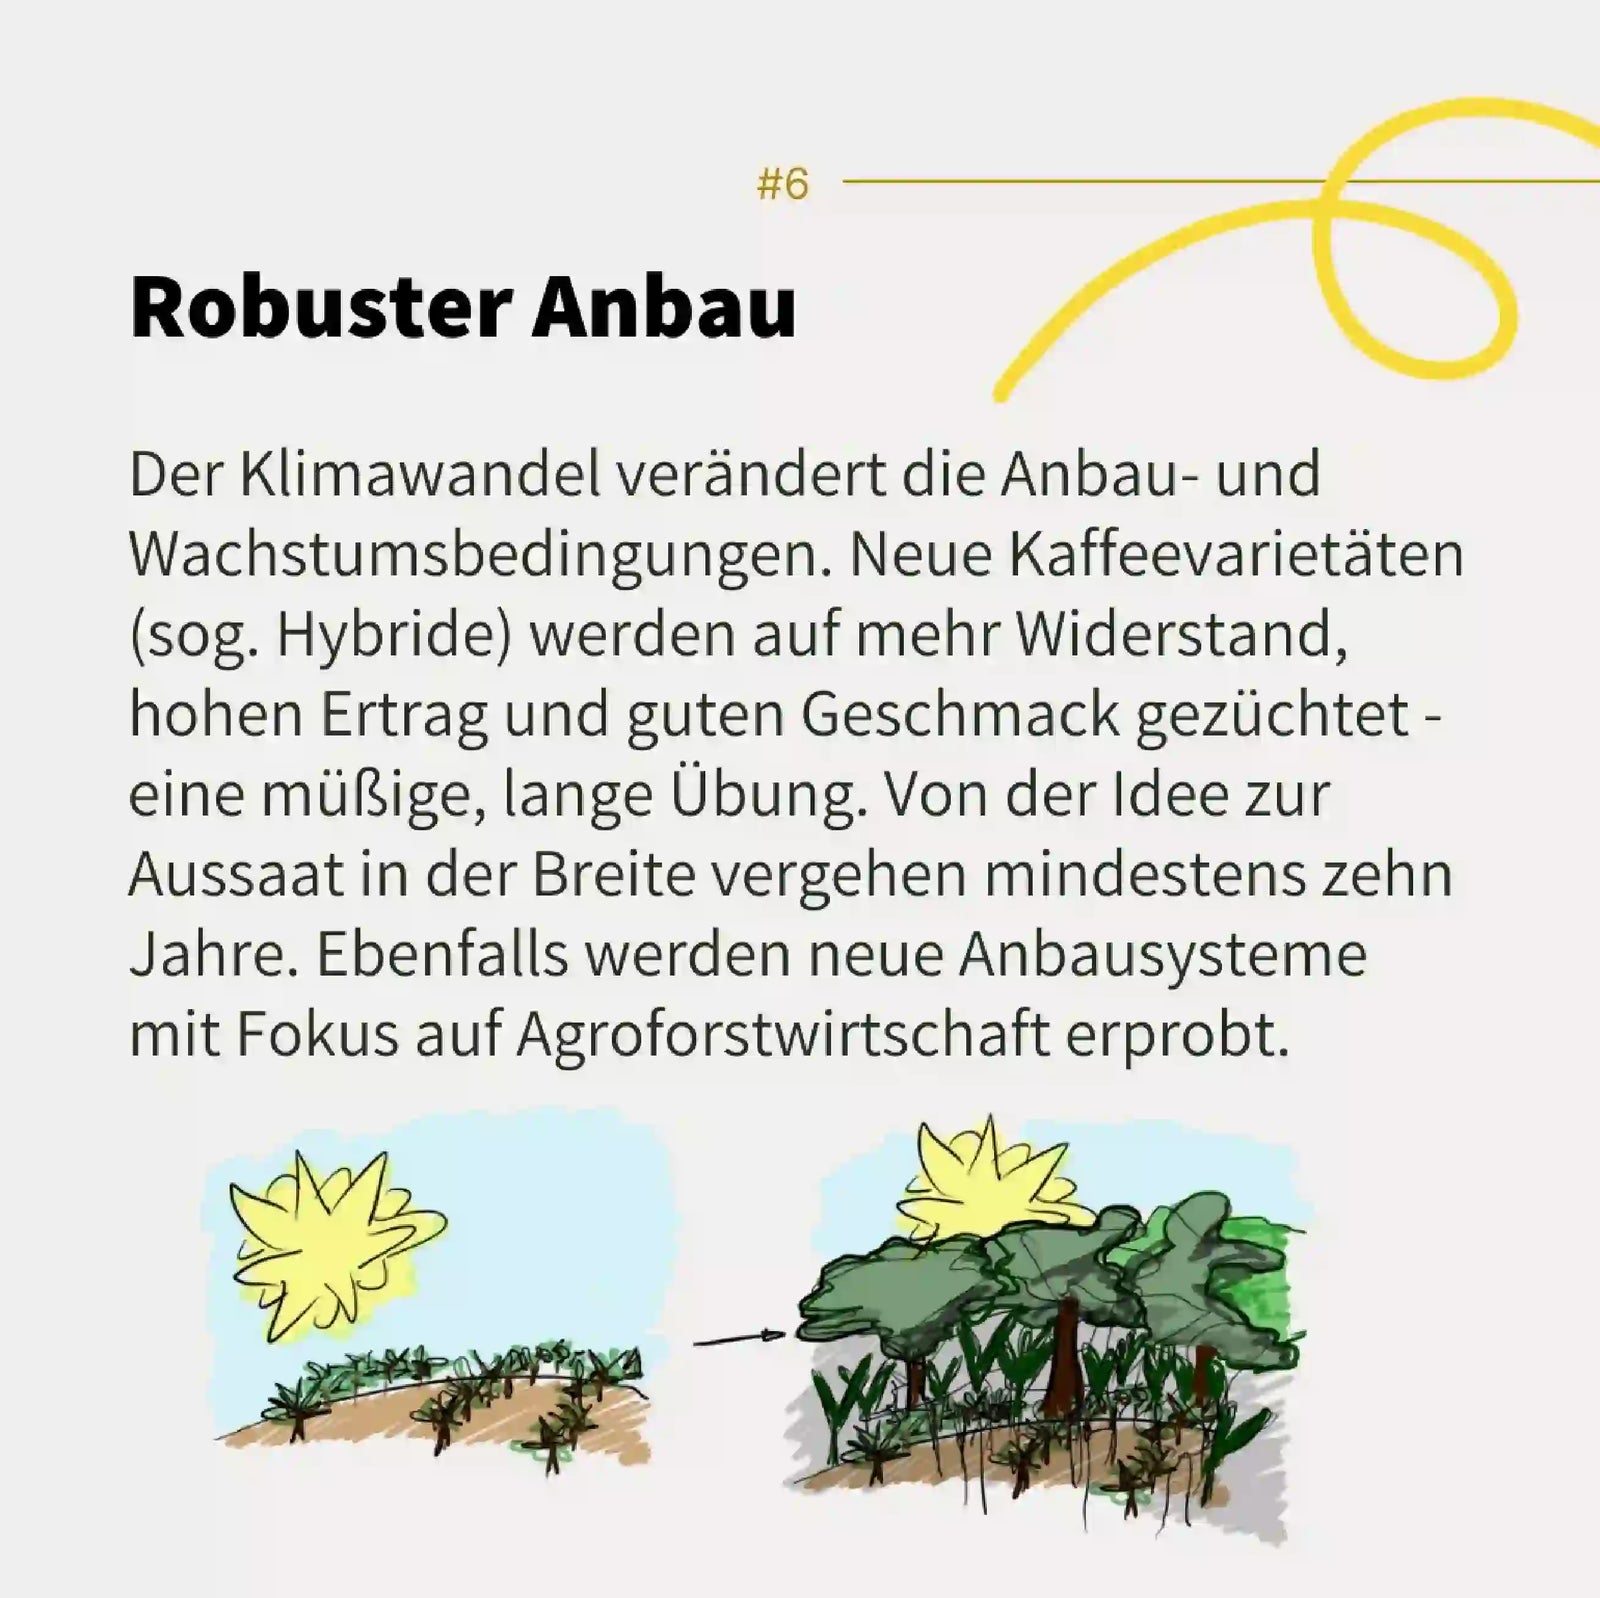
Große Herausforderungen, aber auch Chancen gibt es - nur, wo der Klimawandel wie genau welchen Einfluss haben wird, ist schlichtweg nicht vorhersehbar.
Und weil eine Kaffeepflanze zuerst mal drei Jahre braucht, bis sie Ertrag abwirft, kann die Welt in der Zwischenzeit schon wieder anders ausschauen.
Deshalb: genießt euren Kaffee bewusst.