


Refractometers are scientific instruments that measure the refractive index of a liquid – simply put, how much light is deflected in a medium. In the world of coffee, the refractive index is directly related to the concentration of dissolved substances in the coffee beverage, known as Total Dissolved Solids (TDS). The TDS value indicates what percentage of the drink consists of dissolved coffee particles – it is a measure of the coffee strength. Stronger coffee has a higher TDS percentage, while thinner coffee has a correspondingly lower one. By measuring TDS, baristas can objectively assess the extraction during the brewing process and make it reproducible.
However, not every refractometer used in laboratory settings is suitable for coffee. A standard Brix meter measures sugar (1 °Bx = 1 g of sucrose in 100 g of solution). For coffee, you need a conversion factor: 10 °Bx corresponds to approximately 8.5 % TDS (factor ~0.85). Inexpensive handheld Brix meters also only have coarse scales (resolution often 0.2 °Bx ≈ 0.1 % TDS) – too inaccurate for the subtle differences in filter coffee (~1.3 % TDS). Specialized coffee refractometers are precisely calibrated for coffee solutions and provide digital displays with two decimal places in seconds.
Percentage of dissolved coffee solids (TDS) · typical reference values
Reference values · may vary depending on recipe and roast
TDS doesn't indicate quality – in a nutshell
The TDS value alone provides no information about the actual sensory quality of an extraction. Tasting is essential for quality assessment. Nevertheless, a refractometer helps in many areas:
- The strength or concentration of dissolved coffee particles can be measured.
- TDS is a prerequisite for calculating extraction. This gives us an indication of whether a coffee is under- or over-extracted.
- The values signal changes in equipment (e.g., dulling grinder burrs), water, pressure, coffee aging, or channeling.
- Different espresso machine types, baskets, tamping techniques, and dosages can be compared using their extraction analysis.
- Different coffees (origin, altitude, variety) can be explored when they show very different extraction values under consistent parameters.

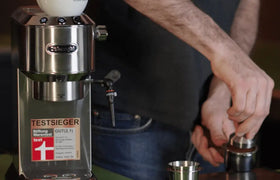
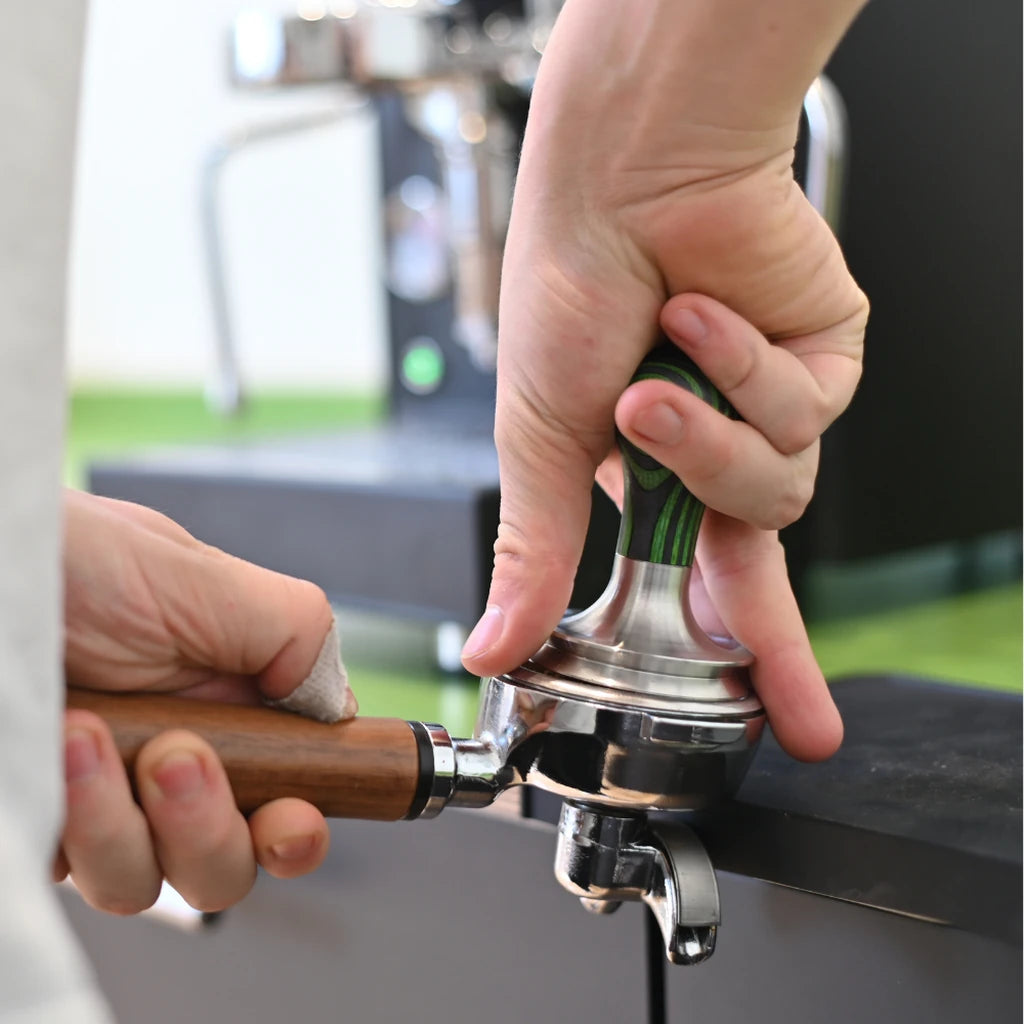
VST Refractometer in use
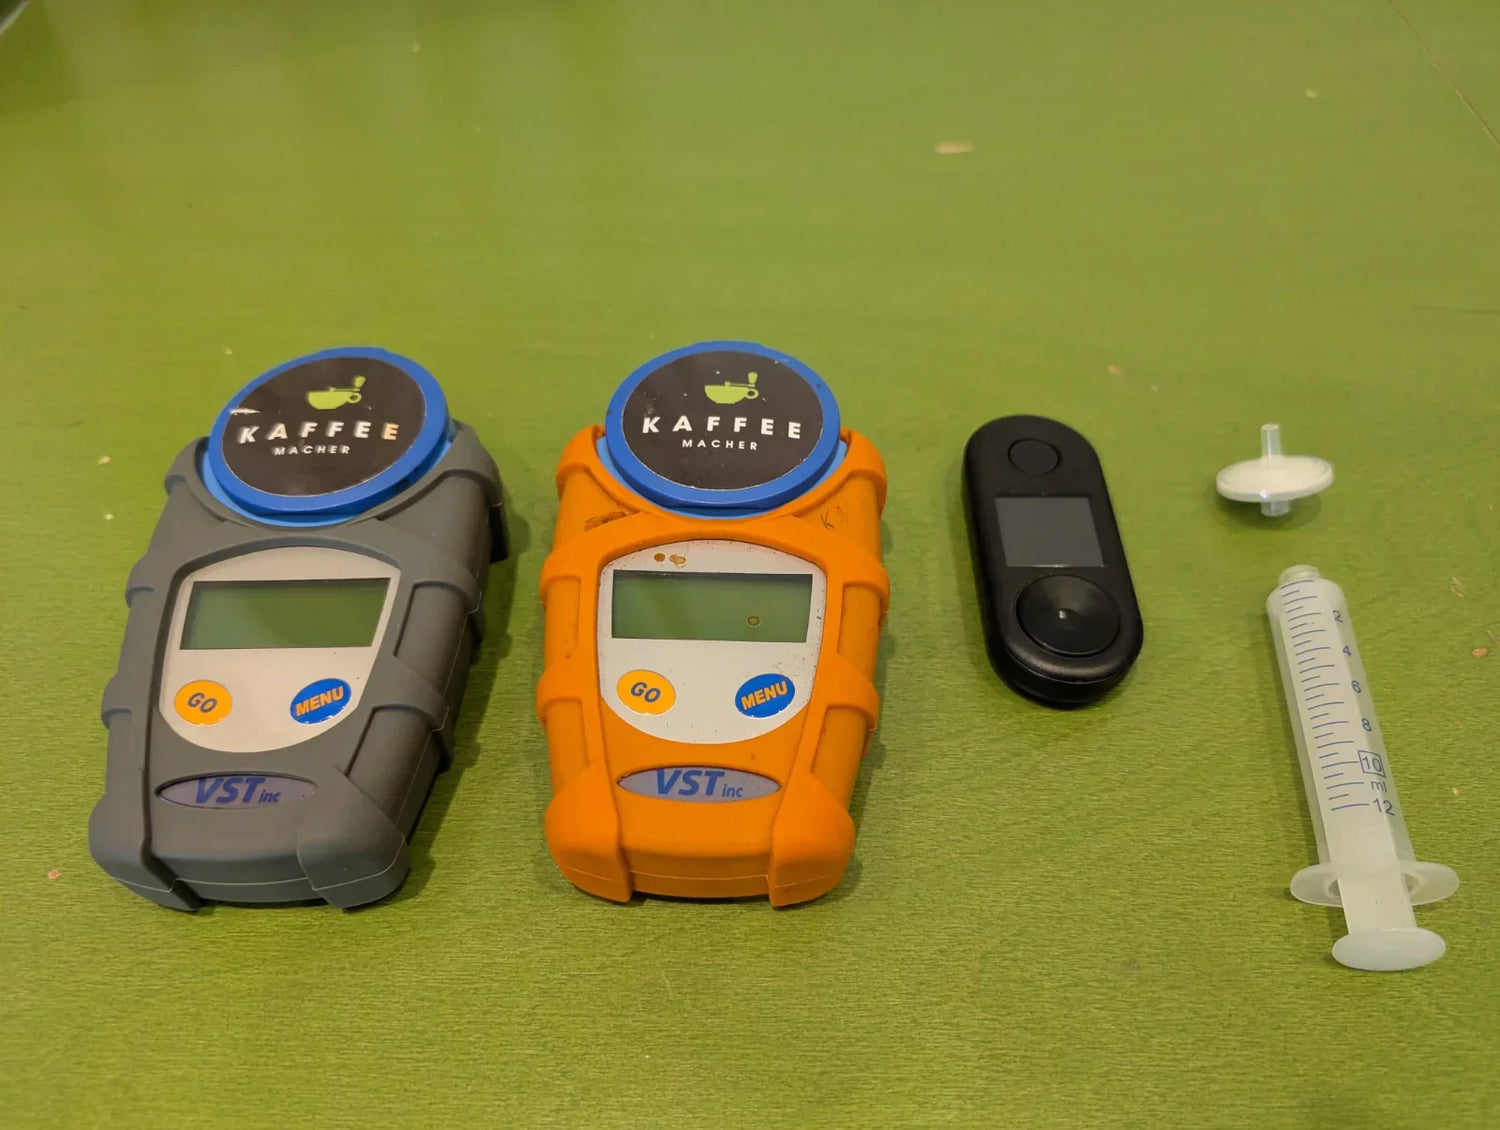
Overview of common coffee refractometers
In specialty coffee, several digital refractometers have become established, which vary in precision, features, and price. Here is an overview of the three most well-known models:
| Model | Accuracy | Price | Special feature |
|---|---|---|---|
| VST LAB Coffee III | ±0.02 % (Filter) ±0.05 % (Espresso) |
~1,000 € | Gold standard, sapphire optics, software included |
| Atago PAL-COFFEE | ±0.15 % | ~450 € | Robust, waterproof, up to 100 °C |
| DiFluid R2 Extract | ±0.02 % | ~250 € | Bluetooth app, USB-rechargeable, IP67 |
VST LAB Coffee III
The Lab Coffee Refractometer from Voice Systems Technology (VST) is considered the gold standard in the industry. We have three of them – and they have been in service for over ten years.
The VST refractometer measures from 0.00 % to approx. 20 % TDS with an accuracy of ±0.02 % (typical). Automatic temperature compensation in the range of 15–40 °C, sapphire optics, and a 1024-pixel sensor array ensure reliable measurements. VST includes the CoffeeTools software directly – it has been used as the official tool at world championships (Brewers Cup, Barista Championship) for years. The price is in the four-digit range.
Atago PAL-COFFEE
The PAL-COFFEE from the Japanese manufacturer Atago is a handy pocket refractometer. We have been using a PAL-Coffee refractometer since 2018 – in brewing courses and at championships.
Measurement time ~3 seconds, automatic temperature compensation up to 100 °C, accuracy ±0.15 % TDS. Sufficient for espresso, a bit coarse for filter coffee. The robust, waterproof design makes it ideal for the busy cafe daily routine.
DiFluid R2 Extract
The DiFluid R2 Extract from China has been causing a stir since 2022 as an affordable alternative. Despite the low price, it offers an accuracy of ±0.02 % TDS, is USB-rechargeable, and IP67 waterproof. So, it doesn't matter if some espresso spills over it.
Especially practical: Via Bluetooth, the R2 connects to the DiFluid Cafe app, which saves measurements, creates statistics, and updates the device. An ideal tool for ambitious home baristas or as a secondary refractometer for on the go.

They are often only designed for high Brix values, are too imprecise in the low TDS range, and require manual reading. Anyone wanting to seriously work with coffee measurement should opt for the coffee-specific devices mentioned above.
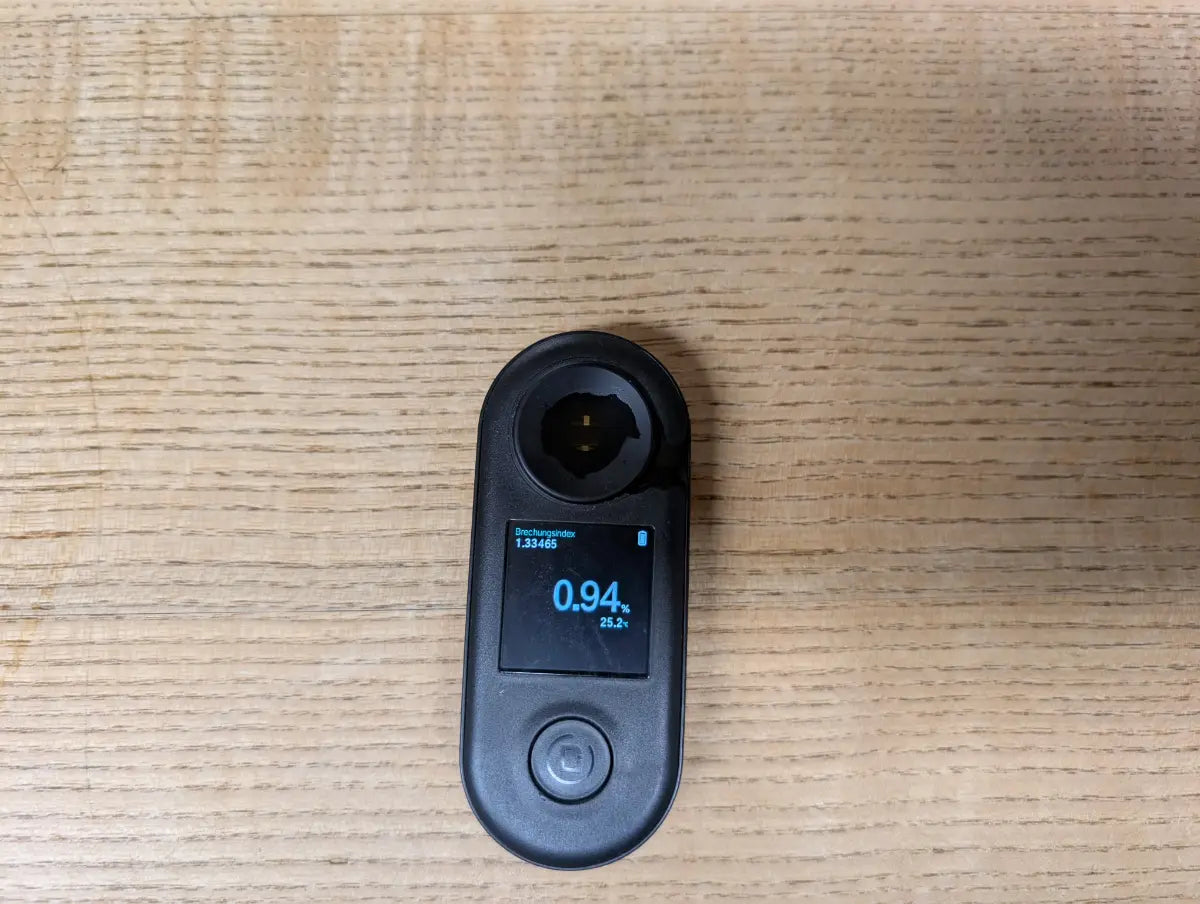
Working principle and correct application
The refractometer sends a beam of light through the sample onto a prism and measures the angle at which the light exits. The more concentrated the solution, the more the light is refracted. Above a certain angle of incidence, total reflection occurs – this critical angle depends directly on the refractive index of the liquid. The device calculates the TDS value from the critical angle.
Since coffee consists of hundreds of chemical compounds, the relationship between refractive index and TDS is not simply linear. VST analyzed thousands of samples – refractometrically and by drying – to develop their algorithms. Modern coffee refractometers contain these empirical curve formulas as a chip so that light refraction can become reliable percentage data.
Equally important is temperature compensation. Heat changes the density of a liquid and thus the refractive index. All high-quality devices have automatic temperature compensation (ATC), but the rule remains: For maximum accuracy, let the sample cool down to room temperature, especially for espresso.
Coffee solutions – especially espresso – always contain the finest insoluble particles and emulsified oils, which distort the refractive index. For precise measurements, filter paper or syringe filters (e.g., 0.5 µm pore size) are used. Filtered espresso samples typically show a slightly lower but more reproducible TDS value.
Step by step: How to measure with a refractometer
Understanding coffee strength (TDS) and extraction yield (EY)
Once you have determined the TDS value, the question arises: Is that good or bad? This is where the extraction yield (EY) comes into play. It indicates what percentage of the original ground coffee has transferred into the solution. Anyone brewing 20 g of coffee and having 4 g dissolved in the cup has extracted 20 %. Under-extraction results in an acidic, thin taste; over-extraction leads to bitterness. Balance is traditionally found at 18–22 % extraction.
Formula for determining the Extraction Yield (EY)
17.8 % is slightly below the ideal range (18–22 %) – a bit more body would have been possible.
Besides extraction, strength (TDS) itself also influences the sensory experience. An espresso with 10 % TDS and 20 % extraction tastes fundamentally different from a filter coffee with 1.3 % TDS at 20 % extraction – despite an identical extraction rate. The former is ten times more concentrated. Therefore, typical TDS ranges have become established for different brewing methods: filter coffee approx. 1.2–1.5 %, espresso approx. 8–12 %, moka pot approx. 3–5 %, French press approx. 1.2–1.7 %, cold brew typically 1.4–1.6 %, cupping approx. 1.2–1.4 %.
SCA standard · extraction vs. strength (TDS)
SCA Golden Cup Standard · for filter coffee · kaffeemacher.de
Apps and software as helpers
No barista needs to rely on calculators and brew charts by hand today. There are apps specifically designed for this purpose that often work seamlessly with refractometers:
- VST CoffeeTools: The software (PC/Mac) developed by VST takes TDS, coffee weight, and beverage weight and calculates extraction and provides graphical analysis. Included when purchasing the VST refractometer.
- MoJo To Go: A mobile app from VST – famous because it ran on the iPod Touch starting in 2010 and gave baristas an "extraction toy" in their pocket for the first time. I had an iPhone back then just because of this app. Today part of the CoffeeTools family.
- DiFluid Cafe App: Receives TDS live via Bluetooth, calculates the extraction yield after entering dose and output, and displays your brew as a point in the SCA brew chart. Values can also be integrated into Bean Conqueror.
- SmartRef Coffee Meister: App by Anton Paar for their SmartRef lab refractometer. Calculates TDS and extraction – intended more for roasters and laboratories.
Strength remains constant at 1.35 % · Extraction varies from 14 % to 28 %
under-developed
Golden Cup Standard
dry in the finish
This is my absolute favorite recommendation as an exercise to improve your own sensory skills: Lock TDS at 1.35 % and then work through all extraction values from 14 to 28 %. The strength remains the same, but you notice very clearly how under-extraction and over-extraction feel at identical intensity. No textbook conveys this as clearly as this direct comparison.
Critical reflection: Accuracy, sources of error, and utility
For all the euphoria about precise measured values: A refractometer is a tool, not a taste oracle.
- Absolute accuracy vs. practice: Manufacturers advertise ±0.02 % TDS. In practice, the actual deviation can be higher, depending on calibration and careful handling. The Atago has ±0.15 % – a true TDS of 1.30 % could therefore be displayed as 1.15 % or 1.45 %. For comparative measurements (recipe A vs. B), all devices are sufficiently accurate. But: No palate on earth tastes the difference between 1.37 % and 1.40 % TDS.
- Sources of error: Residues from the last coffee on the prism, sample not mixed correctly, not filtered, measured too hot – everything distorts the value. Always stir well, pipette cleanly, zero the device. Repeated measurements should differ by max. ±0.03 %, otherwise there is a user error.
- Oils in espresso: Coffee oils are hydrophobic and can slightly influence the refractive index as an emulsion. Therefore: Always proceed the same way – either always filter or never filter. In competitions and labs, filtering is standard procedure.
- TDS is not taste: The refractometer measures quantity, not quality. Two coffees can have identical TDS and EY and taste completely different. Numbers don't lie, but they don't tell the whole truth. A high extraction value of 24 % doesn't necessarily indicate over-extraction – if the coffee still tastes good, it isn't.
- Eyebrows raised in the community: There were remarks like "If you don't know TDS and EY, you're not a competent barista." This caused resentment – understandably. Today, the discussion is more matter-of-fact. The refractometer demystifies some aspects of brewing but takes away neither creativity nor sensory fine-tuning.
If the coffee tastes watery and the refractometer confirms a TDS of 1.0 % (instead of 1.3 %), you know objectively: too thin – next time use more dosage or grind finer. This helps you connect cause and effect faster.
Scientific context and new findings
Full immersion, fixed extraction
In 2021, a study (Liang et al., Scientific Reports) showed that in immersion brewing, the extraction yield is fixed within a narrow range – a thermodynamic equilibrium. For cuppings between 80 °C and 99 °C, the equilibrium extraction was always around ~20 %, regardless of the water quantity. More water dilutes the coffee (TDS drops) but does not extract significantly more in percentage terms.
TDS vs. taste – cold brew vs. hot brew
In 2022, Batali et al. investigated the sensory difference between cold brew vs. hot brewed coffee with identical TDS (~2 %). Result: Hot brewed coffee tasted more bitter and acidic, cold brewed tasted sweeter and more floral. Therefore, the brewing temperature influences which substances are dissolved – even if the total amount is the same.

Grinding, fines, and extraction dynamics
A paper from 2024 (Smrke et al., Scientific Reports) investigated the influence of fines on espresso extraction. More fines → lower permeability, slower flow, higher extraction yield. But: Aromatics do not increase linearly with extraction. Beyond a certain point, volatile aromas evaporate during the longer extraction time. An espresso with 25 % extraction might have less aroma in the cup than one with 22 %. Learning: A uniform grind size with a moderate fines content benefits both flow and flavor balance.
Conclusion on the refractometer
Refractometers have developed from a laboratory device into the secret weapon of modern coffee preparation. In my daily brewing practice, the refractometer appears only rarely – but for test series, championship preparations, and setting up recipes in our cafes, it is a central tool.
Especially during preparations for national Brewers Cup championships – but also at the World Brewers Cup in Rimini 2024 – the refractometer helped me understand the brewing of filter coffee and espresso much better. It also helped me improve my own sensory skills. Twelve years after buying my first refractometer, I still love the game of tasting to compete with the device: brewing coffee, estimating TDS, measuring – even if you are off, you learn something.
Models like the VST, Atago, or DiFluid offer the right tool for the most diverse requirements. In combination with apps, dialing in recipes becomes a data-supported pleasure. Nevertheless, the following applies: Numbers serve the taste, not the other way around. A refractometer says what happened – whether the result is good is still decided by tongue and nose.
Ultimately, refractometers are a valuable tool to ensure consistency and support learning processes. When you bring both together – sensory expertise and measurement data – you can refine coffee perfection almost alchemically. May your coffee be delicious and your TDS on point. ☕️


