


Last updated: Oct 3, 2024
At the center of our investigation is the measurement and determination of our CO₂ footprint. For the year 2022, we measured the emissions of our roastery for the first time. Now, the results for 2023 are available.
- Where do emissions occur?
- Why do emissions occur?
- What alternatives are there?
- Where is it worth investing to bring about changes quickly?
Our roasting volume in Basel increased to 67 tons of green coffee in 2023. This increased our absolute CO₂ footprint. However, because we have become more efficient in our processes, the emissions per kilogram of green coffee are lower than in the previous year.
How did we measure?
We collected our relevant data, assigned CO₂ equivalents with the help of the Ecoinvent database, and had the whole process verified by carbotech. We poured the data set into a CO₂ calculator for roasteries. We are making this calculator available to you; feel free to get in touch if you also want certainty about your emissions.
In this article, you can find more details about our calculator.
We checked and verified our data together with carbotech.
INFO: Who is carbotech?
Since its founding in 1987, the company has specialized in environmental issues. It offers analysis and consulting services for companies and organizations, measures air pollutants, and oversees the remediation of contaminated buildings. Furthermore, the company provides its clients with decision-making foundations such as life cycle assessments or material flow analyses. It also supports international environmental projects and develops environmental and sustainability indicators for companies and authorities.
Allocation of data
The data is recorded and assigned according to the GHG Protocol. Since we see ourselves as responsible for indirect emissions as well, and for all emissions along the value chain, it played a subordinate role for us in which “scope” the emissions occur. Because where we do not directly cause emissions, we can exert influence through the choice of alternatives.
- Scope 1 covers direct emissions. In our case, this is the burning of gas during roasting and the burning of diesel in our vehicle.
- Scope 2 covers indirect emissions that we cause directly at our location, such as heating and electricity consumption.
- Scope 3 covers emissions that are related to the company but are not completely under our control. A distinction is also made here between "upstream" and "downstream".
- Upstream emissions occur during the production of goods or services that a company purchases or uses.
- Downstream emissions occur after the production of a company's products or services during their use or disposal.
Calculation 2022
| Category | Scope 1 | Scope 2 |
Scope 3 |
| Area |
|
|
|
| Emissions CO2e |
5,281.40 |
1,107.51 |
15,733.09 |
Calculation 2023
| Category | Scope 1 |
Scope 2 |
Scope 3 |
| Area |
|
|
|
| Emissions CO2e |
6,686.46 |
481.15 |
20,505.45 |
Why we do not include green coffee
We consciously do not include green coffee in our CO₂ calculation for the roastery, but look at our coffees separately. Cultivation can account for up to 90% of emissions; for the 2022 harvest on our Finca Santa Rita, cultivation accounted for over 62% (if you include transport to our roastery, it was 84%). Therefore, we look at each of our coffees individually, year after year.
Because not only is every coffee different, but so is every harvest. Different weather conditions influence the need for fertilizers and pesticides, as well as the yield.
We want to take a closer look where most emissions occur and not communicate an average value for our coffees, but publish them annually adjusted and recalculated to make the differences transparent.
Because even if, apart from Santa Rita, the emissions are not in our hands, we buy and sell this coffee and therefore the responsibility for the emissions lies with us.
For our Finca Santa Rita, we calculated a footprint of 1.57 kg CO2e per kg of exportable green coffee for the 2022 harvest. An often-cited study* indicates 10.44 kg CO2e for 1 kg of conventional Brazilian green coffee. Another study**, which compares 116 farms with different cultivation methods ("Traditional polyculture", "Commercial polyculture", "Shaded monoculture", "Unshaded monoculture"), arrives at an average of 3.7 kg CO2e per kg of green coffee. Comparing the different values per farm, figures between 3.3 kg and 18.8 kg CO2e / kg green coffee are mentioned.
This range is far too wide; a precise calculation is impossible. Instead, we are in exchange with farms, organizations, and companies that are involved in calculating CO₂ footprints.
We also see that fluctuations are present in our roastery emissions. Therefore, it is valuable to calculate and compare our emissions anew each year to continuously improve ourselves.
Our company is growing and our emissions are growing with it.
For the second year now, we are looking at the emissions that are directly related to our roastery. That is, everything relevant that happens between the delivery of the green coffee and the shipment of the roasted coffee.
Our CO₂ footprint 2023

You can find the detailed calculation here.
The CO₂ footprint of our coffee roastery in Basel in 2023 was a total of 27.673 tons of CO₂e, which is about 5.5 tons (8.3%) more than in the previous year. This occurred with an increase in production volume of 17.2 tons of green coffee. This brings us to 0.42 kg CO2e per kg of green coffee. In 2022, it was 0.45 kg CO2e per kg, which is mainly due to the increased production.
86% of the roastery's emissions fall into 3 categories:
- Business travel (41.7%)
- Coffee packaging (23% - with shipping packaging it would be 28.1%)
- Process gas (21.3%)
Business travel
In 2023, flights and the associated business travel were again the largest emission factor for our roastery. Two trips to Brazil, including domestic flights, served to expand our partnership with APAS, get to know Farmerscoffee, and visit the IFES University and Lucas Lousada's research center. Additionally, one person traveled to Nicaragua to taste the new harvest from our farm and visit further farms.
Relationship building and maintenance is an important aspect of our work. Good things can flourish from healthy relationships. We are in regular contact with our partners, but to build long-term partnerships, maintain them, align values, and strengthen trust, personal meetings are necessary. Our partners visit us, or we are on-site - many ideas spring from these encounters and we develop common visions. That is why we will undertake further business trips, but we limit them as much as possible.
Coffee and shipping packaging
Coffee packaging causes the second-highest emissions when looking at roastery emissions. If we add the shipping packaging, then packaging accounted for more than a quarter of the roastery's footprint in 2023.
We switched to mono-PE bags in 2022 (Article here), but had to return to the previous bags due to quality problems. This increases the attributed emissions both in total and proportionally.
However, the figures are deceptive, because if you consider the entire life of a coffee bag, an additional approx. 2.7 kg CO2e/kg packaging*** must be taken into account for thermal recovery. This almost doubles the emissions.
In addition, it must be mentioned that the underlying data refers to the emissions for the production of the films for our bags. Adhesives, inks, zippers, and valves are taken into account based on mass, but the manufacturing of the bags with these extras is missing.
Above all, the production of block-bottom bags requires high energy demand and very large production facilities. Depending on the production site, printing, and choice of color, the value can be stated up to 1 kg CO2e/kg packaging too low.
In addition, there are the boxes in which we send the coffee bag. These do not include the boxes with which we send the coffees to your home. (These boxes are incurred in our shop and are therefore not taken into account.)
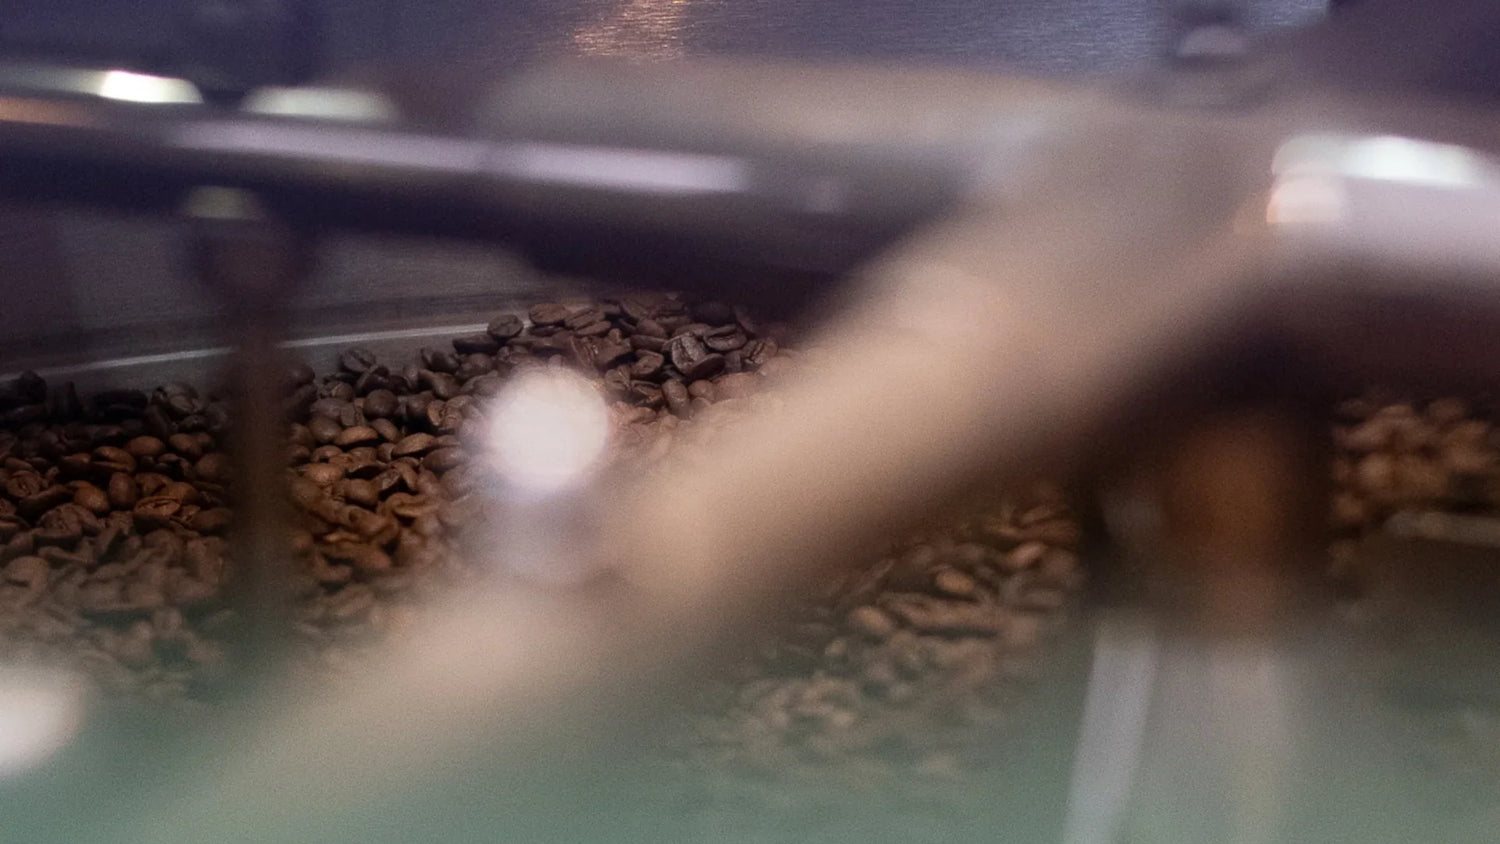
Process gas
This refers to the gas that we need for roasting to operate the roaster. This consumption is naturally linked to the roasting volume. We roast with 100% biogas. Even if we pay for biogas and calculate biogas for the emission calculation, we know that we are not burning biogas. Because with your contribution, you pay for the consumed quantity to be fed in.
What do we do with the result?
In relation to the entire chain, the CO₂ footprint of the roastery is of little weight. If we put the roastery in relation to cultivation, the share is approx. 15% based on the Santa Rita harvest (calculated per kg of roasted coffee). However, the investigations also made it clear to us how much we can improve here too.
It should be highlighted that of this, in turn, only 30% falls under Scopes 1 & 2. Too often, companies focus on communicating Scope 1 and 2 - but in comparison to Scope 3, these are “low hanging fruits”: emissions that can be changed quickly through a conscious decision.
Since 2023, EU companies with more than 250 employees have been obliged to record and report their emissions. That does not affect us and presumably the fewest nano- to meso-roasteries.
However, that is not the driving factor for us. We want to learn as a company and prepare ourselves for the future. Together with other social-ecological and future-oriented companies, we want to show how the coffee industry itself can drive the reduction of the CO₂ footprint.
We derive action goals from the results. We mark simple, achievable goals and start projects to address the larger challenges of our industry. This includes, for example, emission-improved coffee packaging.
Improvements in the small from 2022
- We now give coffee grounds and silverskins to the Ratschaft, a neighborhood association that turns them into compost.
- We use sturdier shipping boxes that we can send between our German and Swiss locations and reuse.
- Shipping boxes that are no longer needed are given away.
- Coffee sacks are offered for upcycling projects.
Efforts in the large (Notes 2023)
A major project is the most sustainable coffee packaging possible. We will publish further articles on this.
We are currently checking the implementation of a solar system on the roof of our roastery with structural engineers and the city.
Note 2023
The “Major Project: The best of all coffee packaging” is in its final stages. We will have new packaging in 2025. It is not a sustainable packaging, but a more sustainable one. We have tested, measured, tasted, and reduced as much as possible. And we know it is only one step of many. We must continue to look around, question critically, and try to understand. Only in this way can we improve quality and sustainability.
As announced in 2022, our roof has been decorated with a solar system since January 2024, which can cover our electricity consumption in good weather and still feed into the grid. As soon as we have more data, we can estimate how much of our electricity demand can be covered.
Criticism of the CO₂ assessment
The focus on CO₂ emissions can be criticized, as other environmental impacts are disregarded. For example, high CO₂ emissions can also lead to the pollution of bodies of water and soil. And further environmental impacts, such as the reduction of biodiversity or the emission of other pollutants, are not taken into account in the CO₂ assessment.
A comprehensive environmental assessment should therefore take into account different environmental categories and consider the life cycle of a product. Only in this way can a well-founded statement about the actual environmental impact be made. We will therefore continue to use the method of ecological scarcity**** in the future to draw attention to areas that are not apparent from the pure CO₂ assessment.
Sources
** HAL - Carbon footprints and carbon stocks reveal climate-friendly coffee production
*** DIW - Recycling

