


Refractometers are scientific instruments that measure the refractive index of a liquid – in simpler terms, how much light is deflected (refracted) in a medium. In the coffee world, the refractive index is directly related to the concentration of dissolved solids in the coffee beverage, known as Total Dissolved Solids (TDS). The TDS value indicates what percentage of the beverage consists of dissolved coffee components and is therefore a measure of coffee strength. A stronger coffee has a higher TDS percentage, while a weaker one has a lower value. By measuring TDS, baristas can objectively assess and reproduce extraction in the brewing process. With the help of light and a little math, subjective sensory impressions can be translated into tangible numbers – a dream for coffee-loving nerds and a practical tool for anyone striving for consistent quality.
However, not every refractometer from laboratory supplies or winemaking is suitable for coffee. Why? Because coffee is a complex solution of countless compounds, whereas, for example, a simple Brix refractometer is usually only calibrated for sugar solutions. A standard Brix meter displays the sugar content in °Bx (1°Bx = 1 g sucrose in 100 g solution). For coffee, however, a conversion factor would be needed. In fact, 10 °Bx corresponds to approximately 8.5% TDS in coffee, which can be expressed by a simple factor (~0.85). In addition, many inexpensive handheld Brix meters only have coarse scales (resolution often 0.2 °Bx, which corresponds to approx. 0.1% TDS) and require bright transmitted light and manual reading. For the subtle differences in filter coffee (typically ~1.3% TDS), they are too imprecise and cumbersome. Specialized coffee refractometers, on the other hand, are precisely calibrated for coffee solutions and provide digital readings with two decimal places in seconds. In the following, we will take a critical but humorous look at the common models, how they work, how to calculate strength and extraction yield with them, what pitfalls there are, and what new scientific findings are emerging about coffee extraction.
TDS says nothing about quality - In a nutshell
The TDS value alone does not provide information about the actual sensory quality of an extraction. Tasting is essential for quality assessment. Nevertheless, a refractometer helps in many ways:
- The strength or concentration of dissolved coffee particles can be measured.
- TDS is a prerequisite for calculating extraction. This gives us an indication of whether a coffee is over- or under-extracted. See also the video on this topic below.
- The values signal changes in the material (e.g., grinders due to blunt burrs), the water (soft or hard water dissolves more or fewer substances from coffee), the pressure (e.g., pressure drop in the espresso machine due to limescale formation, etc.), the aging of coffee, or channeling.
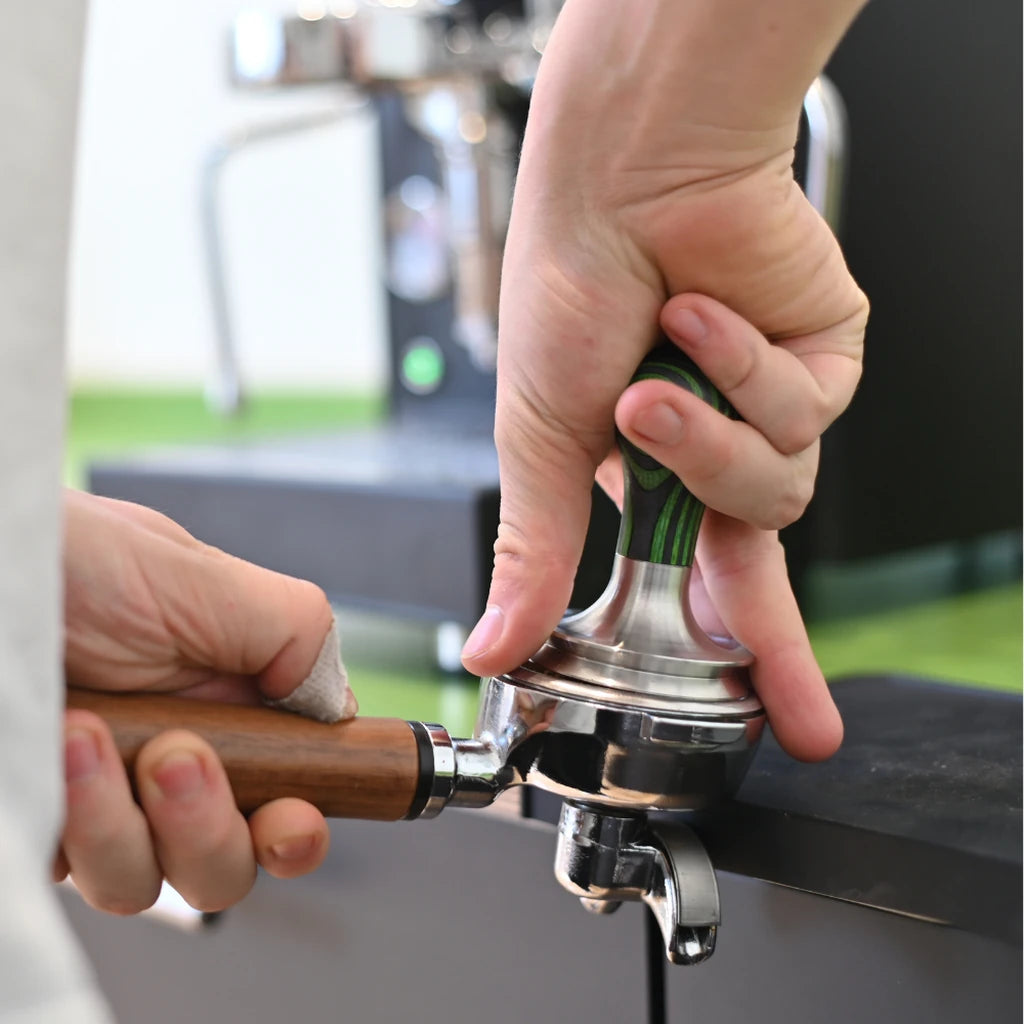
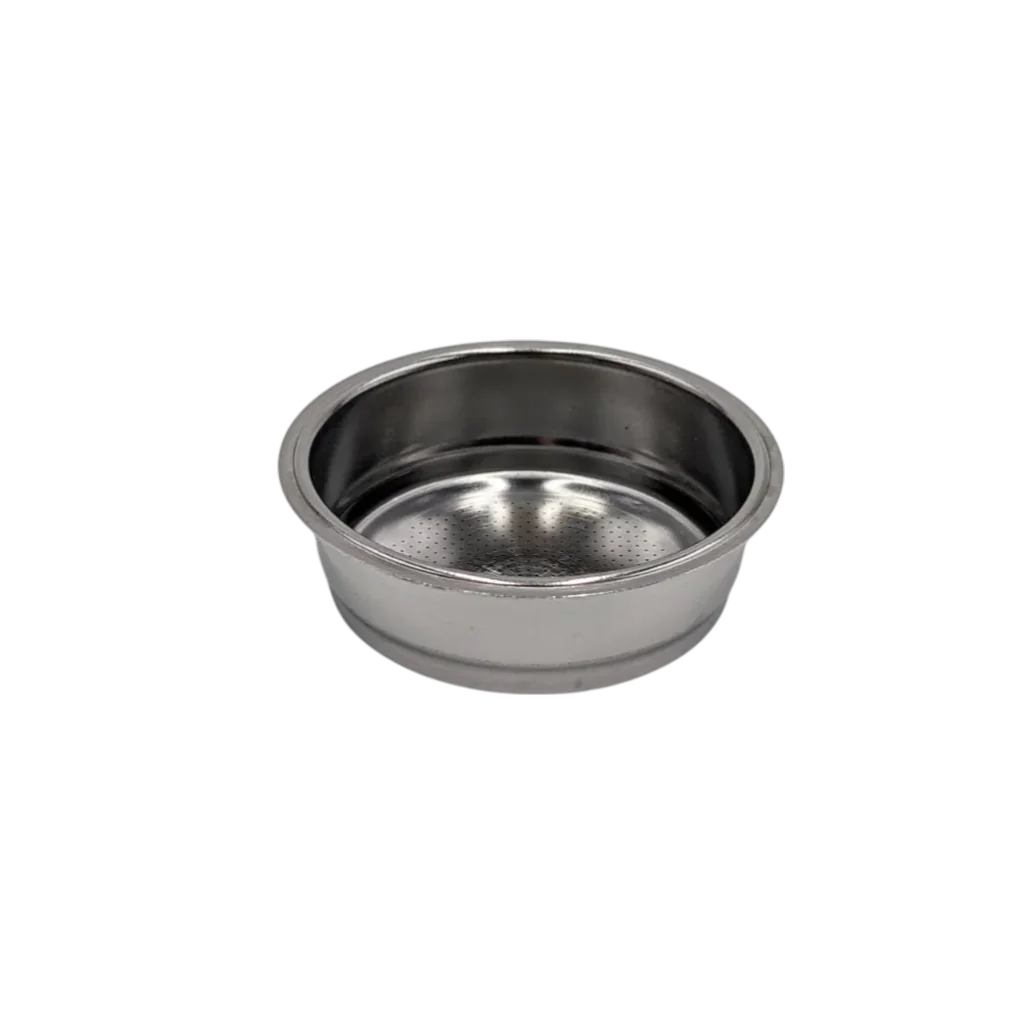
- Different espresso machine types and sieves can be compared using their extraction evaluation, as can tamping techniques, fill levels in portafilters, etc.
- Different coffees (origin, altitude, variety) can be discovered anew when they are subjected to consistent external brewing parameters and very different extraction values are measured.

VST Refractometer
Overview of common coffee refractometers
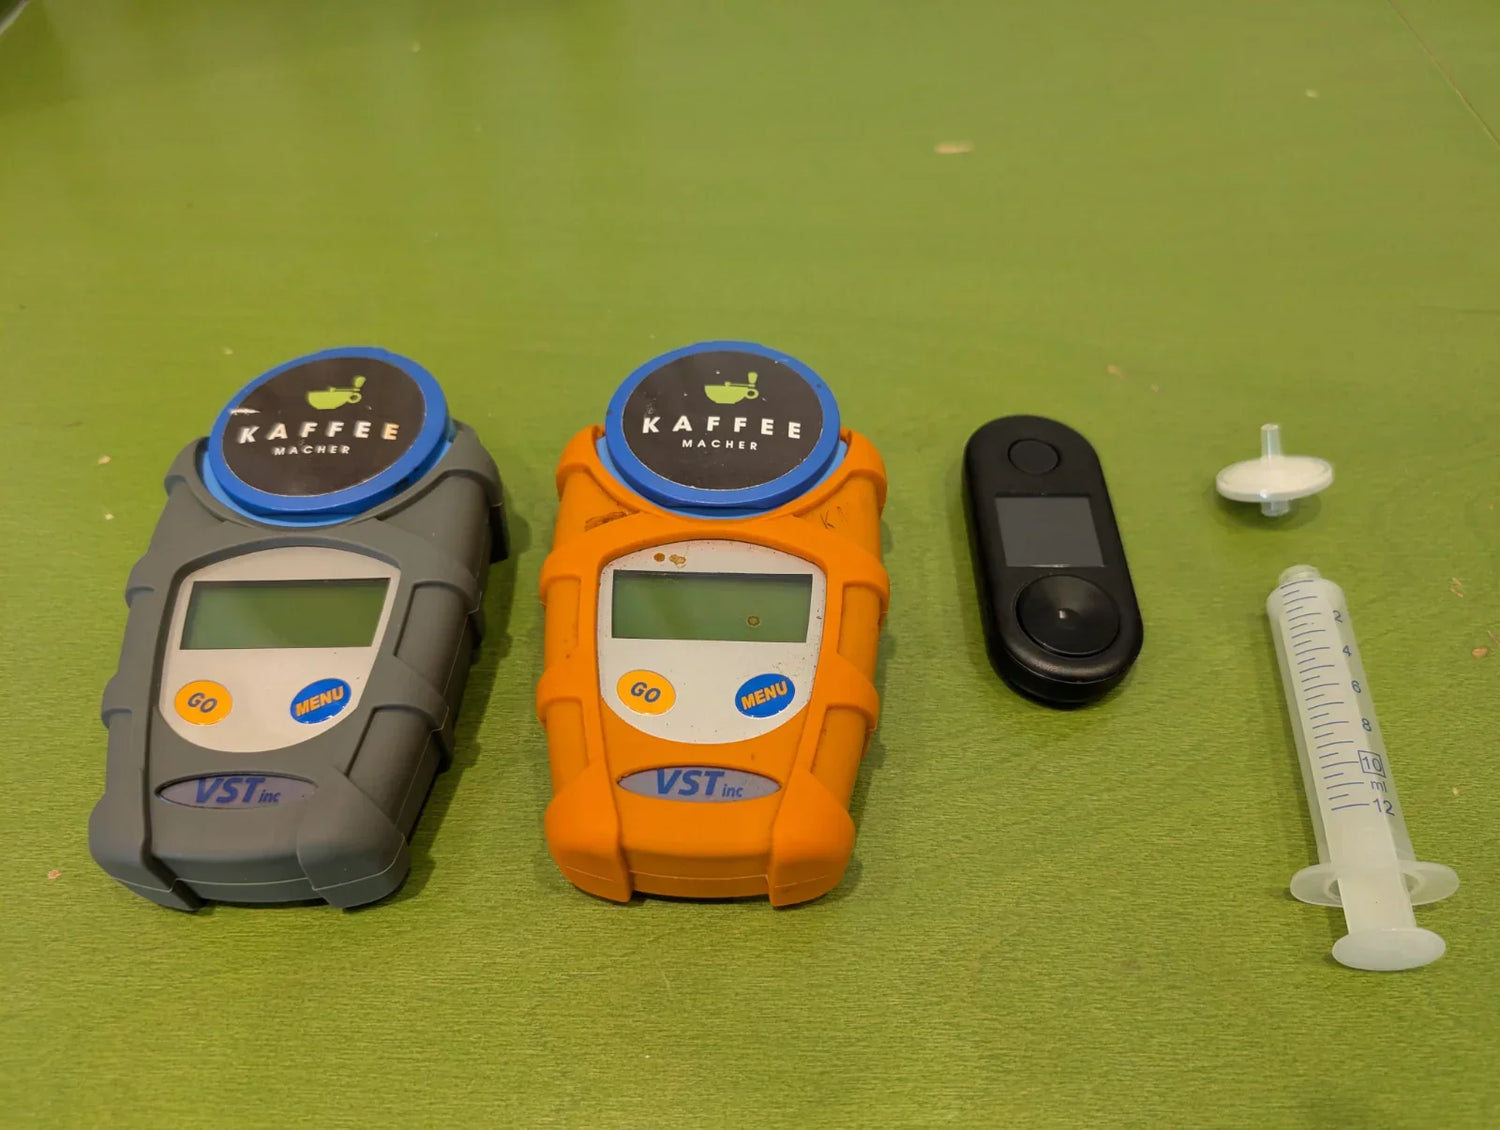
In specialty coffee, several digital refractometers have become established, varying in precision, features, and price. Here is an overview of the three most well-known models:
VST LAB Coffee III
The Lab Coffee Refractometer from Voice Systems Technology (VST) is considered the gold standard in the industry. We have three models of this refractometer, and they have been performing their duty day in and day out for more than 10 years now.
The VST Refractometer measures coffee strengths from 0.00% to approx. 20% TDS and achieves an outstanding accuracy of ±0.02% (typical). For espresso samples (with higher concentration), the accuracy is slightly lower at approx. ±0.05% – still very precise. The device offers automatic temperature compensation in the range of 15–40°C, which is practical if the sample has not yet cooled down completely. High-quality sapphire optics and a 1024-pixel sensor array ensure reliable measurements. VST supplies CoffeeTools software for PC/Mac directly, which enables extraction calculation and data analysis. It's no wonder that VST refractometers have served as official tools at world championships (Brewers Cup, Barista Championship) for years. The only drawback is the price – professional quality comes at a professional price (in the four-figure range including software and filters).
Atago PAL-COFFEE
The PAL-COFFEE from the Japanese manufacturer Atago is a handy pocket refractometer and a popular all-rounder. It can display both Brix values and TDS directly (dual-scale versions are available). We have had a PAL-Coffee Refractometer since 2018 and use it in brewing courses and championships.
With a measuring time of only ~3 seconds and automatic temperature compensation up to 100°C, it is even suitable for hot samples directly after brewing. The accuracy is ±0.15% TDS. Perhaps a little coarse for filter coffee, but sufficient for espresso. Many appreciate the robust, waterproof design (ideal for the hectic café everyday life) and the simple operation with only two drops of sample. Practical: Thanks to the Brix scale, it can also be used for other purposes, such as measuring sugar solutions or fruit juices – but when testing coffee, you should switch to the TDS display to get direct percentages of coffee extract. The PAL-COFFEE is priced lower than the VST, but still in the higher triple-digit range.
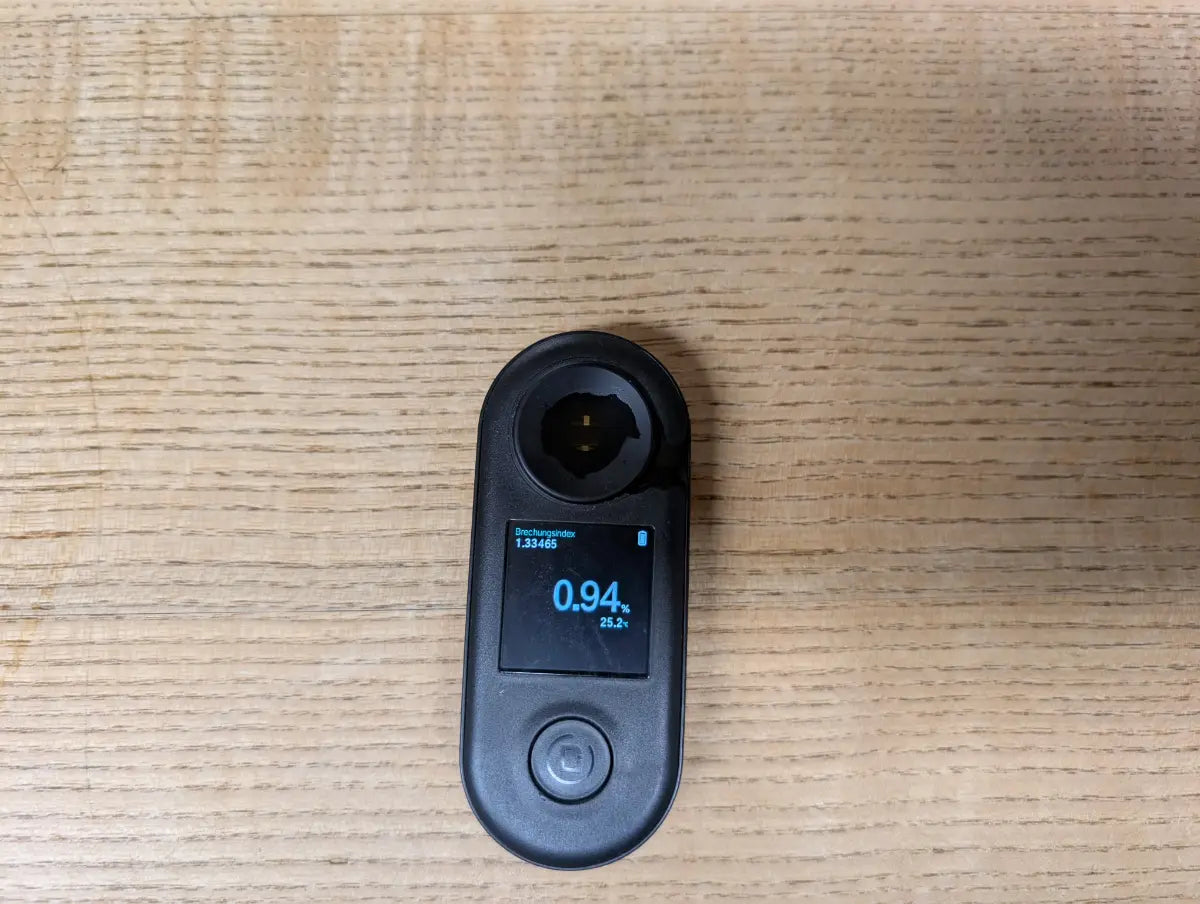
DiFluid R2 Extract
The newcomer DiFluid R2 Extract from China has been causing a stir since 2022 as a low-cost alternative. Despite a significantly lower price, it offers impressive accuracy of ±0.02% TDS and a wide measuring range of 0 to approx. 25% (according to the manufacturer up to 30% TDS). The device is small, USB-rechargeable, and IP67 waterproof. So, it can withstand an espresso spill without giving up the ghost.
The app integration is particularly innovative: The R2 connects to the DiFluid Café smartphone app via Bluetooth, which stores measured values, creates statistics, and even provides updates for the device. The large display on the device itself already shows all important data (including temperature) and simplifies operation with just one button. An aluminum sample tray is included, which ensures rapid temperature stability. In short: The R2 offers many features of the high-end devices at a bargain price. An ideal small tool for ambitious home baristas or as a secondary refractometer to take with you.

Note: Simple analog refractometers for, e.g., wine or honey are usually unsuitable for coffee. They are often designed only for high Brix values and are too imprecise in the low TDS range, or they require manual reading, which is subjective and error-prone. So, if you want to work seriously with coffee measurement, it's better to choose the coffee-suitable devices mentioned above.
Principle of operation and correct application
How does a coffee refractometer work? Simply put, the device sends a beam of light through the sample onto a prism and measures the angle at which the light exits the sample. The denser or more concentrated the solution, the more the light is deflected (refracted). At a certain angle of incidence, total reflection even occurs. The light is then completely reflected back into the medium. This critical angle depends directly on the refractive index (RI) of the liquid. Digital refractometers use this principle: They scan different angles and detect when no light passes through anymore. From the critical angle, the device calculates the refractive index of the sample.
In coffee, the refractive index is a function of the dissolved solids (TDS), but not a simple linear one. The relationship between RI and coffee concentration is quite complex and not strictly linear, as coffee consists of hundreds of chemical compounds. For example, VST had thousands of samples of different coffees, roasts, and brewing methods analyzed during the development of their algorithms by determining the TDS both refractometrically and by drying. A conversion formula can be derived from such data sets so that the refractometer display can show % TDS directly without the user having to calculate it themselves. Modern coffee refractometers therefore essentially contain the empirical results of many laboratory tests as clever curve formulas in their chip, so that light refraction reliably converts to percentages.
In addition to calibration for coffee solutions, temperature compensation plays a crucial role. Heat changes the density of a liquid and thus significantly changes the refractive index. A hot sample would therefore give an incorrect result if not corrected. That's why all high-quality devices have automatic temperature compensation (ATC) within a certain range (typically approx. 10–40 °C or more). The electronics measure the sample temperature and convert the RI value as if the sample had been measured at, for example, 20 °C. Nevertheless: For maximum accuracy, it is advisable to let the coffee sample cool down to room temperature, especially for espresso. This reduces measurement errors and also protects the device. After all, no one wants to shock the expensive prism assembly with boiling water.
Equally important is sample preparation. Coffee solutions – especially espresso or immersion coffee – always contain the finest, insoluble particles (microparticles, fines from the grind) and emulsified oils. These turbidities distort the refractive index and must be removed for precise measurement. In practice, filter paper or special syringe filters (e.g., 0.5 μm pore size for espresso) are used for this. If an espresso sample is filtered, the measured TDS usually drops slightly because the suspended solids no longer contribute to the apparent solids content. At the same time, however, the precision and reproducibility of the measurement increase significantly.
How to use the refractometer
Step-by-step, the following procedure results in a reliable measurement:
- Calibrate: Before measuring, it is best to check with brewing water whether the refractometer is correctly set to 0.00% (zero adjustment). This eliminates measurement drift or residues on the prism.
- Stir and take sample: For espresso, you typically take a few ml from the middle of the shot (not the crema). I use the pipette or syringe to stir. I draw coffee and inject it back into the vessel. By stirring, we ensure that we take a well-mixed sample.
- Filter: If necessary, clarify the sample through a paper or syringe filter to remove all visible suspended solids. This is particularly advisable for French Press, Moka pot, or espresso, to avoid distorting the result with particles or oil layers.
- Cool down: Cool the sample to approx. 20°C if possible. Hot samples can be measured directly by the Atago or DiFluid (they compensate up to 100°C), but experience shows that TDS values climb slightly when cooling, as density increases – or simply some water evaporates. So, it's better to wait briefly or stir down to room temperature.
- Measure: Place one or two drops of the prepared sample onto the prism, close the lid (if present), and read the value. Modern devices complete the measurement in seconds and directly display the TDS value as a percentage.
- Clean: After each measurement, clean the prism with water and a lint-free cloth. Coffee residues could otherwise dry and affect the next measurement.
Sounds like effort? Admittedly, it feels a bit like a laboratory. But soon the refractometer will be as much a part of the barista's craft as the thermometer is for the chocolatier. With a little practice, the above steps take hardly more than a minute. And the reward is exact data about our coffee.
Understanding Coffee Strength (TDS) and Extraction Yield (E)
Once you have determined the TDS value of your coffee, the question arises: Is this good or bad?
Here, a second important parameter comes into play in addition to strength: the extraction rate (often abbreviated as EY). The extraction rate indicates what percentage of the original coffee grounds has gone into the solution. Simply put: If you brew 20 g of ground coffee and end up with 4 g dissolved in the cup, the extraction was 20%. This value is a central indicator of the brewing degree: too low extraction results in an acidic-thin taste, too high extraction leads to bitterness and astringency. Balance and optimum are traditionally found at around 18–22% extraction. In this range, coffee tastes balanced, with good sweetness and no dominant acidity or bitterness.
The extraction rate can be calculated from the TDS and the brewing values. The classic formula is:

In words: You multiply the weight of the brewed coffee (in grams) by the measured TDS percentage and divide by the amount of dry coffee used. The result is a percentage of the original coffee mass. An example: 20 g of coffee, brewed to 300 g of beverage, with TDS 1.35% results in:


In addition to extraction, strength (TDS) itself also influences the sensory experience. An espresso with 10% TDS and 20% extraction tastes completely different from a filter coffee with 1.3% TDS at 20% extraction – despite an identical extraction rate. The former is simply ten times more concentrated (hence a small, intense shot), while the filter coffee consists of ~98.7% water and feels significantly "thinner" on the tongue. Therefore, typical TDS ranges have been established for different preparation methods:
- Filter coffee (V60, Chemex, filter machine): approx. 1.2–1.5% TDS, at ~18–22% extraction. Mild to medium-bodied, with clear aromas.
- Espresso: approx. 8–12% TDS, also ~18–22% extraction. Very strong and concentrated, syrupy.
- Moka pot (Bialetti): approx. 3–5% TDS, extraction ~18–22%. Stronger than filter, but not quite espresso strength – a "small black" with a pronounced body.
- French Press: approx. 1.2–1.7% TDS, extraction ~18–22%. Similar to filter coffee in strength, but fuller-bodied, as no filter paper holds back oils and fine particles.
- Cold Brew: typically as a concentrate 1.4–1.6% TDS at ~18–22% extraction. Appears mild, as cold-brewed, although the TDS can be high. Often diluted with water/ice when serving.
- Cupping (coffee tasting in the cup): approx. 1.2–1.4% TDS at ~20% extraction.
(Of course, these values can vary depending on the recipe, bean, and taste preference – they are guidelines, not dogmas.) The exciting insight is: Many very different preparations ultimately aim for a similar extraction percentage. The brewing strength (TDS), on the other hand, varies greatly depending on the beverage type. The so-called Brewing Control Chart of the Specialty Coffee Association visualizes exactly this: a coordinate system with extraction on one axis and strength on the other. Within it lies an "ideal" rectangle (around 18–22% E and 1.15–1.45% TDS for filter coffee) as a target range for balanced taste. With a refractometer, you can precisely place your brewed coffee in this diagram – and steer where the point moves with targeted recipe changes (e.g., grind size, dose, water quantity).
Apps and Software as Helpers
No barista today needs to use a calculator and brewing diagram themselves to determine extraction from TDS. There are a number of apps and programs designed precisely for this purpose and often work seamlessly with refractometers:
- VST CoffeeTools: The software developed by VST (for PC/Mac, partly as a mobile app) takes TDS value, coffee dose, and beverage quantity and outputs extraction percentage and even graphical evaluations. It is included with the purchase of the VST refractometer and has virtually become the standard tool in the coffee scene for logging and optimizing recipes.
- MoJo To Go: A mobile app originally by VST, which allows measurements to be entered and saved on the go. "MoJo" became famous as the first barista-oriented tool of its kind – it caused a stir from 2010–2012 because it ran on the iPod Touch, and baristas suddenly had an "extraction toy" in their pocket. Today, the app is part of the CoffeeTools family and continues to serve as a practical notebook for coffee parameters. Back then, I bought an iPhone just for this app.
- DiFluid Café App: DiFluid offers an app that works with the R2 refractometer, receiving data via Bluetooth. It displays the TDS live, calculates the extraction rate after entering dose/output, and can save the results in a cloud. The visualization is particularly nice: you can see your brew ratio, TDS, and extraction on graphs – e.g., as a point in the brewing chart (SCA standard). This quickly helps you understand where your brew stood (strong/weak, under/over-extracted).
- SmartRef Coffee Meister: Behind this cumbersome name is an app from Anton Paar for their SmartRef digital laboratory refractometer. Although the device is an all-rounder (for industry, beverages, etc.), there is a dedicated coffee mode with app support. The app calculates TDS, extraction, and allows results to be managed. Anton Paar, otherwise known for high-precision laboratory instruments, is clearly targeting roasters and laboratories that want to measure coffee quality.
These digital helpers are not just gadgets. They significantly simplify working with the refractometer and eliminate calculations, sometimes performing corrections (e.g., if espresso had to be diluted to measure it) and presenting results clearly. Some allow data export, which is useful for roasters or coffee shop chains to monitor brewing standards. In short: Apps + Refractometer = data-driven coffee enjoyment!
Critical Reflection: Accuracy, Sources of Error, and Benefits
Despite all the enthusiasm for precise measurements, one should not forget: A refractometer is a tool, not a taste oracle. There are a few points to critically examine:
- Absolute Accuracy vs. Practice: Manufacturers advertise accuracies of ±0.02% TDS – which is impressive (2 hundredths of 1%). In practice, the actual deviation can sometimes be higher, depending on calibration and clean handling. The Atago, for example, has ±0.15%, which means a true TDS of 1.30% could be displayed as 1.15% or 1.45% – a noticeable range. VST and DiFluid are significantly finer, but they also have tolerances (VST ±0.1% in the espresso range according to specifications). Important: For comparative measurements (e.g., recipe A vs. B), all devices are sufficiently accurate; tendencies are clearly recognizable. But one should approach perfecting the last decimal place with caution. Moreover, no palate in the world can taste the difference between 1.37% and 1.40% TDS.
- Sources of Error & Pitfalls: The biggest enemy of accurate measurements is unclean procedures. Residue from the last coffee on the prism? -> falsified value. Sample not properly mixed? -> unrepresentative measurement (e.g., weaker at the top than at the bottom). Not filtered? -> suspended solids apparently increase the TDS. Measured too hot? -> device may not fully compensate, or water evaporates during measurement. Tip: Always stir samples well (especially for immersion), pipette cleanly, zero the device, and measure within seconds (possibly cover with the supplied lid, some refractometers have evaporation protection). Then, very consistent results are obtained (repeated measurements should differ by a maximum of ±0.03%, otherwise there is a user error). There are also peculiar characteristics: Some baristas swear by skimming off espresso crema before measuring, because it is lighter and floats on top – in principle irrelevant as long as the sample is stirred, but it shows: the devil is in the details.
- Oils in Espresso: A point often discussed is coffee oils. They are hydrophobic and do not really dissolve in water but can float around as finely dispersed droplets in espresso (emulsion). A refractometer actually only measures dissolved solids, but if enough oil droplets are present, they scatter light similarly to solid particles. This could minimally influence the RI. If espresso is filtered through fine-pored paper, many oils are retained. The measured TDS then drops by a few hundredths. Does this mean unfiltered measurements would be "wrong"? Not necessarily – after all, we drink espresso unfiltered, including the oils, and sensorially they contribute to the body. But for comparative purposes, it makes sense to always proceed consistently (either always filter or always not filter). In competitions or laboratories, filtering is always done to achieve maximum comparability and minimize measurement noise.
- "TDS is not taste": Perhaps the most important critical point: A refractometer can measure quantity, not quality. It tells us how much has dissolved, but nothing about what has dissolved. Two coffees can have identical TDS and extraction percentages and still taste very different – because the dissolved components are different. One recipe might dissolve more acids and less sugar, the other vice versa. Numbers don't lie, but they don't tell the whole truth either. An experienced barista will therefore always consider measurements in context with sensory feedback. Instrumental measurement complements sensory measurement but does not replace it. This is where misunderstandings often arise: a high extraction value (e.g., 24%) could indicate over-extraction – but it doesn't have to, if the coffee still tastes good. Conversely, a coffee with only 17% extraction can be unexpectedly balanced, for example, if the bean was very lightly roasted and less extraction is more palatable. Numbers provide objectivity, but coffee is ultimately a luxury item, not a purity contest.
- Frowns in the Community: Indeed, there have always been heated debates in the coffee scene about the use of refractometers. Some traditionalists saw refractometers as technical frills, others as a threat to their sensory skills. Sayings like: "If you don't know TDS and extraction %, you're not a competent barista" were common. Such statements understandably caused displeasure. Fortunately, the discussion today is on a more factual level. Most have realized that the refractometer is a tool – it can point out errors, ensure consistency, and support training. It demystifies some aspects of brewing (no more voodoo where you don't know why it tastes different today than yesterday). But it doesn't take away creativity or sensory fine-tuning. On the contrary, many top baristas use the device specifically to calibrate their taste impressions. For example, if the coffee tastes watery, and the refractometer confirms a TDS of 1.0% (instead of the target ~1.3%), one objectively knows: too thin – next time, a bit more dosage or grind finer. This way, one learns faster to link cause and effect in the brewing process.
So why a refractometric approach despite all limitations? Because it is another building block on the path to consistently great coffee. As an experienced Q-Grader put it: "The refractometer doesn't replace tongue and nose – but it prevents them from fumbling in the dark so often."
With data, one can test hypotheses (does a finer grind really lead to more extraction? Does pre-infusion help increase strength? etc.) and ensure quality. In times when Specialty Coffee is seen as a craft on par with wine or culinary art, the use of measuring instruments is quite normal. It is important to use them wisely: Coffee is not a numerical puzzle that needs to be solved, but a luxury item that can be elevated to a new level through knowledge and technology – if one wishes.
Scientific Context and New Findings
Coffee science is booming, and refractometers often play a key role in quantifying experiments. Here are some current studies (2021–2024) that are exciting for professional baristas and coffee geeks:
Full Immersion, Fixed Extraction
In 2021, a study in Scientific Reports by Liang et al. showed that for immersion brews (e.g., cupping), the extraction rate is fixed within a narrow range – almost a thermodynamic equilibrium. Interestingly, the TDS could be easily controlled via the brew ratio (coffee/water ratio), but not the extraction (E), which always turned out similarly at a given temperature. In other words: more water dilutes the coffee (TDS decreases), but does not significantly extract more from the grounds proportionally once saturation is reached. Practical implication? For cuppings between 80 °C and 99 °C, the equilibrium extraction was always around ~20% – regardless of the amount of water. So, whoever brews very "thin" cupping coffee (much water, little coffee) ends up with a weak coffee with ~20% extraction; whoever brews very strong gets a powerful one with ~20%. The extraction plateau can be influenced by temperature (higher temperatures dissolved slightly more, lower ones slightly less). This finding overturns the classic Brewing Chart insofar as the degree of extraction is less variable than expected for immersion – the strength, however, very much so, depending on dilution.
TDS vs. Taste – Cold Brew vs. Hot Brew
In 2022, a research team (Batali et al.) investigated the sensory difference between cold brew coffee vs. hot brewed coffee, with both subsequently adjusted to the same TDS (by dilution to 2% TDS). This allowed them to isolate how brewing temperature affects the flavor profile, independent of strength. Result: Even with identical TDS (~2%) and the same extraction, clear sensory differences emerged. Hot brewed coffee consistently tasted more bitter and acidic, while cold brewed coffee tasted sweeter and more floral, across all tested roast levels and beans. Attributes like "rubbery" (an off-flavor) were higher in hot brew, "floral" in cold brew. This refutes the assumption of some skeptics that cold brew is just "watered down" - no, temperature apparently influences which substances are dissolved or how polymers, acids, etc., are extracted, even if the total amount is the same. For baristas, this means: TDS and extraction percentages alone do not explain taste. The manner of extraction (here temperature) plays a large role in the aroma profile.

Grinding, Fines, and Extraction Dynamics
An exciting work from 2024 (Smrke et al., Scientific Reports) focused on the influence of coffee particle size distribution – especially the proportion of fines (ultrafine particles <100 µm) – on espresso extraction (for better understanding, I recommend our article on "Particle Distribution"). The researchers varied the amount of fines in the coffee puck in a controlled manner and measured the effects. More fines led to significantly lower permeability of the puck, the espresso flowed slower, and the extraction time increased. The extraction yield did increase somewhat, but interestingly, they found that aroma compounds do not increase linearly with extraction but show a plateau or even losses from a certain point. They suspect that while higher extraction dissolves more aroma, longer extraction also allows more volatile aromas to escape, even during the extraction. In other words: an espresso with 25% extraction could have less aroma in the cup than one with 22% because the longer extraction time allows for aroma volatilization. Additionally, the study sensorially confirmed that too many fines tend to disrupt the balance – probably due to over-extraction of bitter substances in areas where the water lingers longer. Practical learning: a uniform grind with a moderate proportion of fines favors both flow and taste balance. The refractometer helps track total extraction here, but the fine analysis (aroma via PTR-MS) shows that more extraction doesn't blindly mean better.
In summary, this research shows how important precise measurement is for understanding coffee. Without refractometers (and other measuring methods), many of these findings would not have been possible. Science, in turn, provides exciting insights that professional users can then test in practice ("Science-fueled Coffee!"). It's a cycle: baristas use scientific methods, and scientists investigate barista questions. In the end, all coffee drinkers benefit from better coffee.
Conclusion on the Refractometer: Strength and Extraction Yield
Refractometers have evolved from laboratory equipment to the secret weapon of modern coffee preparation. They allow the quantitative measurement of strength and extraction – two key factors for taste – and thus more conscious control. In my daily brewing practice, the refractometer is only rarely used.
However, for me personally, especially during preparations for national Brewers Cup championships, as well as the World Brewers Cup in Rimini 2024, it was an important tool. The refractometer helped me to understand filter coffee and espresso brewing much better. It also helped me to improve my own sensory skills and challenge myself sensorially. Twelve years after buying my first refractometer, I still love the game of tasting against the device. I brew a coffee and try to call out the correct TDS. Even if I'm wrong, I learn something about the brew.
Models like the VST, Atago, or DiFluid offer the right tool for various needs: from high-end devices with the highest precision to affordable pocket solutions for home use. In combination with apps like VST CoffeeTools or DiFluid Café, monitoring and dialing-in recipes become a data-driven pleasure. Nevertheless, the rule applies: the numbers serve the taste, not the other way around. A refractometer tells us what happened, but whether the result is good is still decided by tongue and nose. However, if you combine both, sensory expertise and measurement data, you can almost alchemically fine-tune coffee perfection.
Ultimately, refractometers, despite some limitations, are a valuable tool for ensuring consistency, supporting learning processes, and further unraveling the mysteries of the cup. They have helped transform coffee from a "feeling drink" into a knowledge drink. And honestly: a bit of nerdiness suits us baristas well, as long as a delicious result ends up in the cup. In this spirit: May your coffee be delicious and your TDS on point! ☕️📈


